. 2021 Jun 25:8:682087.
doi: 10.3389/fmed.2021.682087. eCollection 2021.

Comparison of Residual Pulmonary Abnormalities 3 Months After Discharge in Patients Who Recovered From COVID-19 of Different Severity

Affiliations

Comparison of Residual Pulmonary Abnormalities 3 Months After Discharge in Patients Who Recovered From COVID-19 of Different Severity

Mei Zhou et al. Front Med (Lausanne). .

Abstract

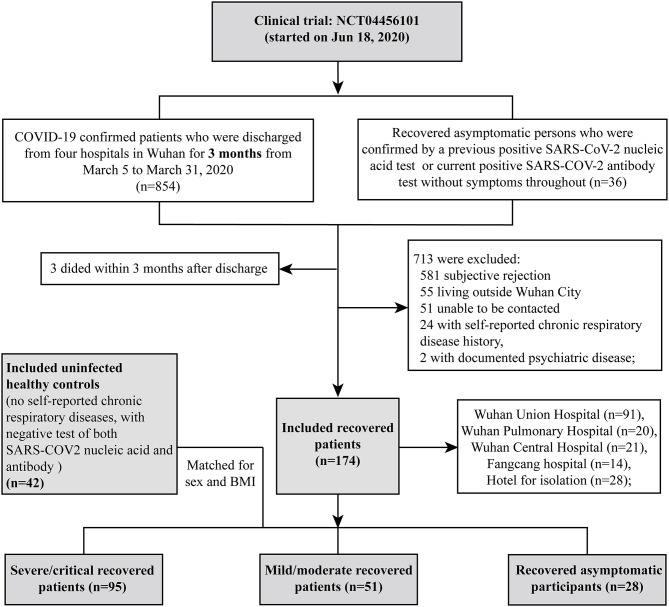
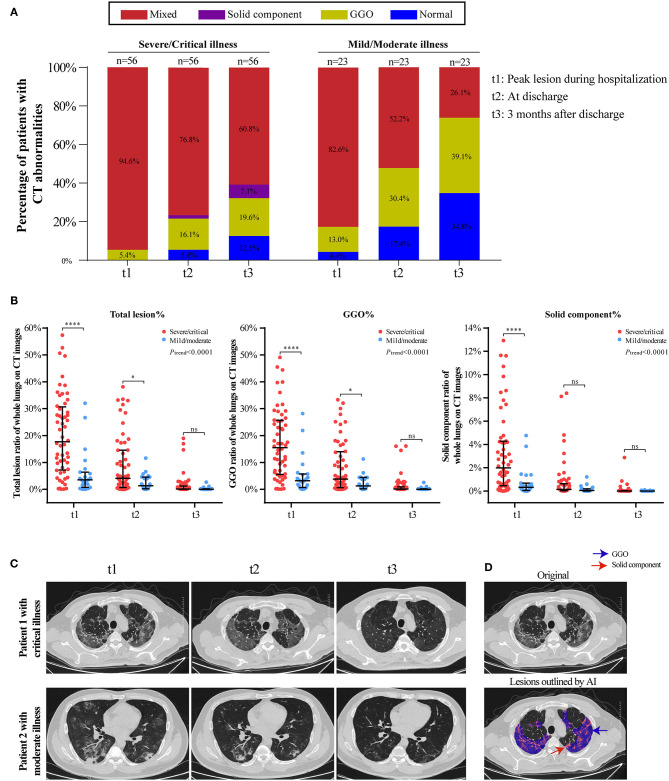
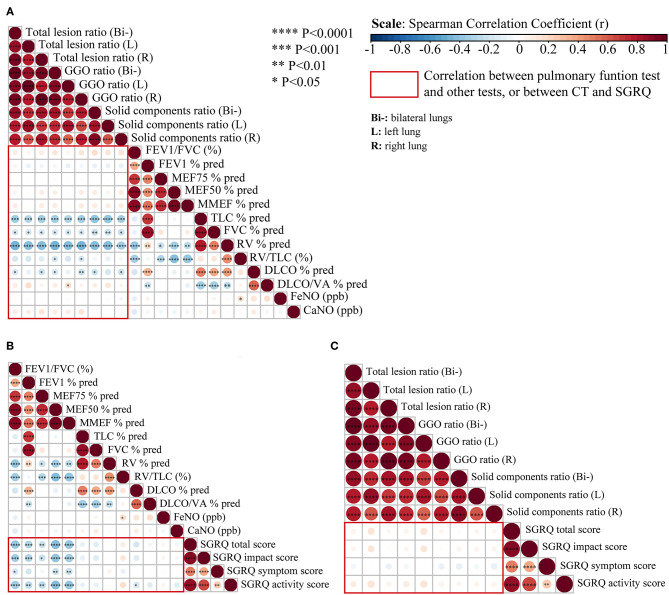
Background and Objectives: To investigate whether coronavirus disease 2019 (COVID-19) survivors who had different disease severities have different levels of pulmonary sequelae at 3 months post-discharge. Methods: COVID-19 patients discharged from four hospitals 3 months previously, recovered asymptomatic patients from an isolation hotel, and uninfected healthy controls (HCs) from the community were prospectively recruited. Participants were recruited at Wuhan Union Hospital and underwent examinations, including quality-of-life evaluation (St. George Respiratory Questionnaire [SGRQ]), laboratory examination, chest computed tomography (CT) imaging, and pulmonary function tests. Results: A total of 216 participants were recruited, including 95 patients who had recovered from severe/critical COVID-19 (SPs), 51 who had recovered from mild/moderate disease (MPs), 28 who had recovered from asymptomatic disease (APs), and 42 HCs. In total, 154 out of 174 (88.5%) recovered COVID-19 patients tested positive for serum SARS-COV-2 IgG, but only 19 (10.9%) were still positive for IgM. The SGRQ scores were highest in the SPs, while APs had slightly higher SGRQ scores than those of HCs; 85.1% of SPs and 68.0% of MPs still had residual CT abnormalities, mainly ground-glass opacity (GGO) followed by strip-like fibrosis at 3 months after discharge, but the pneumonic lesions were largely absorbed in the recovered SPs or MPs relative to findings in the acute phase. Pulmonary function showed that the frequency of lung diffusion capacity for carbon monoxide abnormalities were comparable in SPs and MPs (47.1 vs. 41.7%), while abnormal total lung capacity (TLC) and residual volume (RV) were more frequent in SPs than in MPs (TLC, 18.8 vs. 8.3%; RV, 11.8 vs. 0%). Conclusions: Pulmonary abnormalities remained after recovery from COVID-19 and were more frequent and conspicuous in SPs at 3 months after discharge.

Keywords: chest computerized tomography; health-related quality of life; laboratory findings; pulmonary function; recovered COVID-19 patients.


Conflict of interest statement

The authors declare that the research was conducted in the absence of any commercial or financial relationships that could be construed as a potential conflict of interest.

Figures

Figure 1
Figure 1
Flowchart of participant recruitment.
Figure 2
Figure 2
Temporal changes of CT findings in 56 severe/critical RPs and 23 mild/moderate RPs from hospitalization to 3 months after discharge. (A) The distribution of the main patterns of chest CT abnormalities at three time points (t1: peak lesion during hospitalization, t2: at discharge, t3: 3 months after discharge) among severe/critical and mild/moderate RPs. Staked-bar graphs show the proportion of patients with GGO/solid component/mixed lesions on CT images. (B) The ratio of total lesion, GGO and solid components in the whole lungs at three time points. Linear mixed model (LMM) was applied for comparing the change trend of lesion ratio between severe/critical RPs and mild/moderate RPs, and the statistical difference was indicated by Ptrend. The comparison of lesion ratio between two groups at three different time point is also displayed, respectively, and expressed as ****P < 0.0001; *P < 0.05; ns: not statistically significant. (C) Series CT scans of a representative critical patient and a moderate patient. The upper row showed a 72-year-old man with critical COVID-19 pneumonia and the lower row was a 36-year old man with moderate COVID-19 pneumonia. The lesions on CT images of both patients dramatically decreased from t1 to t3. (D) Schematic diagram of lesions outlined by AI on CT images. The upper image is the original CT slice and the lower one is the AI-based lesion outline. The outlined blue area represents lesions of GGO, and the red area represents lesions of solid component.
Figure 3
Figure 3
Correlation analysis between pulmonary function, chest CT, and SGRQ in recovered severe/critical and mild/moderate COVID-19 patients. (A) Correlation matrices of chest CT abnormalities and pulmonary function test at 3-month follow-up. (B) Correlation matrices of pulmonary function test and St. George's Respiratory Questionnaire (SGRQ) scores at 3-month follow-up. (C) Correlation matrices of chest CT abnormalities and SGRQ scores at 3-months follow-up, (Bi-) refers to bilateral lungs; (L) refers to left lung; (R) refers to right lung. Spearman's correlation coefficient (r) of each comparison group can be visualized from color intensity (blue color represents negative correlation, red color represents positive correlation) and dot size. The correlation analysis among the above three comparison group is highlighted within the red rectangular boxes. Statistically significant correlation with P < 0.05 have been marked as ****P < 0.0001; ***P < 0.001; **P < 0.01, *P < 0.05.

Similar articles

Cited by

References

    1. WHO . Coronavirus Disease (COVID-19) Dashboard. (2021). Available online at: https://covid19.who.int (accessed March 1, 2021).
    1. Hou YJ, Okuda K, Edwards CE, Martinez DR, Asakura T, Dinnon KH, et al. . SARS-CoV-2 reverse genetics reveals a variable infection gradient in the respiratory tract. Cell. (2020) 182:429–46.e14. 10.1016/j.cell.2020.05.042 - DOI - PMC - PubMed
    1. Hui DS, Joynt GM, Wong KT, Gomersall CD, Li TS, Antonio G, et al. . Impact of severe acute respiratory syndrome (SARS) on pulmonary function, functional capacity and quality of life in a cohort of survivors. Thorax. (2005) 60:401–9. 10.1136/thx.2004.030205 - DOI - PMC - PubMed
    1. Antonio GE, Wong KT, Hui DS, Wu A, Lee N, Yuen EH, et al. . Thin-section CT in patients with severe acute respiratory syndrome following hospital discharge: preliminary experience. Radiology. (2003) 228:810–5. 10.1148/radiol.2283030726 - DOI - PubMed
    1. Das KM, Lee EY, Singh R, Enani MA, Al Dossari K, Gorkom KV, et al. . Follow-up chest radiographic findings in patients with MERS-CoV after recovery. Indian J Radiol Imaging. (2017) 27:342–9. 10.4103/ijri.IJRI_469_16 - DOI - PMC - PubMed