. 2021 Feb 17:5:PO.20.00419.
doi: 10.1200/PO.20.00419. eCollection 2021.

Plasma ctDNA Response Is an Early Marker of Treatment Effect in Advanced NSCLC

Affiliations

Plasma ctDNA Response Is an Early Marker of Treatment Effect in Advanced NSCLC

Michael L Cheng et al. JCO Precis Oncol. .

Abstract

Plasma circulating tumor DNA (ctDNA) analysis is routine for genotyping of advanced non-small-cell lung cancer (NSCLC); however, early response assessment using plasma ctDNA has yet to be well characterized.

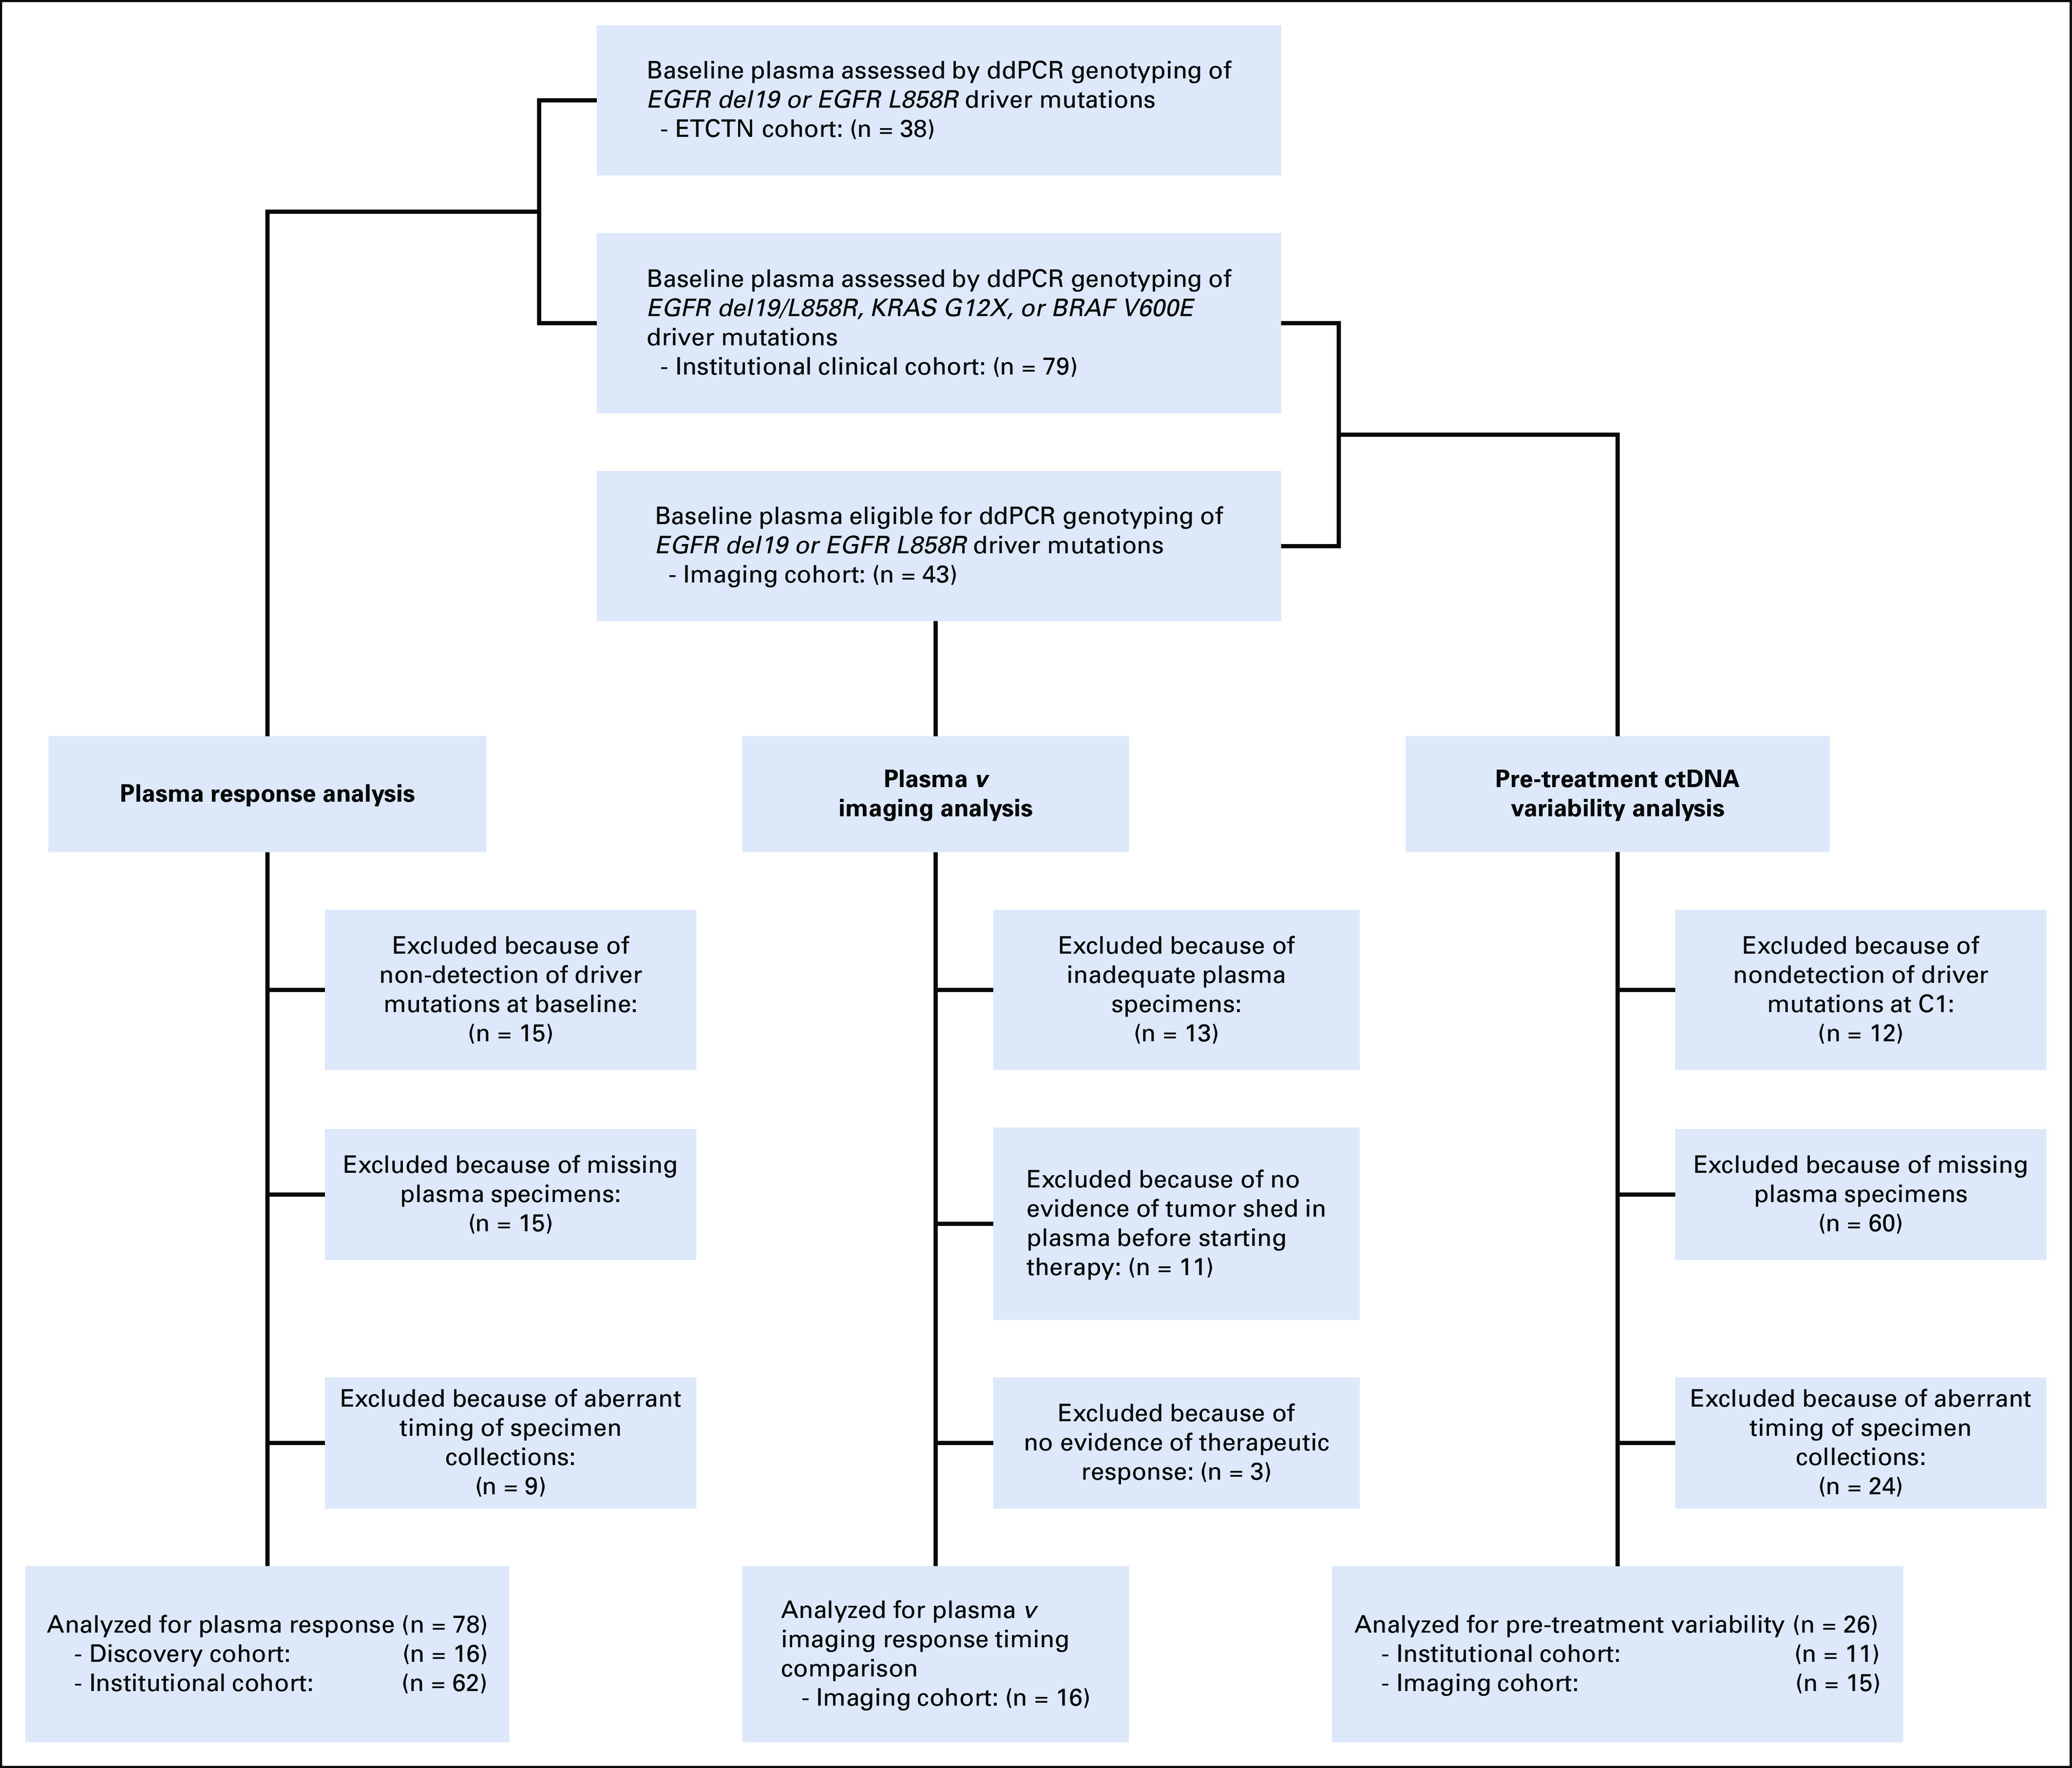
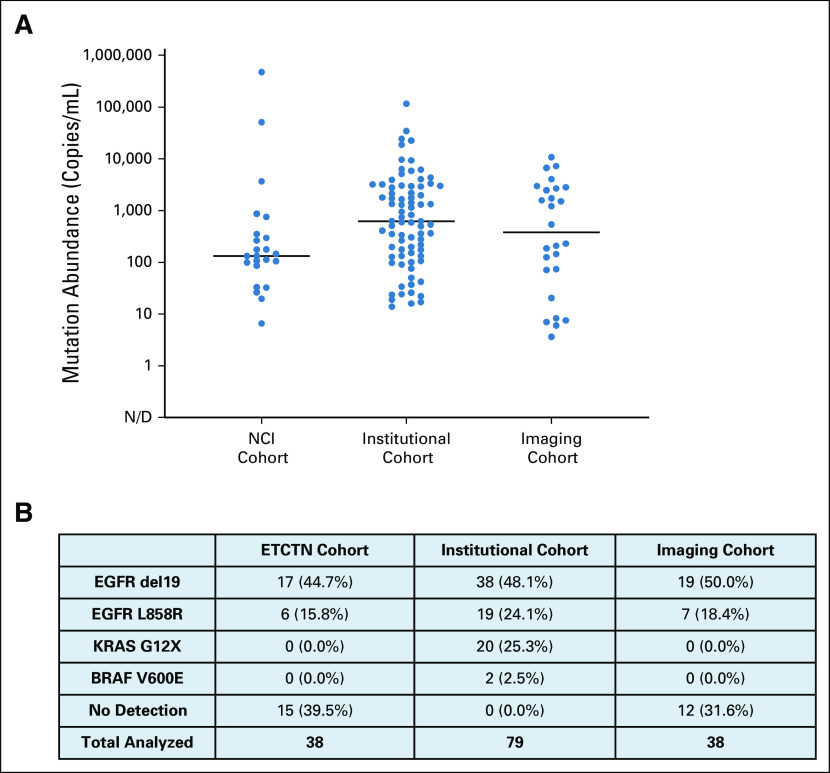
Materials and methods: Patients with advanced EGFR-mutant NSCLC across three phase I NCI osimertinib combination trials were analyzed in this study, and an institutional cohort of patients with KRAS-, EGFR-, and BRAF-mutant advanced NSCLC receiving systemic treatment was used for validation. Plasma was collected before treatment initiation and serially before each cycle of therapy, and key driver mutations in ctDNA were characterized by droplet digital polymerase chain reaction. Timing of plasma versus imaging response was compared in a separate cohort of patients with EGFR-mutant NSCLC treated with osimertinib. Across cohorts, we also studied ctDNA variability before treatment start.

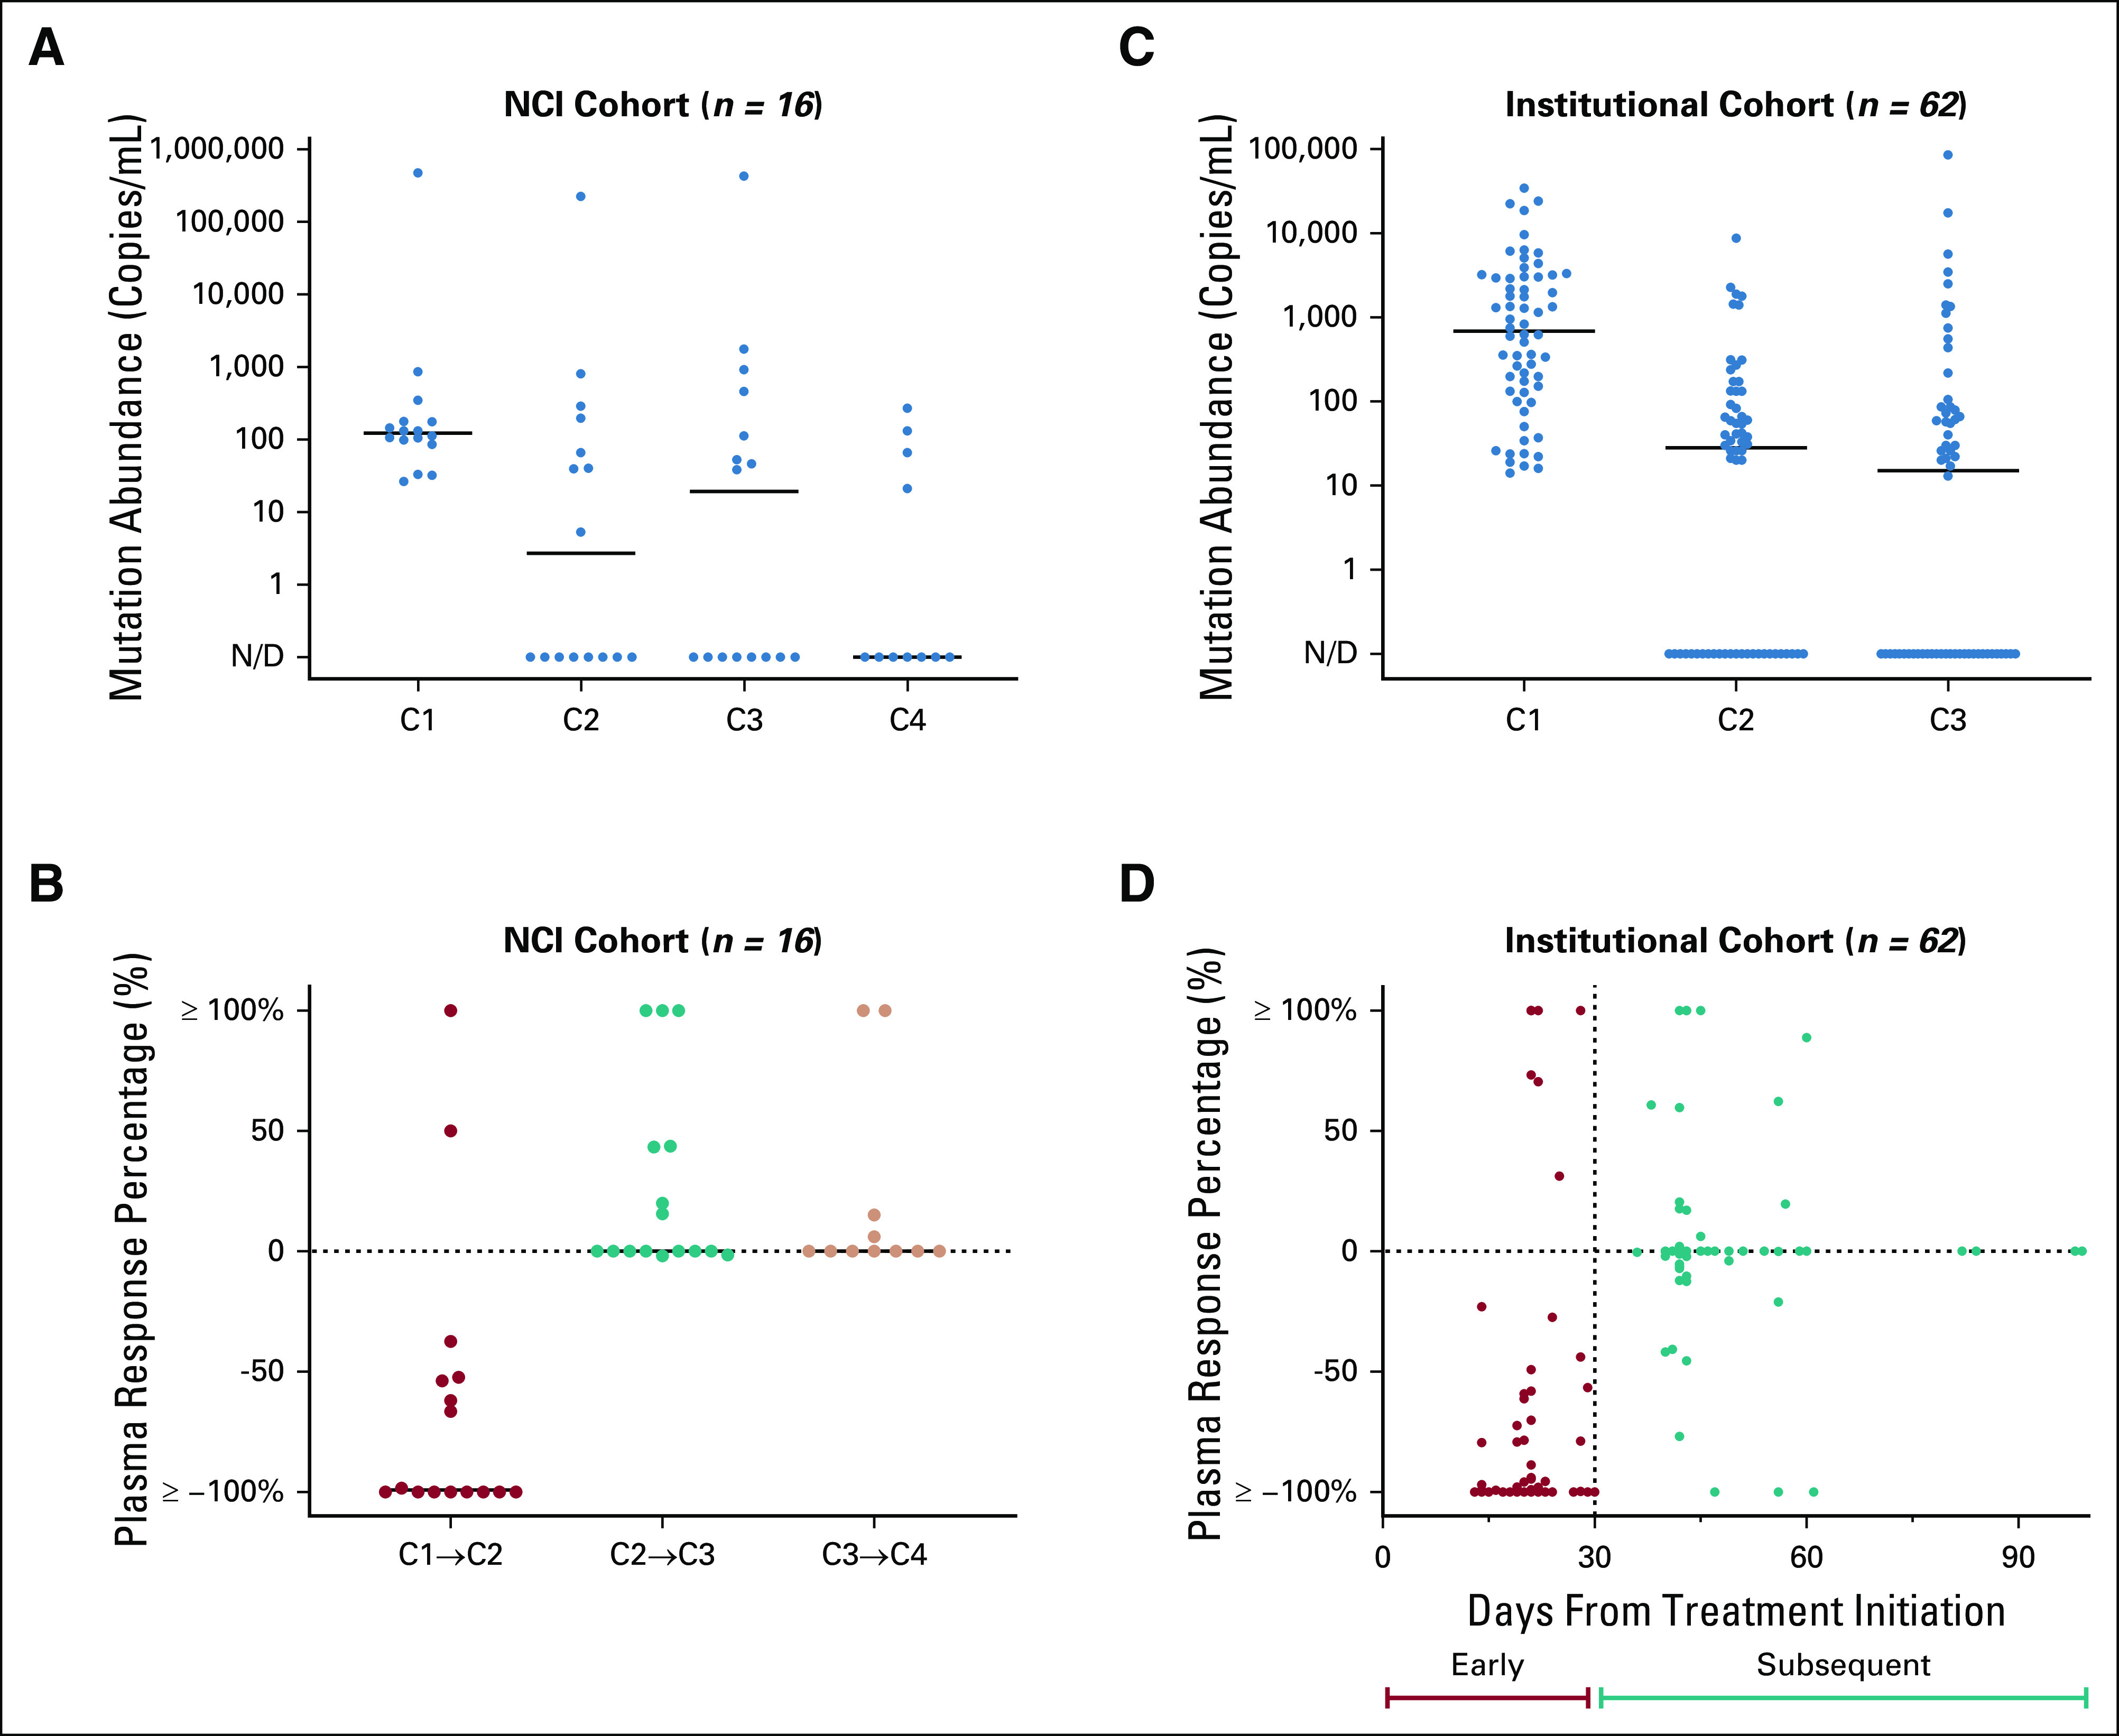
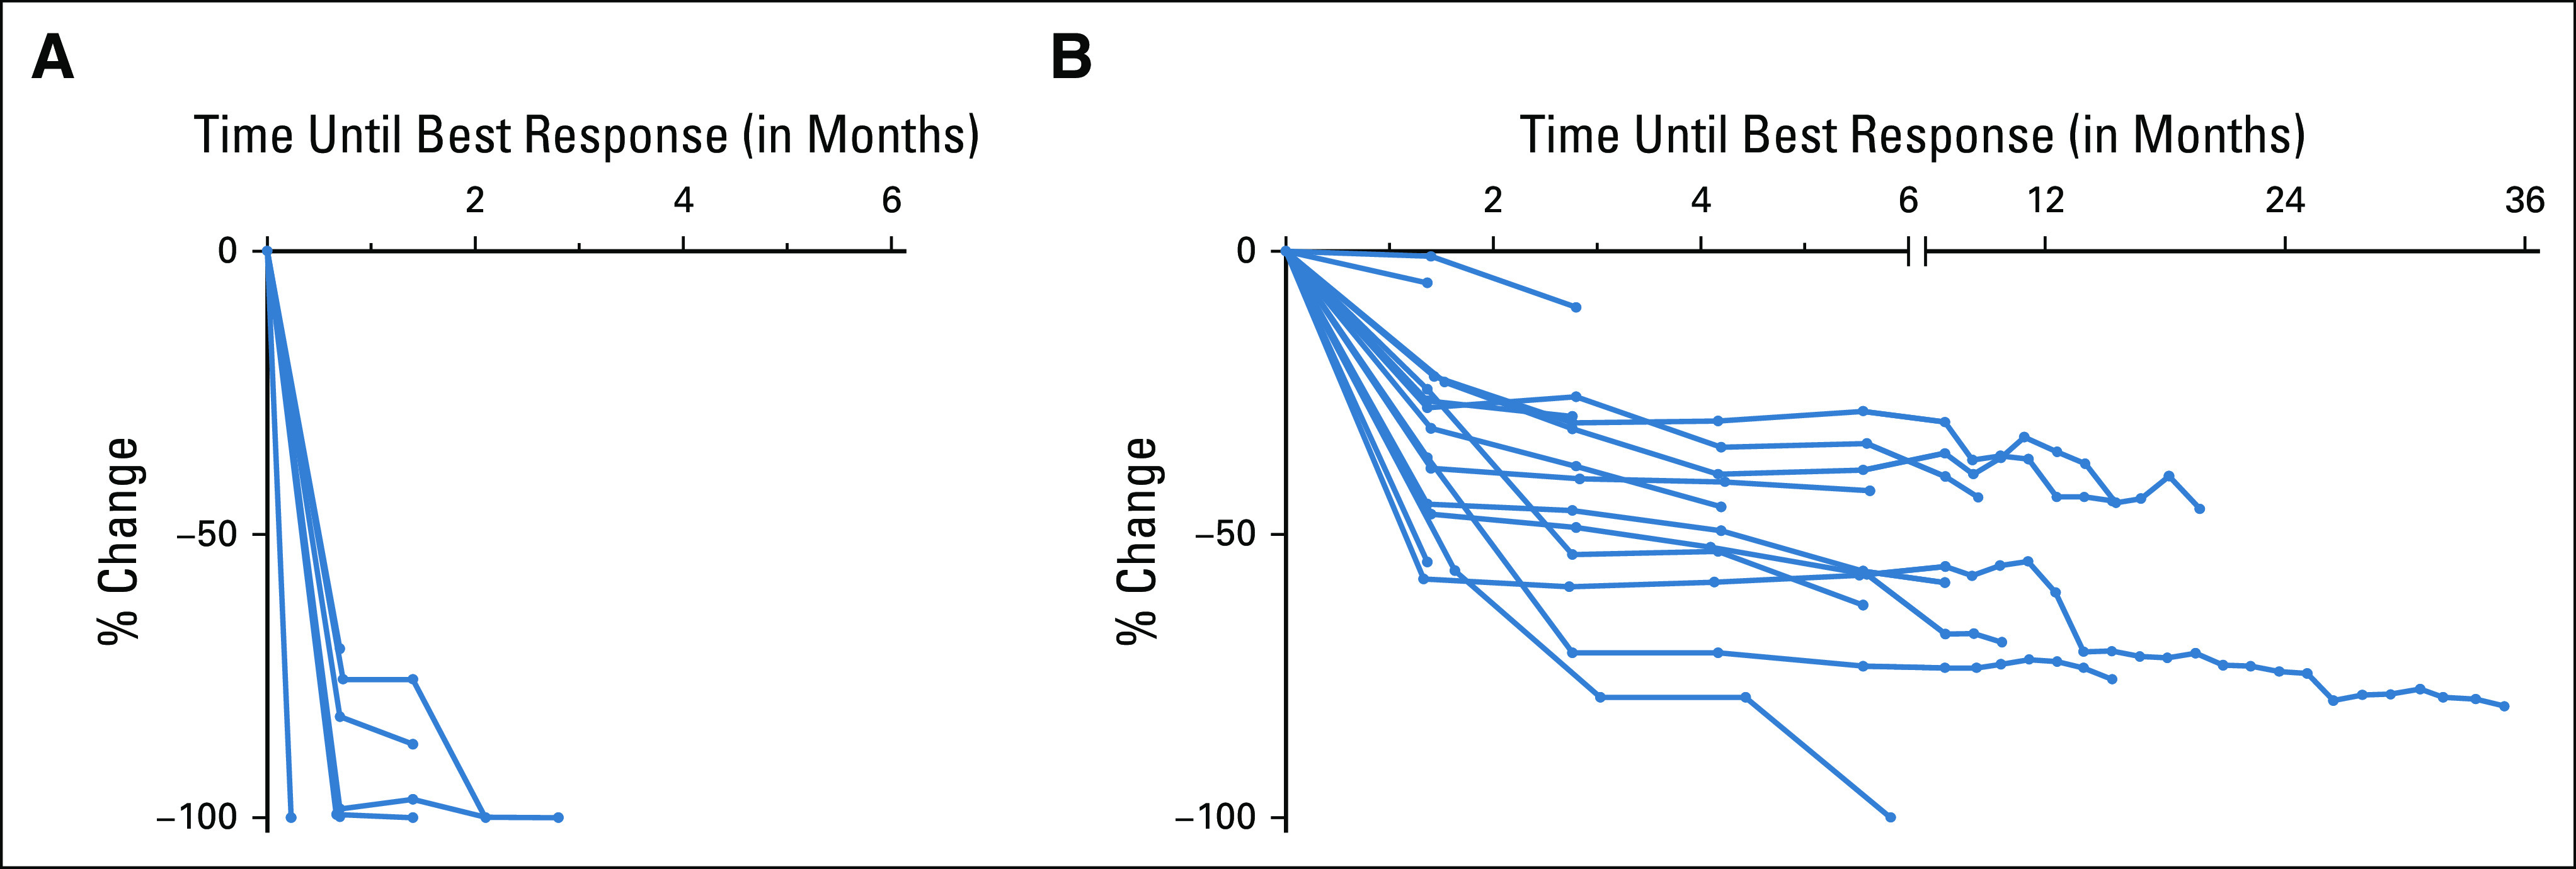
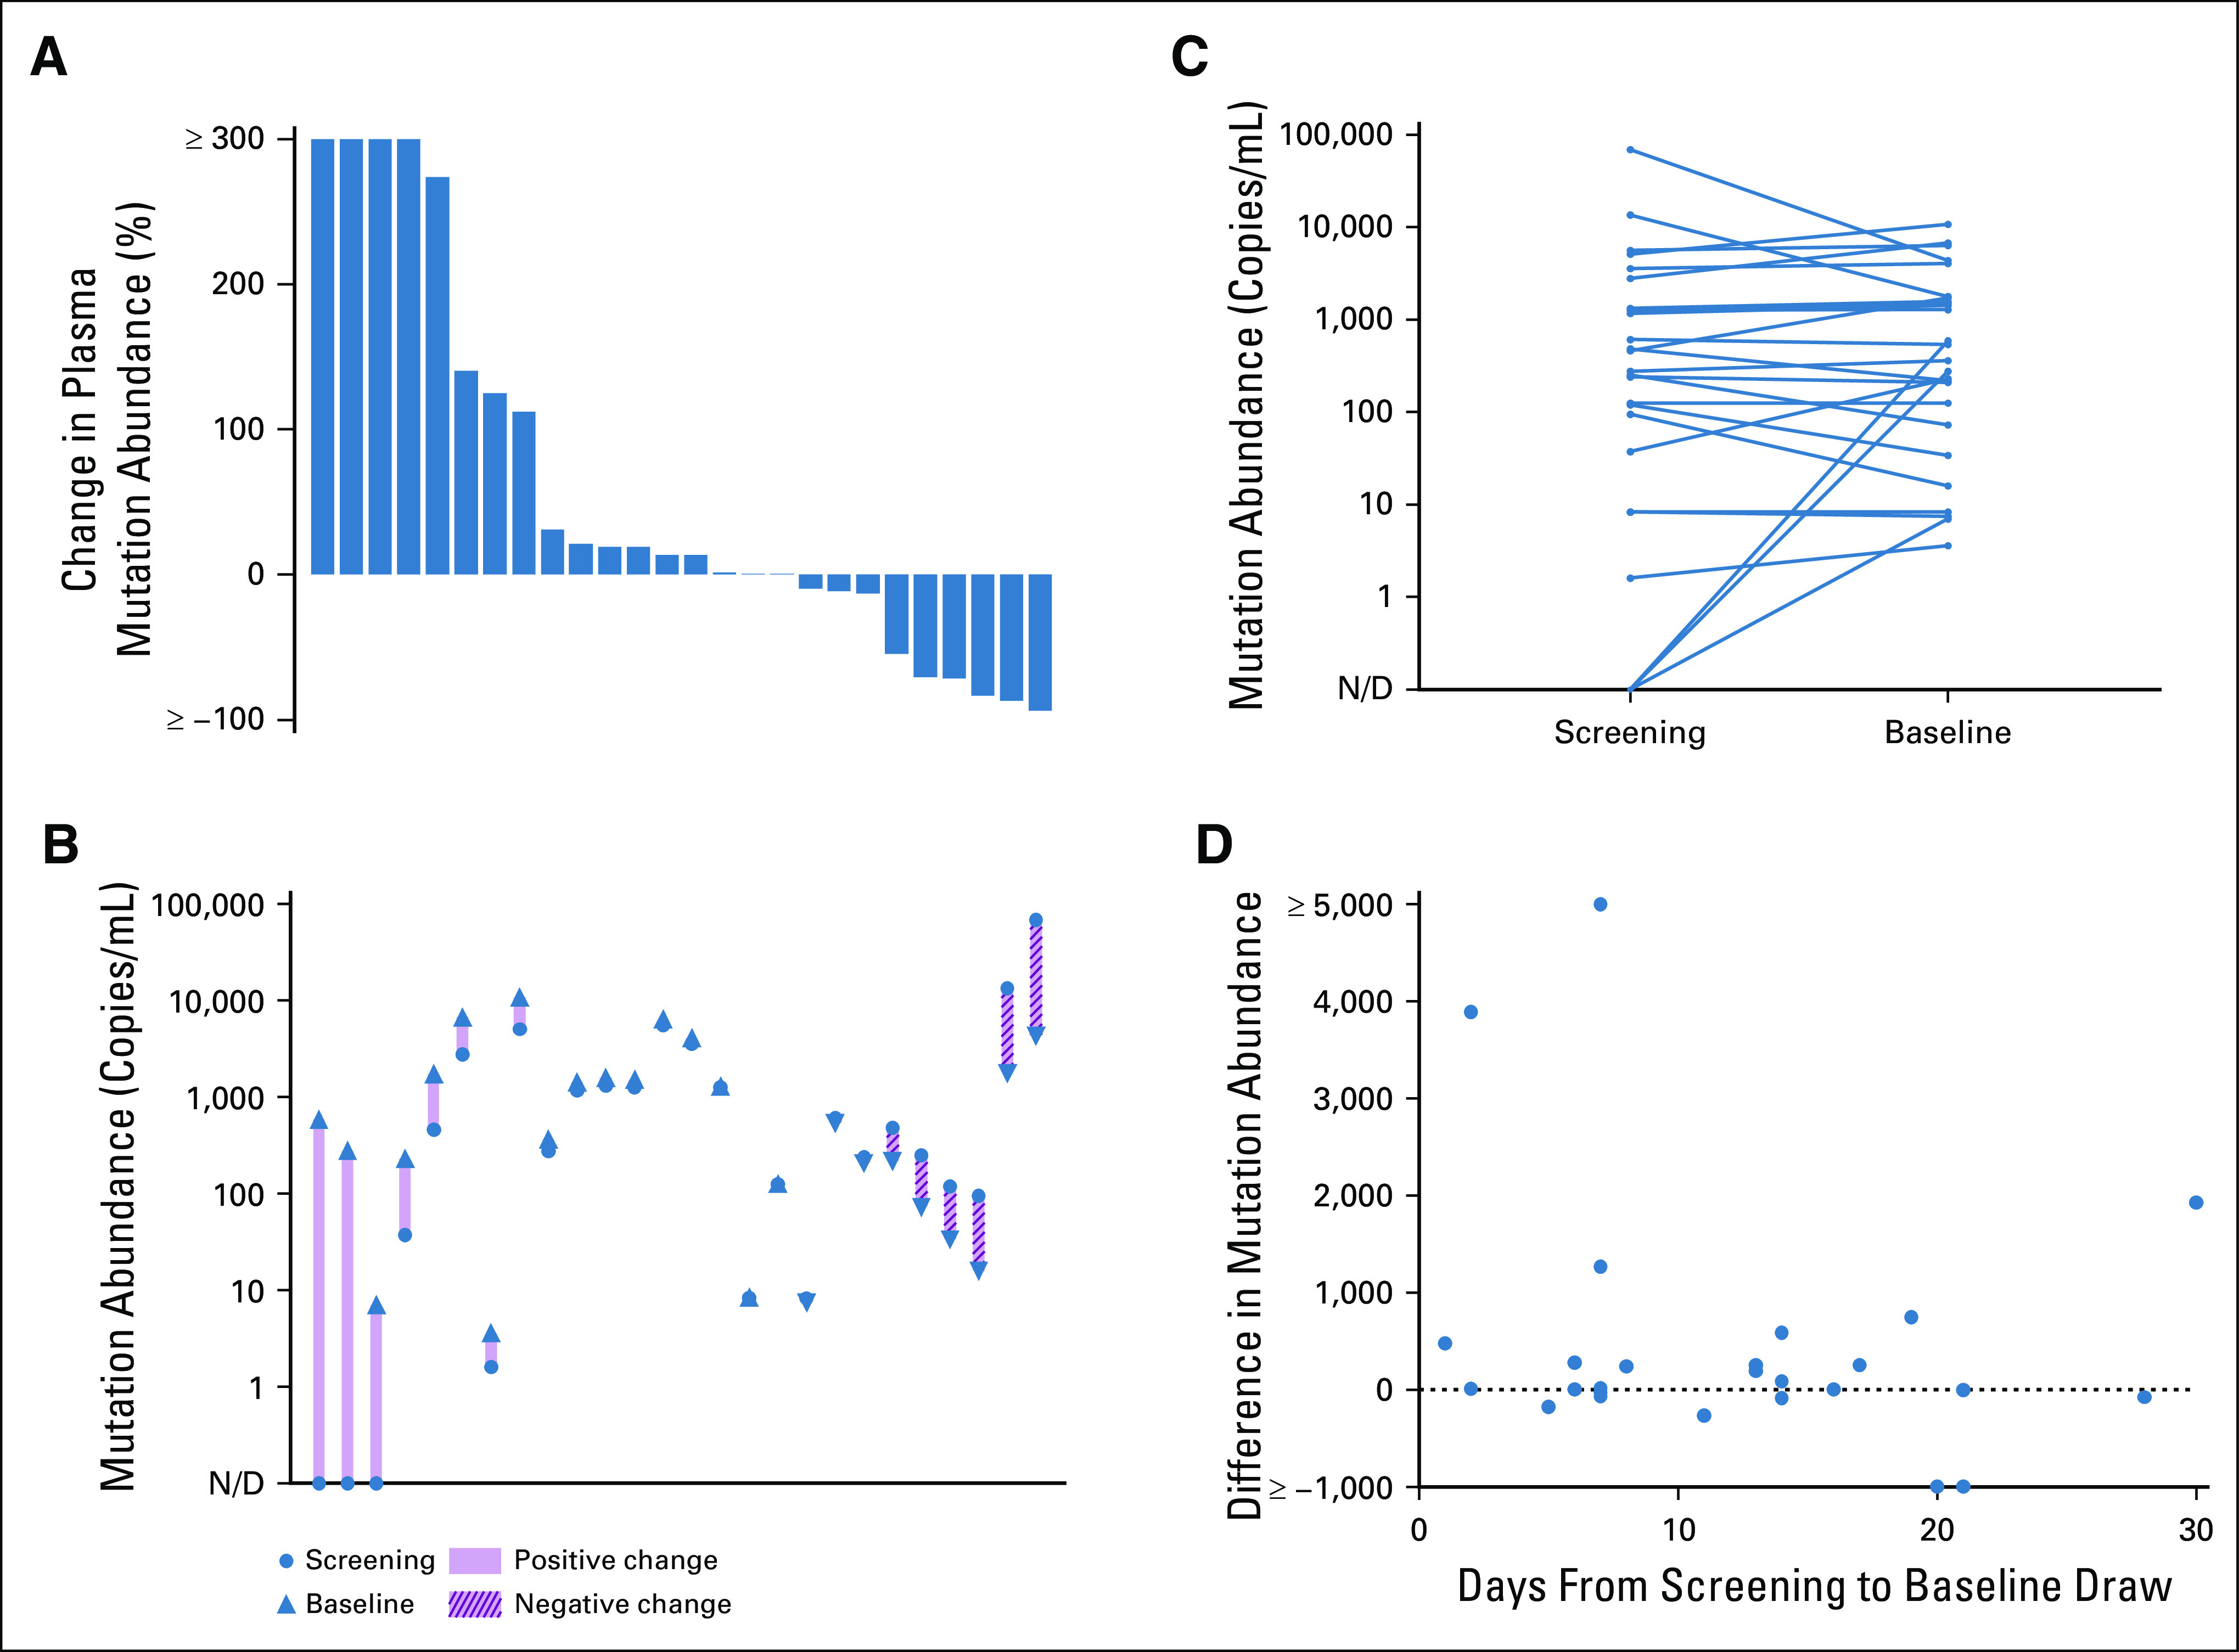
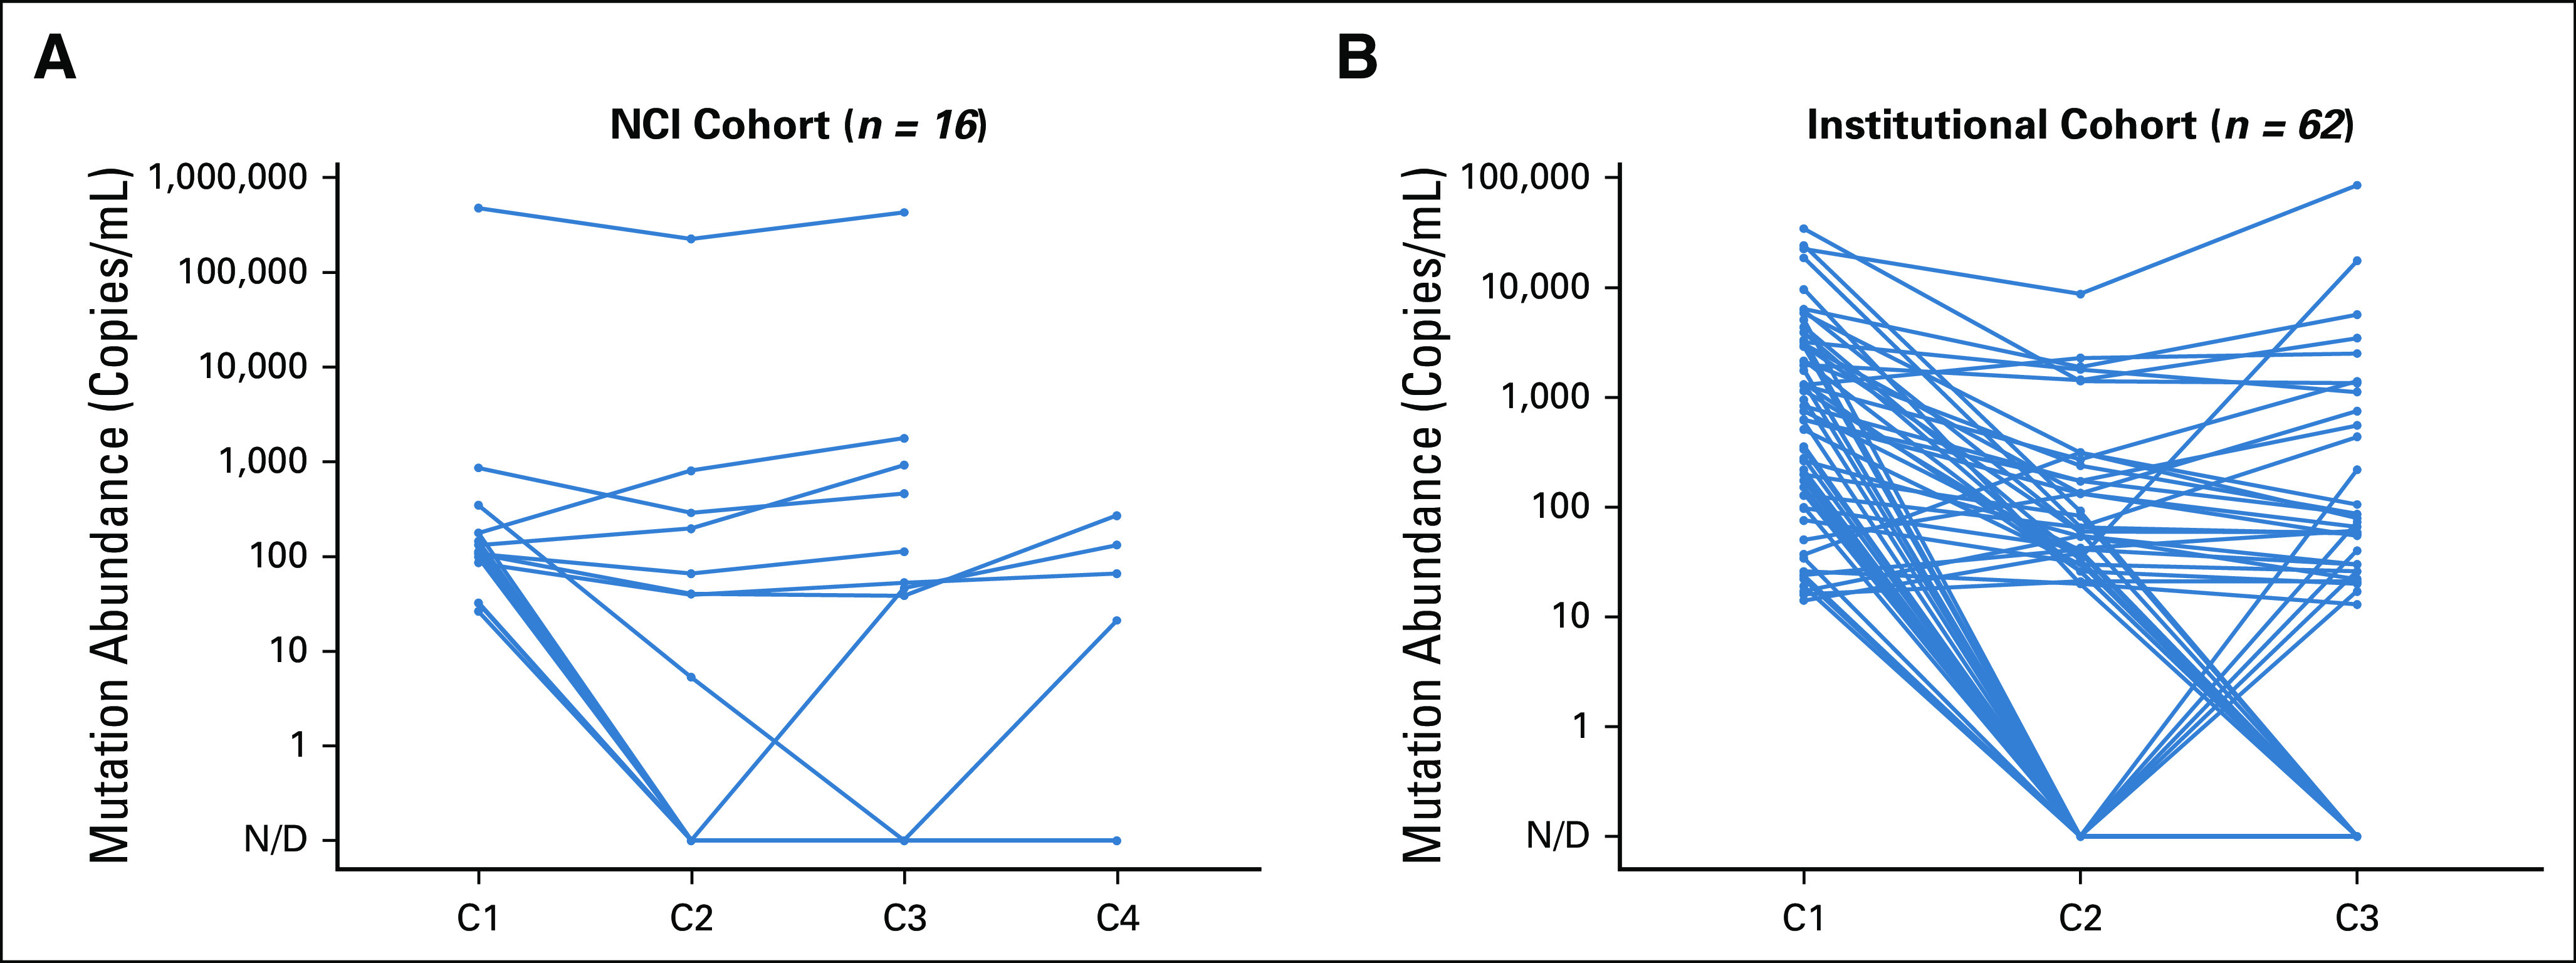
Results: In the NCI cohort, 14/16 (87.5%) patients exhibited ≥ 90% decrease in mutation abundance by the first on-treatment timepoint (20-28 days from treatment start) with minimal subsequent change. Similarly, 47/56 (83.9%) patients with any decrease in the institutional cohort demonstrated ≥ 90% decrease in mutation abundance by the first follow-up draw (7-30 days from treatment start). All 16 patients in the imaging cohort with radiographic partial response showed best plasma response within one cycle, preceding best radiographic response by a median of 24 weeks (range: 3-147 weeks). Variability in ctDNA levels before treatment start was observed.

Conclusion: Plasma ctDNA response is an early phenomenon, with the majority of change detectable within the first cycle of therapy. These kinetics may offer an opportunity for early insight into treatment effect before standard imaging timepoints.


Figures

FIG 1.
FIG 1.
CONSORT diagram for plasma ctDNA analysis. A total of 38 patients from the NCI cohort, 79 patients from the institutional clinical cohort, and 43 patients from the imaging cohort were eligible for plasma ctDNA analysis. Of these, 78 patients were eligible for plasma response analysis, 16 patients were eligible for plasma response versus best radiographic response, and 26 patients were eligible for pre-treatment ctDNA variability analysis. ctDNA, circulating tumor DNA; ddPCR, droplet digital polymerase chain reaction.
FIG 2.
FIG 2.
Relative change of driver mutation shed detected in plasma ctDNA. Dot plots comparing change in mutation abundance (copies/mL) of key driver mutations EGFR del19 or L858R, KRAS G12X, or BRAF V600E across consecutive intervals following treatment initiation for the NCI (A) and institutional (C) cohorts. The majority of responses are seen during the initial interval between cycle 1 and 2 for the NCI cohort (B) and between the baseline draw to the first follow-up draw for the institutional clinical cohort (D). ctDNA, circulating tumor DNA, N/D, not defined.
FIG 3.
FIG 3.
Best plasma response versus best radiographic response. (A) Percent change in copies/mL of the EGFR driver mutation in plasma until best response is achieved. Best plasma response was defined as the first undetectable timepoint (N = 12) or the nadir timepoint with a subsequent increase at the next draw (N = 4). (B) Percent change in imaging until best response is achieved. Note that additional data following best response in plasma and on imaging were captured but not shown here.
FIG 4.
FIG 4.
Pre-treatment variability of baseline driver mutation shed detected in plasma ctDNA. (A) Waterfall plot depicting percent change in plasma mutation abundance of key driver mutations between subsequent pre-treatment draws within a 30-day window among 26 patients enrolled to institutional clinical and imaging cohorts and (B and C) corresponding mutation abundance levels. (D) Baseline variability across duration of time between paired pre-treatment draws. ctDNA, circulating tumor DNA; N/D, not defined.
FIG A1.
FIG A1.
Baseline driver mutation abundance detectable in plasma ctDNA. (A) Dotplot of baseline pre-treatment shed of key driver mutations EGFR del19 or L858R, KRAS G12X, or BRAF V600E across all cohorts evaluated in this study. (B) Corresponding frequency table of driver genotype as determined through ddPCR analysis of plasma ctDNA. ctDNA, circulating tumor DNA; ddPCR, droplet digital polymerase chain reaction, N/D, not defined.
FIG A2.
FIG A2.
Response kinetics of driver mutation ctDNA abundance. Patient-level plasma levels (copies/mL) of EGFR del19 or L858R, KRAS G12X, or BRAF V600E following treatment initiation for the NCI (A) and institutional (B) cohorts. ctDNA, circulating tumor DNA, N/D, not defined.

References

    1. Sacher AG, Paweletz C, Dahlberg SE, et al. : Prospective validation of rapid plasma genotyping for the detection of EGFR and KRAS mutations in advanced lung cancer. JAMA Oncol 2:1014-1022, 2016 - PMC - PubMed
    1. Leighl NB, Page RD, Raymond VM, et al. : Clinical utility of comprehensive cell-free DNA analysis to identify genomic biomarkers in patients with newly diagnosed metastatic non–small cell lung cancer. Clin Cancer Res 25:4691-4700, 2019 - PubMed
    1. Oxnard GR, Hu Y, Mileham KF, et al. : Assessment of resistance mechanisms and clinical implications in patients with EGFR T790M–positive lung cancer and acquired resistance to osimertinib. JAMA Oncol 4:1527-1534, 2018 - PMC - PubMed
    1. Aggarwal C, Thompson JC, Black TA, et al. : Clinical implications of plasma-based genotyping with the delivery of personalized therapy in metastatic non–small cell lung cancer. JAMA Oncol 5:173-180, 2019 - PMC - PubMed
    1. Abbosh C, Birkbak NJ, Swanton C: Early stage NSCLC—challenges to implementing ctDNA-based screening and MRD detection. Nat Rev Clin Oncol 15:577-586, 2018 - PubMed

Publication types

MeSH terms