. 2021 Sep;107(5):1283-1298.
doi: 10.1111/tpj.15417. Epub 2021 Aug 12.

Cadaverine regulates biotin synthesis to modulate primary root growth in Arabidopsis

Affiliations

Cadaverine regulates biotin synthesis to modulate primary root growth in Arabidopsis

Nicole M Gibbs et al. Plant J. 2021 Sep.

Abstract

Cadaverine, a polyamine, has been linked to modification of root growth architecture and response to environmental stresses in plants. However, the molecular mechanisms that govern the regulation of root growth by cadaverine are largely unexplored. Here we conducted a forward genetic screen and isolated a mutation, cadaverine hypersensitive 3 (cdh3), which resulted in increased root-growth sensitivity to cadaverine, but not other polyamines. This mutation affects the BIO3-BIO1 biotin biosynthesis gene. Exogenous supply of biotin and a pathway intermediate downstream of BIO1, 7,8-diaminopelargonic acid, suppressed this cadaverine sensitivity phenotype. An in vitro enzyme assay showed cadaverine inhibits the BIO3-BIO1 activity. Furthermore, cadaverine-treated seedlings displayed reduced biotinylation of Biotin Carboxyl Carrier Protein 1 of the acetyl-coenzyme A carboxylase complex involved in de novo fatty acid biosynthesis, resulting in decreased accumulation of triacylglycerides. Taken together, these results revealed an unexpected role of cadaverine in the regulation of biotin biosynthesis, which leads to modulation of primary root growth of plants.

Keywords: Arabidopsis thaliana; biotin; cadaverine; polyamines; root architecture.


Conflict of interest statement

The authors declare that they have no competing interests.

Figures
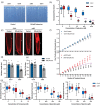
Figure 1
Figure 1
cdh3 is hypersensitive to cadaverine (Cad). (a) 10‐day‐old Columbia‐0 (Col‐0) and cdh3 seedlings germinated on vertical plates containing 200 μm cadaverine or control media. (b) Dose–response of seedlings germinated on cadaverine media. Root growth between day 6 and 10 is quantified. Root growth on control media (average ± standard error): Col 2.29 ± 0.045 cm; cdh3 1.94 ± 0.096 cm. Whiskers represent minimum to maximum values. (c) Seedlings were germinated on 200 μm cadaverine or control media and treated with propidium iodide to stain the cell walls. Stained roots were then analyzed using confocal microscopy. Five seedlings were analyzed per treatment group. White stars indicate the quiescent center. White arrowheads indicate the end of the root meristem. (d) Length of the meristem was quantified by identifying cells in the cortex whose length is greater than the width, and measuring the distance from the distal wall this cell to the distal wall of the quiescent center. Bars represent standard error, with dots showing data points. (e) Numbers of cells in the meristems were counted from the quiescent center to the end of the meristem along the cortex. Bars represent standard error, with dots showing data points. (f) Root tip growth following transfer of 5‐day‐old seedlings from control to split agar plates containing either control media, or media supplemented with 200 μm cadaverine. Root tip growth was recorded using a high‐resolution camera for 96 h and quantified using ImageJ. Data points represent the three seedlings per treatment. Bars indicate standard error. *P < 0.05, **P < 0.01, ***P < 0.001 analyzed by a mixed‐effects model with an F‐test for the interaction between time and treatment with Tukey’s adjustment for multiple comparisons. (g) cdh3 and wild‐type root growths were measured from day 6 to 10 on control or media supplemented with the indicated concentrations of putrescine, spermidine, and spermine. Root growths were standardized to growth on control media for each genotype. Whiskers show minimum to maximum values. ANOVA with Tukey's HSD correction was used to determine significance.
Figure 2
Figure 2
cdh3 contains a mutation in BIO3‐BIO1. (a) Next‐generation sequencing revealed a peak on chromosome 5 with a high proportion of single nucleotide polymorphisms (SNPs) compared with the reference sequence. Table shows mutations within the 4.6‐Mb peak region containing non‐synonymous SNPs in protein‐coding genes. (b) Gene structure for BIO3‐BIO1 is shown indicating the position of the SNP in cdh3. (c) 3D structure of the catalytic site of BIO1, deduced from the crystal structure resolved in Cobessi et al. (2012). This structure, imaged with pymol software, shows the substrate (7‐keto‐8‐aminoperlargonic acid [KAPA], in pink) and the cofactor (pyridoxal phosphate [PLP], in blue) bound to L666. Position of Ala662, which is converted into a threonine in cdh3, is indicated in yellow. (d) Quantification of standardized root growth on control and 200 μm cadaverine‐containing media from day 6 to 10 of wild‐type, cdh3, or cdh3 transformation–rescue lines (cdh3[BIO3‐BIO1pro:BIO3‐BIO1]) with the wild type BIO3‐BIO1 transgene under the control of its native promoter. BIO3‐BIO1 rescue lines are at the T3 generation. Root growth on control media (average ± standard error): Columbia‐0 (Col‐0) 2.54 cm ± 0.045; cdh3 2.05 cm ± 0.073 cm; cdh3[BIO3‐BIO1pro:BIO3‐BIO1 1 2.73 cm ± 0.075; cdh3[BIO3‐BIO1pro:BIO3‐BIO1 2 2.37 cm ± 0.104 cm; cdh3[BIO3‐BIO1pro:BIO3‐BIO1 3 2.36 cm ± 0.063 cm; cdh3[BIO3‐BIO1pro:BIO3‐BIO1 4 2.53 cm ± 0.073 cm. Whiskers represent minimum to maximum. (e) Quantitative reverse transcription–polymerase chain reaction analysis of BIO3‐BIO1 in 8‐day‐old wild‐type, cdh3, and cdh3[BIO3‐BIO1pro:BIO3‐BIO1] seedlings grown on control media. Bars represent standard error, with dots showing biological replicates. (d,e) Significant differences between groups detected using ANOVA with Tukey’s HSD correction (P < 0.05), are indicated with distinct letters.
Figure 3
Figure 3
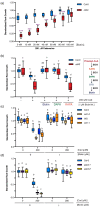
Biotin suppresses wild‐type primary root growth response to cadaverine (Cad) and rescues the hypersensitive root growth response of cdh3. (a) Standardized root growth of wild‐type and cdh3 mutant seedlings on 200 μm cadaverine‐containing media in the presence of 0–100 nm biotin. ***P < 0.001 using Student’s t‐test. Root growth on control media (average ± standard error): Columbia‐0 (Col‐0) 3.505 ± 0.0925 cm; cdh3 2.605 ± 0.326 cm. Whiskers show minimum to maximum values. (b) Wild‐type and cdh3 mutant root growth from day 6 to 10 on media with or without 200 μm cadaverine, in the presence of 1 μm biotin, 7‐keto‐8‐aminoperlargonic acid (KAPA) or 7,8‐diaminopelargonic acid (DAPA). A simplified biotin synthesis pathway is shown on the right of this graph. Root growth on control media (average ± standard error): Col‐0 3.452 ± 0.582 cm; cdh3 2.985 ± 0.115 cm. Minimum to maximum values are represented by whiskers. (c) Root growth of oct1 mutants on media without or with 200 μm cadaverine and 1 μm biotin. oct1‐1 is in the WS accession background, and oct1‐2 is in the Col‐0 background. Root growth on control media (average ± standard error): WS 1.663 ± 0.0322 cm; oct1‐1 1.569 ± 0.066 cm; Col‐0 1.523 ± 0.174 cm; oct1‐2 1.44 ± 0.033 cm. Whiskers show minimum to maximum values. (d) Standardized root growth of wild‐type Col‐0 and pao4‐1 and pao4‐2 mutant seedlings on media with or without 200 μm cadaverine, in the presence or absence of 1 μm biotin. Root growth on control media (average ± standard error): Col 1.938 ± 0.457 cm; pao4‐1 2.230 ± 0.046 cm; pao4‐2 2.361 ± 0.043 cm. (b–d) Significance was determined using ANOVA with Tukey’s HSD correction. Different letters indicate statistically different groups (P < 0.05). Whiskers show minimum to maximum values.
Figure 4
Figure 4
Cadaverine (Cad) inhibits BIO3‐BIO1 enzymatic activity. (a) BIO3‐BIO1 enzyme was expressed in Escherichia coli and affinity‐purified. In vitro enzymatic assays contained 50 μm cadaverine and 20 μm KAPA. A negative control assay was carried out with 0 μm KAPA with or without 50 μm cadaverine, to control for background fluorescence (see Experimental procedures). Reactions were run for 8 min before heat‐treating to stop the reaction. *P < 0.05 based on Student’s t‐test. Bars represent standard error, with individual data points showing biological replicates. DTB, dethiobiotin. (b) BIO3‐BIO1 expression is unaltered by cadaverine treatment. BIO3‐BIO1 expression was quantified using quantitative reverse transcription–polymerase chain reaction on cDNA prepared from RNA extracted from 8‐day‐old seedlings germinated on 200 μm cadaverine or control media, or transferred to cadaverine for 24, 48, or 72 h. Expression is standardized to PP2A reference gene. No statistically significant differences were observed using ANOVA. Bars represent standard error with values of individual biological replicates shown as symbols according to genotype and treatment indicated in the key. (c) BIO3‐BIO1 protein expression was quantified using a western‐blot approach. 8‐day‐old seedlings were grown on cadaverine‐containing media for 72 h. Proteins were extracted from whole seedlings and run on a sodium dodecyl sulfate–polyacrylamide gel electrophoresis gel. Following electro‐transfer, the PVDF membrane was exposed to a BIO3‐BIO1‐specific antibody to determine protein level. An antibody directed against a proteasomal protein, RPT4A was also used as a loading control. Blot shown here is representative of three biological replicates that gave similar results. In each blot, band intensities were quantified and standardized to RPT4A for each lane. Results of these quantifications are plotted in the graph shown to the right of the blot, with the value of each biological replicate shown as a symbol indicated in the key. Bars indicate standard error. **P < 0.01 using Student’s t‐test against Columbia‐0 (Col‐0) on control condition.
Figure 5
Figure 5
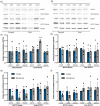
Levels of biotinylated proteins are altered following cadaverine (Cad) treatment. (a,b) Seed were germinated on control or cadaverine‐containing media. Following 8 days of treatment, roots (a) and shoots (b) were dissected and protein was extracted. 150 µg of protein were loaded on to sodium dodecyl sulfate–polyacrylamide gel and electrophoresed. After electro‐transfer on to a PVDF membrane, biotinylated proteins were detected with Licor IRDye CW800‐labeled streptavidin or anti‐biotin carboxyl carrier protein (anti‐BCCP) 1 and 3‐methylcrotonyl‐CoA carboxylase (MCCA) antibodies. In all cases, anti‐RPT4A antibodies were used to control for loading differences between samples. Blots shown in (a,b) are representative of three biological replicates showing similar results. Quantifications of band intensities from these blots are summarized in (c–f) for all three biological replicates. (c–f) Protein amount and biotinylation were quantified based on band intensity, standardized to the RPT4A signals, and then standardized again to Columbia‐0 (Col‐0). Expression results shown in the graphs represent three biological replicates, with a circle or square indicating the value of each control or cadaverine replicate, respectively. Bars indicate standard error. *Student's t‐test P < 0.05. **P < 0.01, compared with Col‐0 control treatment. (c) MCCA total protein and MCCA biotinylation in roots. (d) MCCA total protein and biotinylation in shoots. (e) BCCP1 total protein and BCCP1 biotinylation in roots. (f) BCCP1 total protein and BCCP1 biotinylation in shoots.
Figure 6
Figure 6
Triacylglycerol content following 72 h of cadaverine (Cad) treatment. Columbia‐0 seedlings were germinated on control media and transferred to either control or 200 μm cadaverine‐containing media after 5 days. 72 h post‐treatment, whole seedlings were harvested and used for lipid extraction and analysis using tandem mass spectrometry. The average of five biological replicates are shown containing approximately 200 seedlings per replicate, with dots representing each replicate. Bars indicate standard error. Student’s t‐test was done to determine significance between cadaverine treatment and control. *P < 0.05. **P < 0.01.

Comment in

References

    1. Alban, C. , Baldet, P. , Axiotis, S. & Douce, R. (1993) Purification and characterization of 3‐methylcrotonyl‐coenzyme A carboxylase from higher plant mitochondria. Plant Physiology, 102, 957–965. - PMC - PubMed
    1. Alban, C. , Job, D. & Douce, R. (2000) Biotin metabolism in plants. Annual Review of Plant Physiology and Plant Molecular Biology, 51, 17–47. - PubMed
    1. Aubert, S. , Alban, C. , Bligny, R. & Douce, R. (1996) Induction of beta‐methylcrotonyl‐coenzyme A carboxylase in higher plant cells during carbohydrate starvation: evidence for a role of MCCase in leucine catabolism. FEBS Letters, 383, 175–180. - PubMed
    1. Aziz, A. , Martin‐Tanguy, J. & Larher, F. (1998) Stress‐induced changes in polyamine and tyramine levels can regulate proline accumulation in tomato leaf discs treated with sodium chloride. Physiologia Plantarum, 104, 195–202. Available at: https://www.researchgate.net/profile/Aziz_Aziz3/publication/225274396_St....
    1. Batchelor, R. , Sarkez, A. , Cox, W.G. & Johnson, I. (2007) Fluorometric assay for quantitation of biotin covalently attached to proteins and nucleic acids. BioTechniques, 43, 503–507. https://doi.org/10.2144/000112564. - DOI - PubMed

Publication types

MeSH terms