. 2021 Sep 16;89(10):e0002421.
doi: 10.1128/IAI.00024-21. Epub 2021 Jul 12.

PET Imaging of Translocator Protein as a Marker of Malaria-Associated Lung Inflammation

Affiliations

PET Imaging of Translocator Protein as a Marker of Malaria-Associated Lung Inflammation

Julian L Goggi et al. Infect Immun. .

Abstract

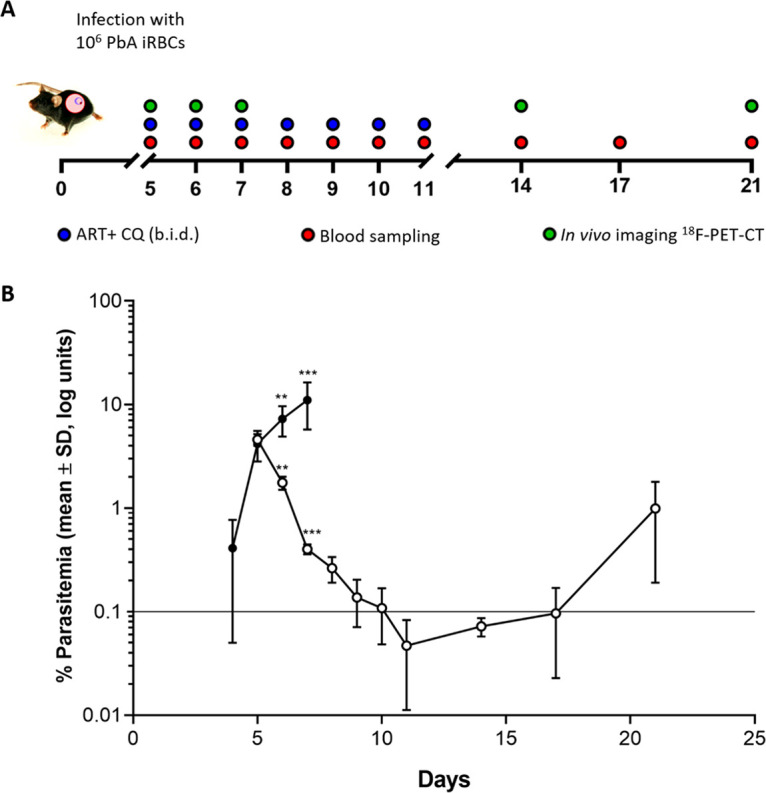
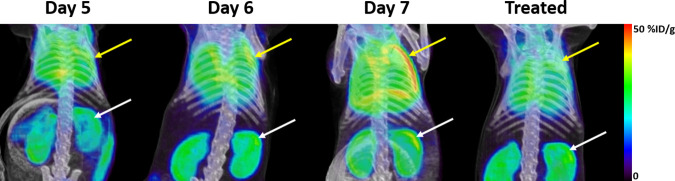
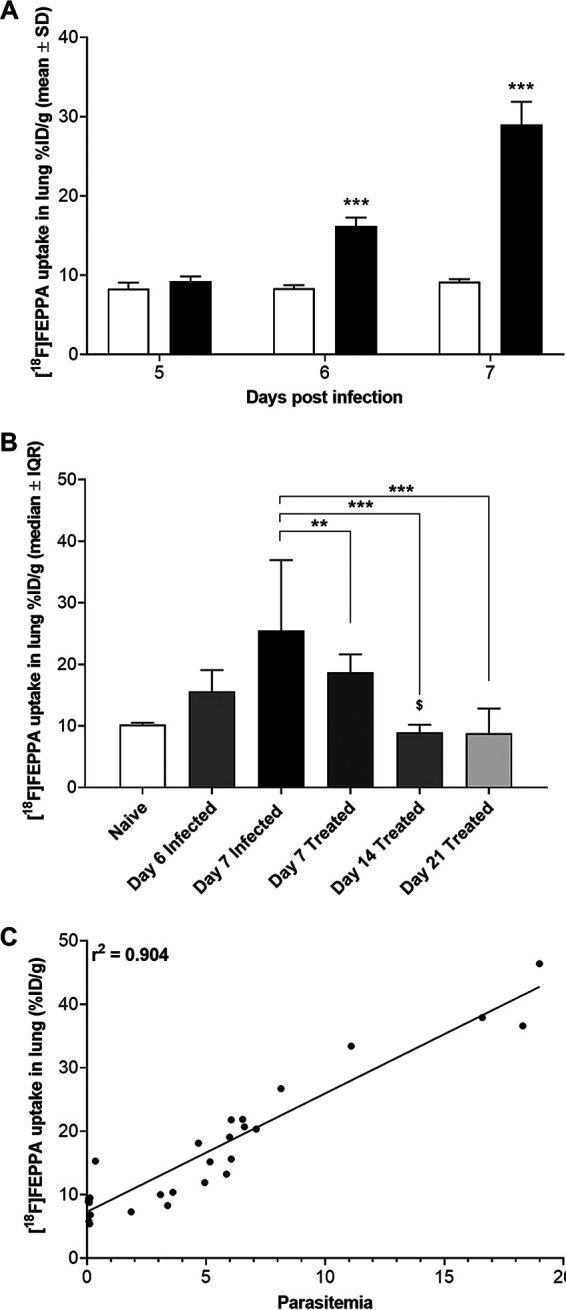
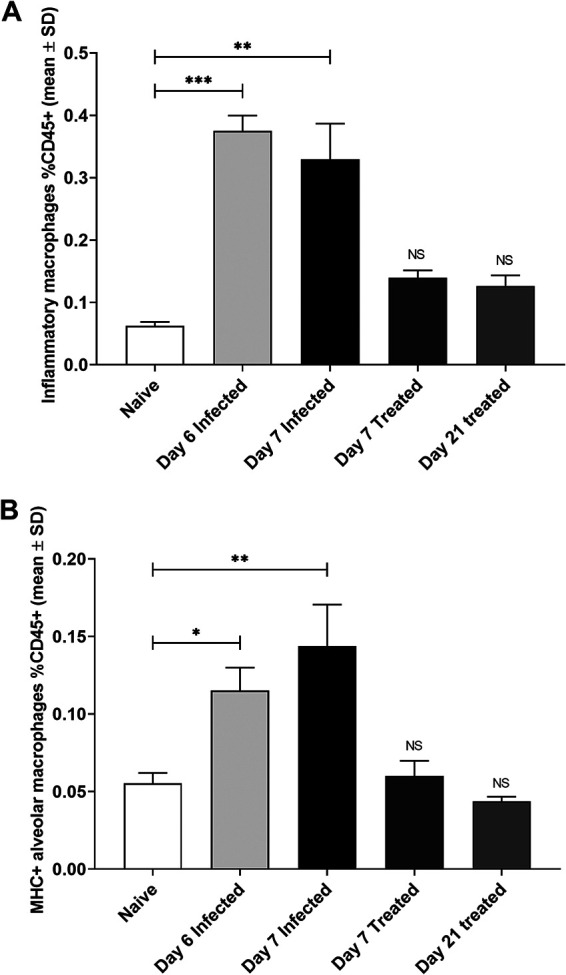
Malaria-associated acute respiratory distress syndrome (MA-ARDS) is a severe complication of malaria that occurs despite effective antimalarial treatment. Currently, noninvasive imaging procedures such as chest X-rays are used to assess edema in established MA-ARDS, but earlier detection methods are needed to reduce morbidity and mortality. The early stages of MA-ARDS are characterized by the infiltration of leukocytes, in particular monocytes/macrophages; thus, monitoring of immune infiltrates may provide a useful indicator of early pathology. In this study, Plasmodium berghei ANKA-infected C57BL/6 mice, a rodent model of MA-ARDS, were longitudinally imaged using the 18-kDa translocator protein (TSPO) imaging agent [18F]FEPPA as a marker of macrophage accumulation during the development of pathology and in response to combined artesunate and chloroquine diphosphate (ART+CQ) therapy. [18F]FEPPA uptake was compared to blood parasitemia levels and to levels of pulmonary immune cell infiltrates by using flow cytometry. Infected animals showed rapid increases in lung retention of [18F]FEPPA, correlating well with increases in blood parasitemia and pulmonary accumulation of interstitial inflammatory macrophages and major histocompatibility complex class II (MHC-II)-positive alveolar macrophages. Treatment with ART+CQ abrogated this increase in parasitemia and significantly reduced both lung uptake of [18F]FEPPA and levels of macrophage infiltrates. We conclude that retention of [18F]FEPPA in the lungs is well correlated with changes in blood parasitemia and levels of lung-associated macrophages during disease progression and in response to ART+CQ therapy. With further development, TSPO biomarkers may have the potential to accurately assess the early onset of MA-ARDS.

Keywords: PET; PbA; lung; macrophages; malaria.


Figures

FIG 1
FIG 1
(A) Timeline showing drug-dosing regimen. C57BL/6 mice were infected with 106 P. berghei ANKA organisms on day 0. Animals were treated with combined artesunate (30 mg/kg) and chloroquine diphosphate (120 mg/kg) therapy or saline vehicle on days 5 to 11 inclusive (i.p., twice a day [b.i.d.]). Blood sampling was performed daily from days 5 to 11 and subsequently on days 14, 17, and 21 for parasite quantification. In vivo imaging was performed at 5, 6, and 7 dpi for the untreated group (n = 6) and at 7, 14, and 21 dpi for the treated group (n = 6). (B) Parasitemia levels in P. berghei ANKA-infected mice that were left untreated (n = 10) (filled circles) or treated with ART+CQ (n = 10) (open circles). Asterisks indicate significant differences (**, P < 0.01; ***, P < 0.001; ****, P < 0.001) between the log-transformed parasitemia levels in the two groups as determined by an unpaired Student t test. Data are shown as the mean log percentages of parasitemia ± SD.
FIG 2
FIG 2
Representative standardized PET-CT maximum-intensity projection images for the assessment of lung uptake of [18F]FEPPA in mice on days 5, 6, and 7 after P. berghei ANKA infection and after 2 days of combined ART+CQ treatment. Yellow arrows indicate lung uptake, and white arrows indicate kidney clearance.
FIG 3
FIG 3
In vivo assessment of lung uptake of [18F]FEPPA from PET-CT defined volumes of interest (VOI) from groups of P. berghei ANKA-infected C57BL/6 mice (n = 6). (A) Lung uptake of [18F]FEPPA increased at 6 dpi (filled bar), reaching the maximum at 7 dpi. Asterisks indicate significant differences (***, P < 0.001) from background results for naive mice (open bar) by an unpaired Student t test. Data are shown as mean percentages of the ID per gram ± SD. (B) Treatment with combined ART+CQ led to significant decreases in [18F]FEPPA uptake in the lung 2 days after the initiation of treatment (day 7) (dark shaded bar) compared to uptake in untreated P. berghei ANKA-infected animals (filled bar). [18F]FEPPA uptake levels similar to background levels in naive mice (open bar) were observed 3 days (day 14) (medium shaded bar) and 10 days (day 21) (light shaded bar) after the cessation of treatment. Symbols indicate significant differences by one-way ANOVA (Kruskal-Wallis test with a Bonferroni posttest) in multiple comparisons against data for untreated (*, P < 0.05; **, P < 0.01; ***, P < 0.001) and treated ($, P < 0.05) P. berghei ANKA-infected animals on day 7. Data are shown as median percentages of ID per gram ± interquartile range (IQR). (C) Correlation of lung uptake of [18F]FEPPA with parasitemia over the time course studied (Pearson’s r2 = 0.904).
FIG 4
FIG 4
Assessment of myeloid cells in the lungs of infected mice by flow cytometry. (A) Levels of inflammatory macrophages increased significantly after P. berghei ANKA infection at 6 dpi (light shaded bar) and 7 dpi (filled bar) over background levels in naive animals (open bar). Treatment with combined ART+CQ led to significant decreases in levels of inflammatory macrophages 2 days after the initiation of treatment (day 7) (dark shaded bar) and 10 days after the cessation of treatment (day 21) (medium shaded bar) (n = 5). Asterisks indicate significant differences (**, P < 0.01; ***, P < 0.001) by one-way ANOVA. Data are shown as mean percentages of CD45+ cells ± SD. NS, no significant differences from results for naive animals. (B) Levels of MHC-positive alveolar macrophages increased significantly at 6 dpi (light shaded bar) and 7 dpi (filled bar) over background levels in naive animals (open bar).Treatment with combined ART+CQ led to significant decreases in MHC-positive alveolar macrophages 2 days after the initiation of treatment (day 7) (dark shaded bar) and 10 days after the cessation of treatment (day 21) (medium shaded bar) (n = 6). Asterisks indicate significant differences (*, P < 0.05; **, P < 0.01) by one-way ANOVA. Data are shown as mean percentages of CD45+ cells ± SD. NS, no significant differences from results for naive animals.

References

    1. WHO Global Malaria Programme. 30November2020. World malaria report 2020. World Health Organization, Geneva, Switzerland.
    1. Schofield L, Grau GE. 2005. Immunological processes in malaria pathogenesis. Nat Rev Immunol 5:722–735. 10.1038/nri1686. - DOI - PubMed
    1. Renia L, Howland SW, Claser C, Gruner AC, Suwanarusk R, Teo TH, Russell B, Ng LFP. 2012. Cerebral malaria: mysteries at the blood-brain barrier. Virulence 3:193–201. 10.4161/viru.19013. - DOI - PMC - PubMed
    1. Taylor WRJ, Hanson J, Turner GDH, White NJ, Dondorp AM. 2012. Respiratory manifestations of malaria. Chest 142:492–505. 10.1378/chest.11-2655. - DOI - PubMed
    1. Asiedu DK, Sherman CB. 2000. Adult respiratory distress syndrome complicating Plasmodium falciparum malaria. Heart Lung 29:294–297. 10.1067/mhl.2000.106724. - DOI - PubMed

Publication types