. 2021 Dec;12(1):1672-1688.
doi: 10.1080/21505594.2021.1937883.

Development and multimodal characterization of an elastase-induced emphysema mouse disease model for the COPD frequent bacterial exacerbator phenotype

Affiliations

Development and multimodal characterization of an elastase-induced emphysema mouse disease model for the COPD frequent bacterial exacerbator phenotype

Irene Rodríguez-Arce et al. Virulence. 2021 Dec.

Abstract

Chronic obstructive pulmonary disease (COPD) patients undergo infectious exacerbations whose frequency identifies a clinically meaningful phenotype. Mouse models have been mostly used to separately study both COPD and the infectious processes, but a reliable model of the COPD frequent exacerbator phenotype is still lacking. Accordingly, we first established a model of single bacterial exacerbation by nontypeable Haemophilus influenzae (NTHi) infection on mice with emphysema-like lesions. We characterized this single exacerbation model combining both noninvasive in vivo imaging and ex vivo techniques, obtaining longitudinal information about bacterial load and the extent of the developing lesions and host responses. Bacterial load disappeared 48 hours post-infection (hpi). However, lung recovery, measured using tests of pulmonary function and the disappearance of lung inflammation as revealed by micro-computed X-ray tomography, was delayed until 3 weeks post-infection (wpi). Then, to emulate the frequent exacerbator phenotype, we performed two recurrent episodes of NTHi infection on the emphysematous murine lung. Consistent with the amplified infectious insult, bacterial load reduction was now observed 96 hpi, and lung function recovery and disappearance of lesions on anatomical lung images did not happen until 12 wpi. Finally, as a proof of principle of the use of the model, we showed that azithromycin successfully cleared the recurrent infection, confirming this macrolide utility to ameliorate infectious exacerbation. In conclusion, we present a mouse model of recurrent bacterial infection of the emphysematous lung, aimed to facilitate investigating the COPD frequent exacerbator phenotype by providing complementary, dynamic information of both infectious and inflammatory processes.

Keywords: Lung emphysema; bacterial exacerbation; inflammation; micro-CT; test of pulmonary function.


Figures
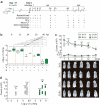
Figure 1.
Figure 1.
A mouse model of lung emphysematous infection: experimental design and characterization. (a) Experimental design: lung emphysema was induced by oropharyngeal instillation of PPE in CD1 mice (Day −17). Elastase instillation induces pulmonary damage compatible with emphysema-like lesions. Mice were instilled with PPE (E+/I-) or received physiological saline solution (V+/I-). Animals were infected with ~108 CFU/mouse of H. influenzae Xen21 (Day 0), V+/I+ and E+/I+ groups. Assay types and sampling time points are indicated. (b) Longitudinal analysis of lung bacterial loads. Mice were infected as indicated in (a), euthanized 6, 12, 24, 30 and 48 hpi, and bacterial loads quantified in homogenized lungs. No significant differences were observed between V+/I+ (white) and E+/I+ (green) groups at any of the indicated time points. V+/I+ groups: bacterial counts were lower 24, 30 and 48- than 6 hpi (p < 0.005); bacterial counts were lower 24, 30 and 48- than 12 hpi (p < 0.05); bacterial counts were lower 48- than 24 and 30 hpi (p < 0.0001). E+/I+ animals: bacterial counts were lower 30 and 48- than 6 hpi (p < 0.0001); bacterial counts were lower 30 and 48- than 12 hpi (p < 0.005); bacterial counts were lower 48- than 24 and 30 hpi (p < 0.0001). Results are reported as log10 CFU/lung and represented as box plot graphs (lines inside boxes represent median values). Statistical comparisons were performed using one-way ANOVA and Tukey’s multiple comparison test. *** p < 0.001; ** p < 0.01; * p < 0.05. (c) Bacterial bioluminescence was determined 1, 3, 6, 9, 12 and 24 hpi, representative animals are shown (bottom panel). Results are shown as mean ± SEM. Statistical comparisons were performed using one-way ANOVA and Tukey’s multiple comparison test. *** p < 0.001; * p < 0.05. (d) H. influenzae Xen21 light levels and bacterial numbers in vivo. Bacterial counts and animal luminescence determined at different time points post-inoculation (6, 12 and 24 h). Spearman’s correlation coefficient was determined
Figure 2.
Figure 2.
Pulmonary NTHi infection modifies lung physiology in the murine model. Evolution of pulmonary physiological parameters at the indicatedpost-infection time points by PFT (24 and 48 hpi; 1, 2 and 3 wpi). Mice groups: non-infected control animals with normal lung function (CON, black cross); V+/I- and E+/I-, white and green circles, respectively; V+/I+ and E+/I+, white and green squares, respectively. (a and d) Lung resistance (R, cmH2O.s/mL), (b and e) elastance (E, cmH2O/mL), (c and f) compliance (C, mL/cmH2O), measured by the single-frequency forced oscillation maneuver. Results are shown as mean ± SEM, statistical differences were analyzed using a two-way ANOVA followed by Bonferroni´s post-hoc test. *** p < 0.001; ** p < 0.01; * p < 0.05
Figure 3.
Figure 3.
Pulmonary NTHi infection induces lung inflammation in the murine model. (a and f) Representative micro-CT images in the longitudinal section (upper row) and cross-section (bottom row) acquired from the chest of the V+/I- and V+/I+ (a), and E+/I- and E+/I+ (f) mice, at the indicated time points. Evolution of the image parameters calculated from the micro-CT scans at the indicated time points (number of images, n ≥ 3). Mice groups: non-infected control animals with normal lung function (CON, black cross); V+/I- and E+/I-, white and green circles, respectively; V+/I+ and E+/I+, white and green squares, respectively. (b and g) Total lung volume (mm3). (c and h) Relative lung volume below −900 HU (RVB −900 HU). (d and i) Mean lung voxel intensity (MLVI). (e) Representative rendered views, and 2D axial micro-CT slices of a lung from V+/I- and V+/I+ models, 48 hpi and 1 wpi. Yellow areas indicate hyperintense regions corresponding with infection. (f) Representative 3D rendered views, and 2D axial micro-CT slices of a lung from E+/I- and E+/I+ models, 48 hpi and 1 wpi. Yellow areas indicate hyperintense regions corresponding with infection. Red areas indicate areas of low X-ray absorption corresponding with emphysema. In (e) and (j), lung reconstructions show the main airways in solid blue, the lungs in transparent blue, the low-density areas in red (RVB −900 HU), and the high-density areas in yellow (RV −30/-150 HU). Axial micro-CT slices show RVB −900 HU and RV −30/-150 HU parameters merged on the radiographic image. Results are shown as mean ± SEM, statistical differences were analyzed using a two-way ANOVA followed by Bonferroni´s post-hoc test. *** p < 0.001; ** p < 0.01; * p < 0.05
Figure 4.
Figure 4.
Emphysema mice recurrent pulmonary infection by NTHi, experimental design and analysis of lung bacterial loads. (a) Experimental design: lung emphysema was induced by oropharyngeal instillation of PPE (Day −24). Controls: animals were administered vehicle solution (V+/I-) but did not receive elastase (E+/I-). Animals were infected with ~108 CFU/mouse of H. influenzae Xen21 (Day −7, infection 1). Same animals were infected with ~108 CFU/mouse of H. influenzae Xen21 (Day 0, infection 2), V+/I2+ and E+/I2+ groups. Assay types and sampling time points are indicated. (b) Mice were infected as indicated in (a), euthanized 24, 48, 72 and 96 hpi, and bacterial loads quantified in lungs (log10 CFU/lung). Infection took longer to clear in emphysema mice, significant differences were observed between V+ (white) and E+ (green) mice 48 (p < 0.0001) and 72 (p < 0.01) hpi. V+/I2+ mice: bacterial counts were lower 48, 72 and 96- than 24 hpi (p < 0.001). E+/I2+ mice: bacterial counts were lower 96- than 24 and 48 hpi (p < 0.05 and p < 0.01, respectively). (c) Effect of AZM administration on bacterial loads in NTHi infected mice. AZM (100 mg/kg/dose) was administered oroesophageally as indicated in (a). Control animals were administered water. Bacterial counts were determined 24, 30 and 36 hpi. V+ infected animals: 24 hpi, Xen21 counts were significantly lower in V+/I2+/AZM than in V+/I2+ animals (p < 0.0001). Also, bacterial counts were lower 30 and 36 than 24 hpi (p < 0.01 and p < 0.05, respectively). E+ infected mice: bacterial counts were lower in E+/I2+/AZM than in E+/I2+ animals 24 (p < 0.0001), 30 (p < 0.05) and 36 (p < 0.0001) hpi. Also, bacterial counts were lower 30 than 24 hpi (p < 0.01). Results are reported as log10 CFU/lung and represented as box plot graphs (lines inside boxes represent median values). Statistical comparisons were performed using one-way ANOVA and Tukey’s multiple comparison test. *** p < 0.001; ** p < 0.01; * p < 0.05
Figure 5.
Figure 5.
Recurrent NTHi infection exacerbates lung damage and renders chronic lung lesions in mice. CD1 mice were infected with NTHi Xen21 on days −7 and 0, after instillation of physiological saline solution (V+/I2+) or PPE (E+/I2+), as indicated in Figure 4a. (a-b) Evolution of physiological parameters at the indicated time points, measured in V+/I2+ and E+/I2+ mice, in comparison with their respective non-infected groups (V+/I2- and E+/I2-). Mice groups: V+/I2- and E+/I2-, white and green circles, respectively; V+/I2+ and E+/I2+, white and green squares, respectively. (a, b) Lung resistance (R, cmH2O.s/mL), elastance (E, cmH2O/mL) and compliance (C, mL/cmH2O) measured by the single-frequency forced oscillation maneuver. (c, d) Representative micro-CT images (n = 2) in the longitudinal section (upper row) and cross-section (bottom row) acquired from the chest of the V+/I2+ and E+/I2+ mice at the indicated time points. V+/I- and E+/I- animals are shown as controls. Results are shown as mean ± SEM, statistical differences were analyzed using a two-way ANOVA followed by Bonferroni´s post-hoc test. *** p < 0.001; ** p < 0.01; * p < 0.05
Figure 6.
Figure 6.
A disease model based on murine emphysematous lung recurrent bacterial infection in the context of the COPD vicious circle hypothesis. Alterations in innate defenses induced by inhalational exposure due to cigarette or biomass smoke allow pathogenic bacteria initiating the endless vicious circle that contributes to disease progression. By modeling increased elastolytic activity by elastase administration and combined use of longitudinal approaches, we observed that newly acquired opportunistic pathogenic bacteria contribute to the decline of pulmonary function and to airway inflammation. Respiratory parameters return to the baseline after bacterial clearance, but such return is much slower than bacterial clearance as such, and this delay is further amplified in the damaged lungs (single infection summary, upper left representation: E+/I+, continuous lines; V+/I+, dashed lines; bacterial load, blue lines; PFT and X-ray data, black lines). Recurrent infection exacerbates such gaps, heavily increasing lung recovery times, i.e. from 3 to 12 weeks after re-infection of emphysema lungs (recurrent infection summary, upper right representation: E+/I2+, continuous lines; V+/I2+, dashed lines; bacterial load, blue lines; PFT and X-ray data, black lines). This E+/I2+ situation may emulate features of the COPD frequent exacerbator phenotype

Similar articles

Cited by

References

    1. Celli BR, Wedzicha JA.. Update on clinical aspects of chronic obstructive pulmonary disease. N Engl J Med. 2019;381(13):1257–1266. Available from: https://www.ncbi.nlm.nih.gov/pubmed/31553837 - PubMed
    1. Wedzicha JA, Seemungal TA. COPD exacerbations: defining their cause and prevention. Lancet. 2007;370(9589):786–796. Available from: https://www.ncbi.nlm.nih.gov/pubmed/17765528 - PMC - PubMed
    1. Hurst JR, Vestbo J, Anzueto A, et al. Susceptibility to exacerbation in chronic obstructive pulmonary disease. N Engl J Med. 2010;363(12):1128–1138. Available from. https://www.ncbi.nlm.nih.gov/pubmed/20843247 - PubMed
    1. Waeijen-Smit K, Houben-Wilke S, DiGiandomenico A, et al. Unmet needs in the management of exacerbations of chronic obstructive pulmonary disease. Intern Emerg Med. 2021;16(1):1–11. - PMC - PubMed
    1. Lopez-Campos JL, Miravitlles M, De La Rosa Carrillo D, et al. Current challenges in chronic bronchial infection in patients with chronic obstructive pulmonary disease. J Clin Med. 2020;9(6):1639. Available from: https://www.ncbi.nlm.nih.gov/pubmed/32481769 - PMC - PubMed

Publication types

Substances