. 2021 Aug 23;6(16):e148920.
doi: 10.1172/jci.insight.148920.

HIV infection drives interferon signaling within intestinal SARS-CoV-2 target cells

Affiliations

HIV infection drives interferon signaling within intestinal SARS-CoV-2 target cells

Rabiah Fardoos et al. JCI Insight. .

Abstract

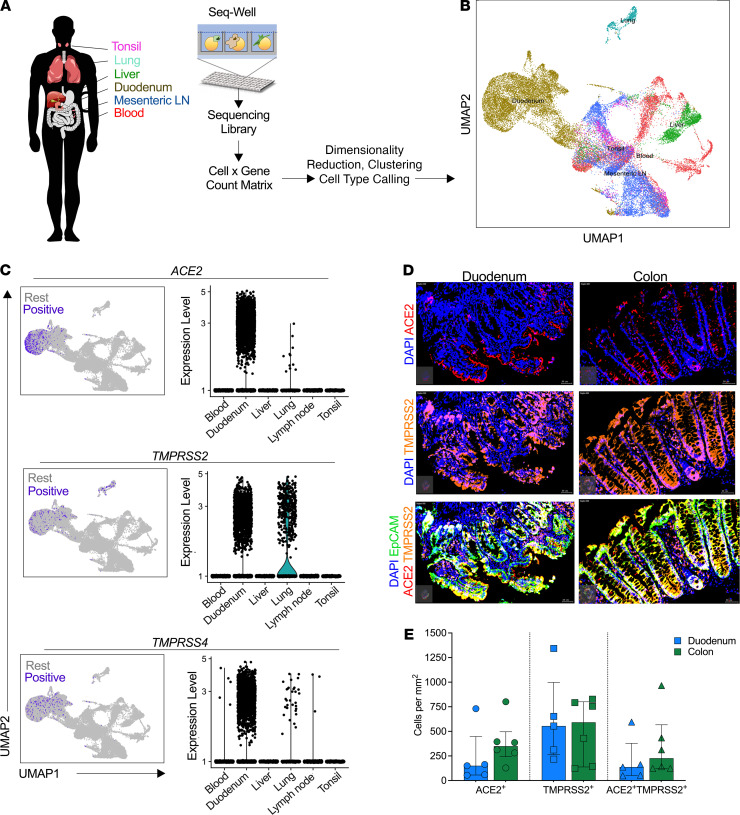
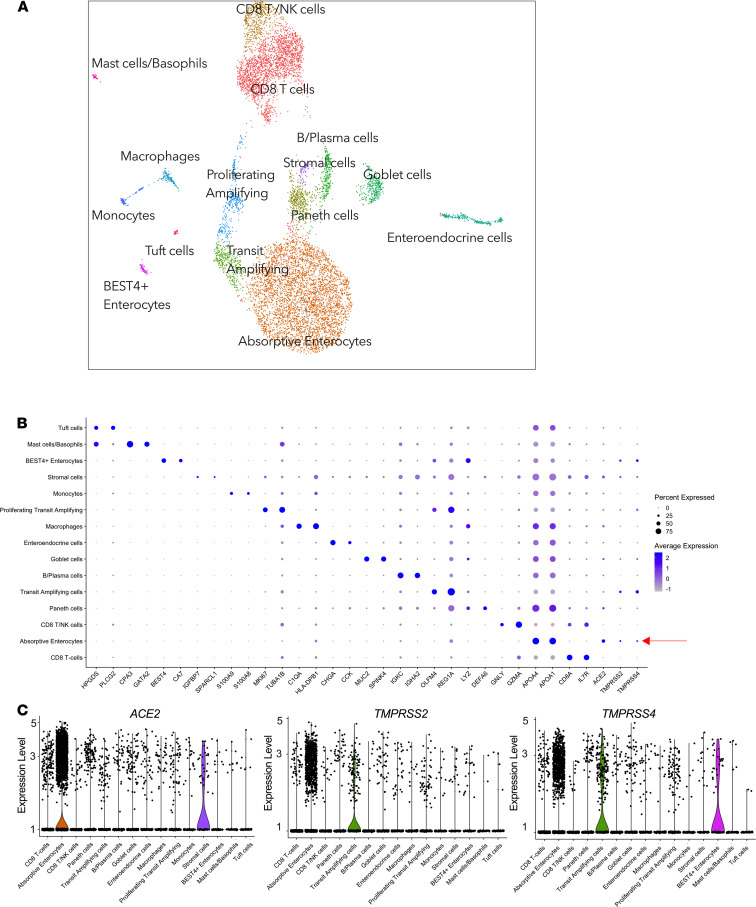
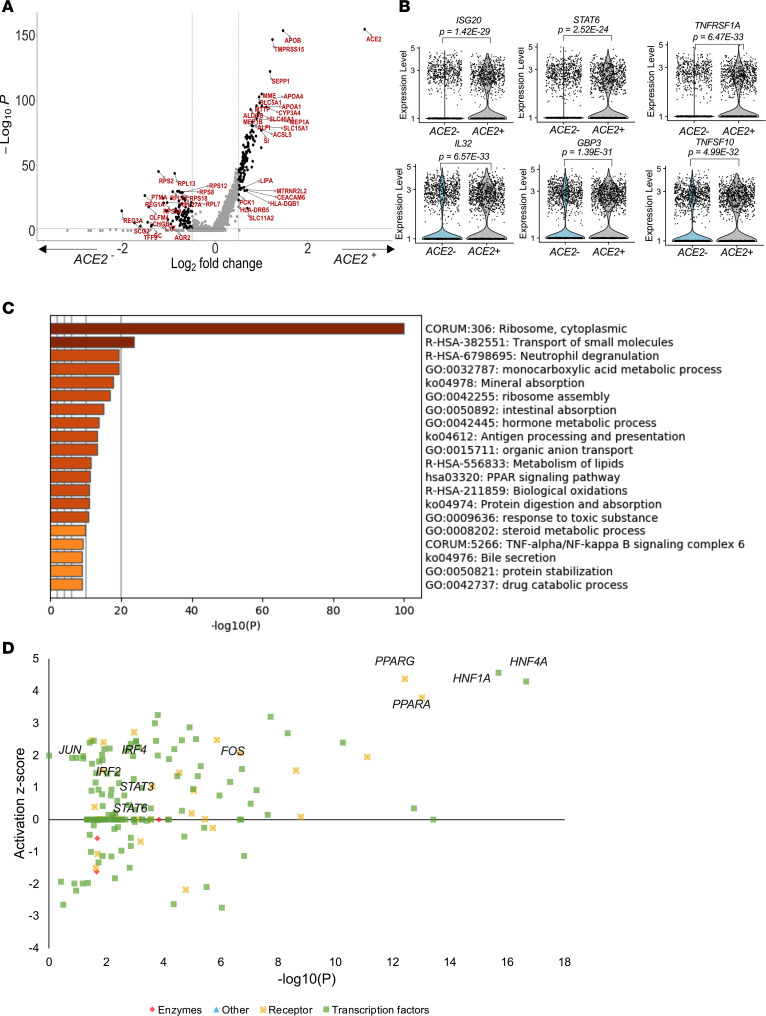
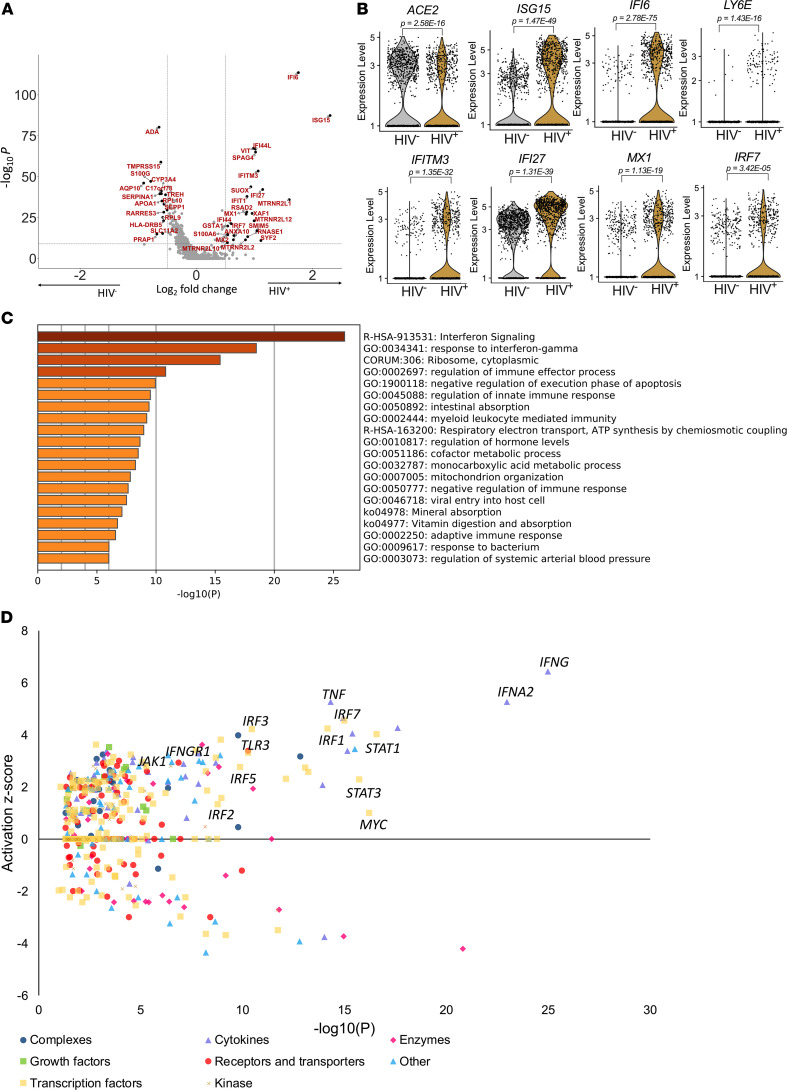
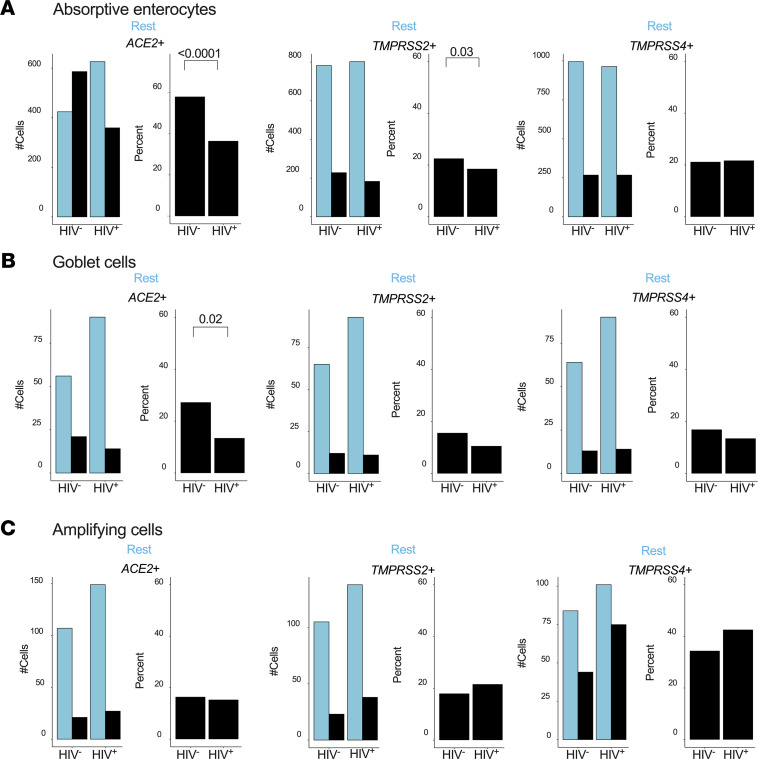
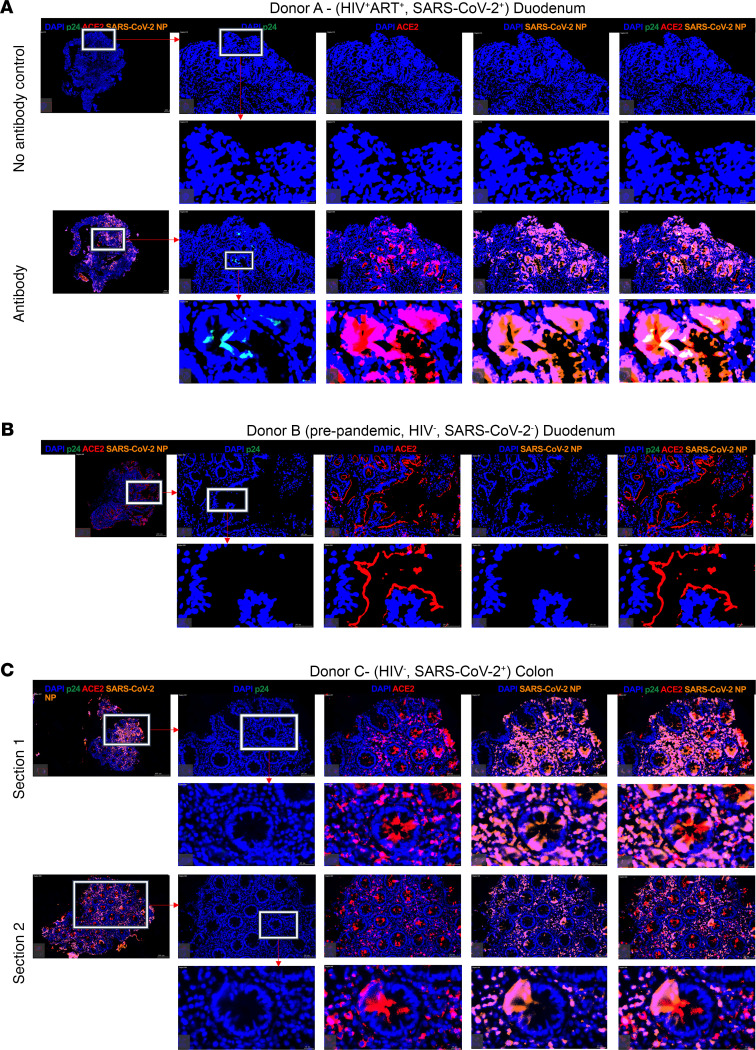
SARS-CoV-2 infects epithelial cells of the human gastrointestinal (GI) tract and causes related symptoms. HIV infection impairs gut homeostasis and is associated with an increased risk of COVID-19 fatality. To investigate the potential link between these observations, we analyzed single-cell transcriptional profiles and SARS-CoV-2 entry receptor expression across lymphoid and mucosal human tissue from chronically HIV-infected individuals and uninfected controls. Absorptive gut enterocytes displayed the highest coexpression of SARS-CoV-2 receptors ACE2, TMPRSS2, and TMPRSS4, of which ACE2 expression was associated with canonical interferon response and antiviral genes. Chronic treated HIV infection was associated with a clear antiviral response in gut enterocytes and, unexpectedly, with a substantial reduction of ACE2 and TMPRSS2 target cells. Gut tissue from SARS-CoV-2-infected individuals, however, showed abundant SARS-CoV-2 nucleocapsid protein in both the large and small intestine, including an HIV-coinfected individual. Thus, upregulation of antiviral response genes and downregulation of ACE2 and TMPRSS2 in the GI tract of HIV-infected individuals does not prevent SARS-CoV-2 infection in this compartment. The impact of these HIV-associated intestinal mucosal changes on SARS-CoV-2 infection dynamics, disease severity, and vaccine responses remains unclear and requires further investigation.

Keywords: AIDS/HIV; COVID-19; Innate immunity.


Conflict of interest statement

Conflict of interest: The authors have declared that no conflict of interests exists.

Figures

Figure 1
Figure 1. SARS-CoV-2 putative target cells are enriched in the human duodenum.
(A) Schematic of protocol for isolation of different tissues for scRNA-Seq using Seq-Well S3, to identify cell types. (B) Uniform manifold approximation and projection (UMAP) of 32,381 cells colored by tissue source. (C) Left: UMAP of epithelial cells showing expression of ACE2 (top), TMPRSS2 (middle), and TMPRSS4 (bottom) among all tissue sources from human donors. Color coding is as follows: purple, RNA positive; gray, RNA negative. Right: Corresponding violin plots of expression values for ACE2 (top), TMPRSS2 (middle), and TMPRSS4 (bottom). (D) Representative fluorescence immunohistochemistry image of gut tissue showing ACE2 (red), TMPRSS2 (orange), EpCAM (green), and DAPI (blue) of duodenum and colon. Bars: 20 μm for all images. (E) Quantification of ACE2 and TMPRSS2 proportion of total cells stained with EpCAM. Data shown as median ± SD.
Figure 2
Figure 2. ACE2 expression is enriched in absorptive enterocytes.
(A) UMAP of 13,056 cells from endoscopic pinch biopsies, colored by cell type. (B) Dot plot of 2 defining genes for each cell type and ACE2, TMPRSS2, and TMPRSS4. Dot size represents fraction of cells within cell type expressing a given gene, and color intensity represents binned count-based expression amounts (logscaled UMI+1) among expressing cells. Red arrow indicates cell type with largest proportion of ACE2+TMPRSS2+TMPRSS4+ cells; full results can be found in Supplemental Table 2A. (C) Expression of ACE2 (left), TMPRSS2 (middle), and TMPRSS4 (right) among all subsets from duodenum. UMI, unique molecular identifier.
Figure 3
Figure 3. ACE2-expressing absorptive enterocytes are linked to ISGs and functional absorptive pathways.
(A) Volcano plot of DEGs (Supplemental Table 2B) within epithelial cells from HIV-uninfected individuals (n = 4) highlighting genes with more than 0.5 fold change and adjusted P < 5.0 × 10⁸. (B) Violin plots of genes differentially expressed among ACE2+ and ACE2 epithelial cells, FDR-adjusted P < 0.05; full results can be found in Supplemental Table 2B. (C) GO BP enrichment analysis of the DEGs from epithelial cell analysis upregulated in ACE2+ compared with ACE2. P value was derived by a hypergeometric test. (D) Selected upstream drivers of pathways shown in C from DEGs in Supplemental Table 2D. GO, Gene Ontology; BP, biological pathway.
Figure 4
Figure 4. HIV infection downregulates ACE2 expression and drives interferon signaling in absorptive enterocytes.
(A) Volcano plot of DEGs (Supplemental Table 3B) within absorptive enterocytes in HIV-infected and HIV-uninfected cells highlighting genes with more than 0.5-fold change and adjusted P < 5.0 × 10⁸. (B) Violin plots of expression of ACE2 and interferon-responsive genes among absorptive enterocytes from HIV (n = 4) and HIV+ART+ (n = 5). (C) GO BP enrichment analysis of the DEGs of absorptive enterocytes upregulated in HIV (n = 4) and HIV+ART+ (n = 5). P value was derived by a hypergeometric test. (D) Activation z score of upstream drivers from DEGs shown in A and Supplemental Table 3D color-coded by their functional categories.
Figure 5
Figure 5. HIV infection reduces the frequency of SARS-CoV-2 putative target cells within the small intestine.
(A) Actual number of absorptive enterocytes (left) and percentage expression (right) of ACE2, TMPRSS2, and TMPRSS4 by HIV status. (B) Number of goblet cells (left) and percentage (right) expressing ACE2, TMPRSS2, and TMPRSS4 by HIV status. (C) Number of transit-amplifying cells (left) and percentage (right) expressing ACE2, TMPRSS2, and TMPRSS4 by HIV status. P values by Fisher’s Exact Test. Rest, cells not expressing the indicated transcript.
Figure 6
Figure 6. SARS-CoV-2 nucleocapsid detection overlaps with ACE2 expression in the small and large intestine.
Representative fluorescence immunohistochemistry (F-IHC) images of duodenum and colon tissues showing HIV-p24 (green), ACE2 (red), SARS-CoV-2 nucleocapsid protein (orange), and DAPI (blue). (A) F-IHC image of a duodenum tissue from an HIV+SARS-CoV-2+ participants by PCR including no antibody control (top). (B) F-IHC image of a duodenum tissue from an HIV- SARS-CoV-2+ participant. (C) F-IHC image of a colon tissue from HIV-SARS-CoV-2+ with 2 sections shown from the same biopsy tissue. Scale bars are shown at the bottom right of each image. Scale bars: 20 μm and 100 μm for magnified inserts and main images, respectively.

References

    1. Jin X, et al. Epidemiological, clinical and virological characteristics of 74 cases of coronavirus-infected disease 2019 (COVID-19) with gastrointestinal symptoms. Gut. 2020;69(6):1002–1009. doi: 10.1136/gutjnl-2020-320926. - DOI - PMC - PubMed
    1. Lamers MM, et al. SARS-CoV-2 productively infects human gut enterocytes. Science. 2020;369(6499):50–54. doi: 10.1126/science.abc1669. - DOI - PMC - PubMed
    1. Gaebler C, et al. Evolution of antibody immunity to SARS-CoV-2. Nature. 2021;591(7851):639–644. doi: 10.1038/s41586-021-03207-w. - DOI - PMC - PubMed
    1. Matheson NJ, Lehner PJ. How does SARS-CoV-2 cause COVID-19? Science. 2020;369(6503):510–511. doi: 10.1126/science.abc6156. - DOI - PubMed
    1. Xiao F, et al. Evidence for gastrointestinal infection of SARS-CoV-2. Gastroenterology. 2020;158(6):1831–1833. doi: 10.1053/j.gastro.2020.02.055. - DOI - PMC - PubMed

Publication types