. 2021 Jul 12;17(7):e1009663.
doi: 10.1371/journal.pgen.1009663. eCollection 2021 Jul.

Caenorhabditis elegans RMI2 functional homolog-2 (RMIF-2) and RMI1 (RMH-1) have both overlapping and distinct meiotic functions within the BTR complex

Affiliations

Caenorhabditis elegans RMI2 functional homolog-2 (RMIF-2) and RMI1 (RMH-1) have both overlapping and distinct meiotic functions within the BTR complex

Maria Velkova et al. PLoS Genet. .

Abstract

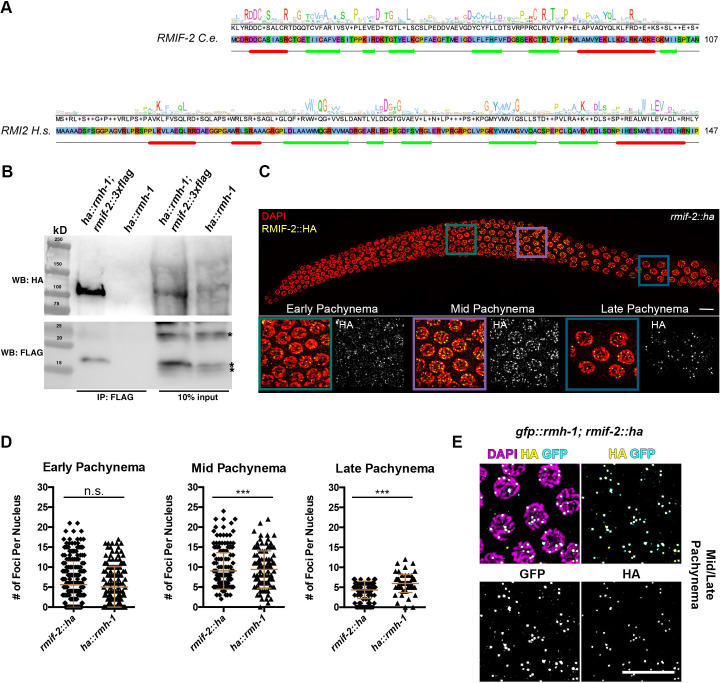
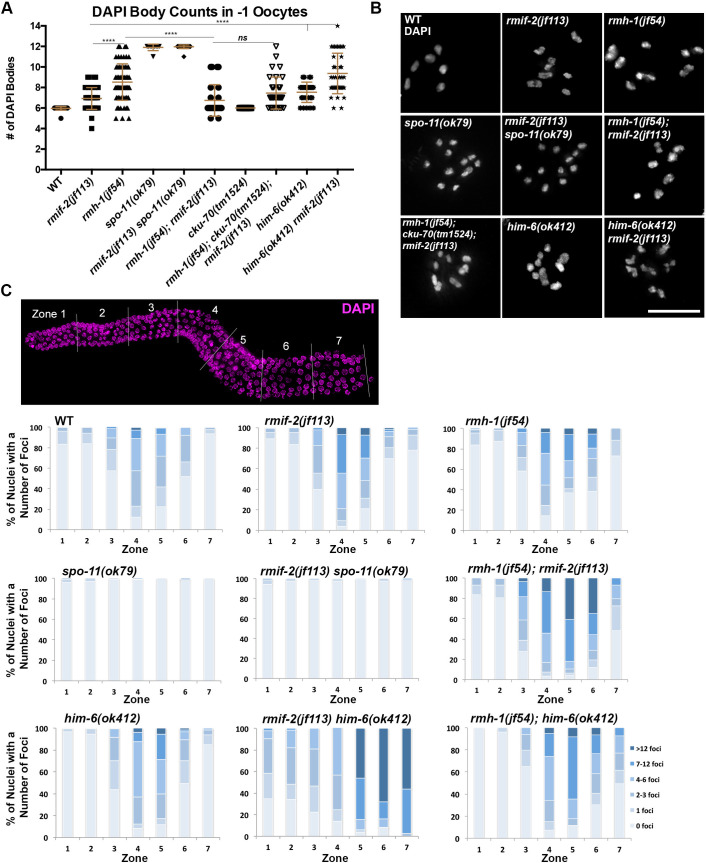
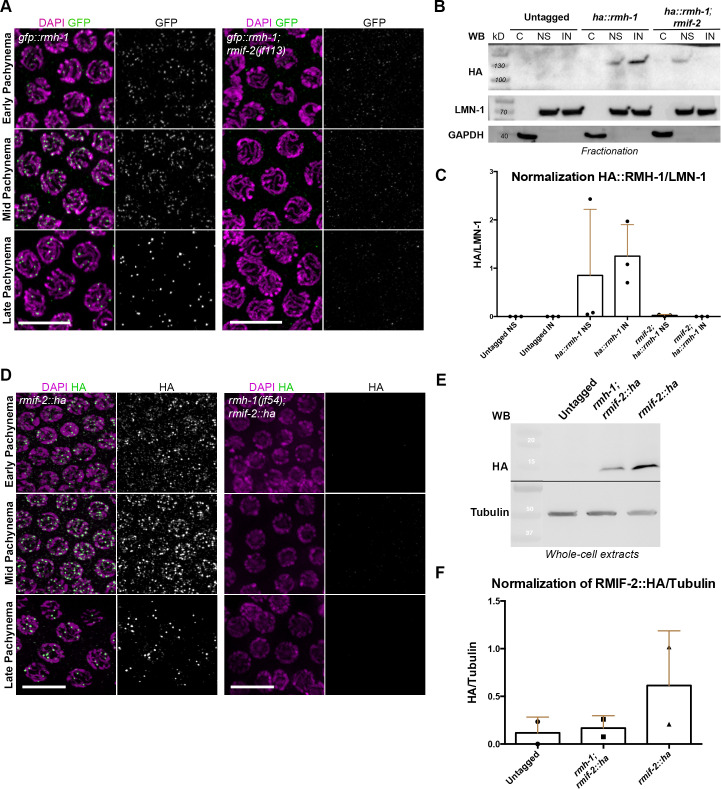
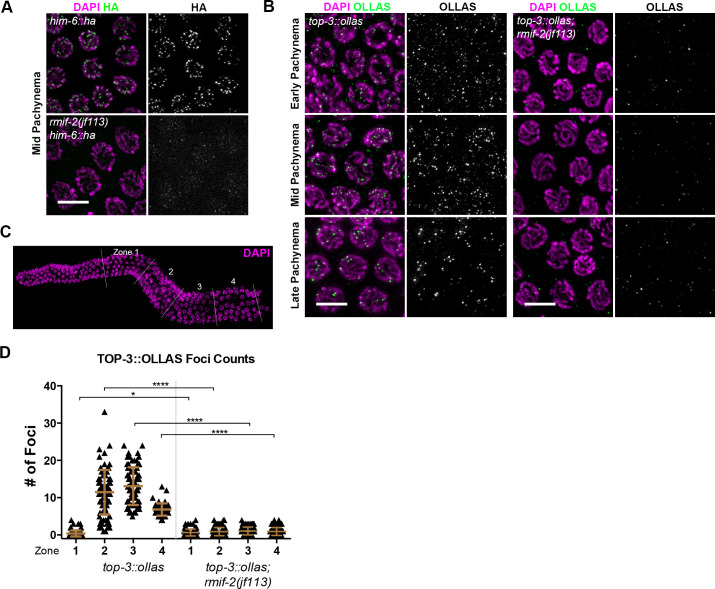
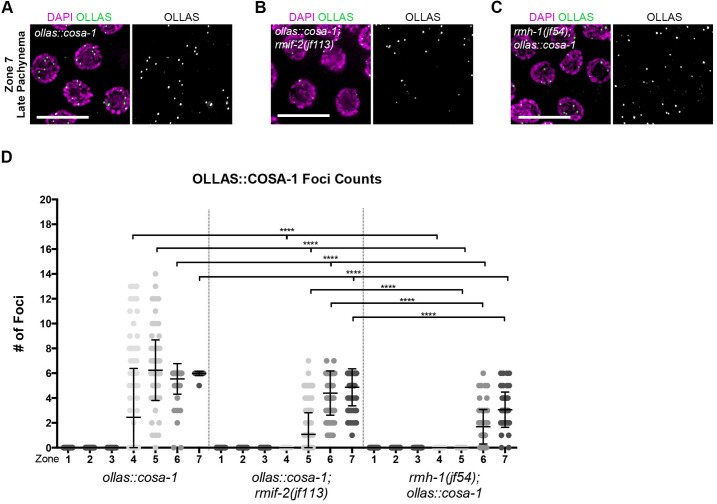
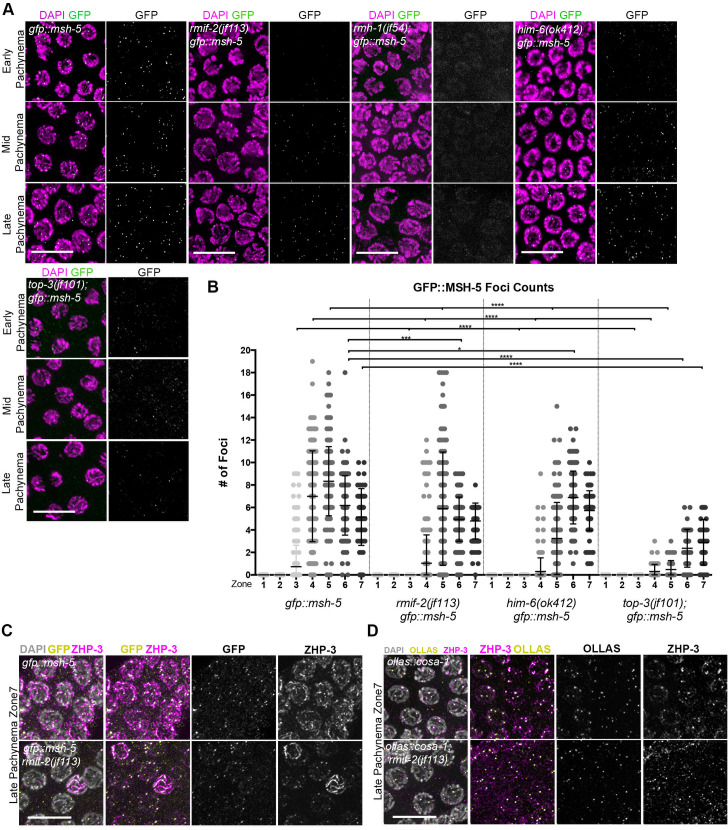
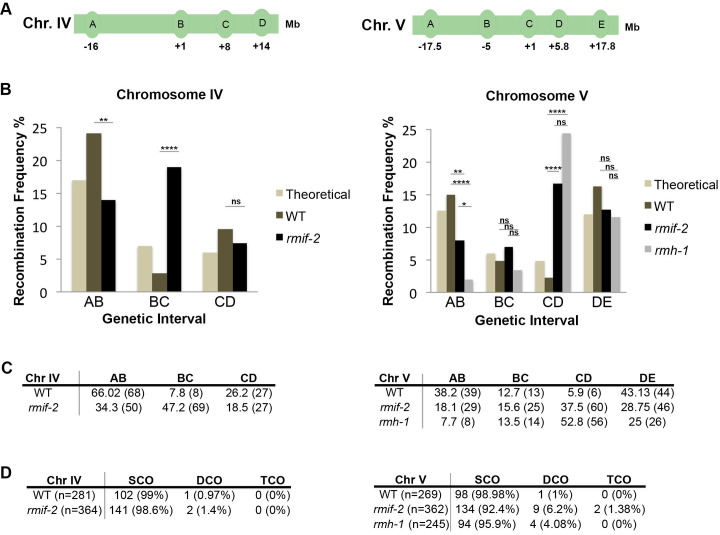
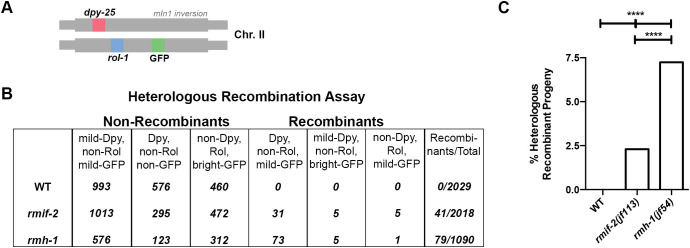
Homologous recombination is a high-fidelity repair pathway for DNA double-strand breaks employed during both mitotic and meiotic cell divisions. Such repair can lead to genetic exchange, originating from crossover (CO) generation. In mitosis, COs are suppressed to prevent sister chromatid exchange. Here, the BTR complex, consisting of the Bloom helicase (HIM-6 in worms), topoisomerase 3 (TOP-3), and the RMI1 (RMH-1 and RMH-2) and RMI2 scaffolding proteins, is essential for dismantling joint DNA molecules to form non-crossovers (NCOs) via decatenation. In contrast, in meiosis COs are essential for accurate chromosome segregation and the BTR complex plays distinct roles in CO and NCO generation at different steps in meiotic recombination. RMI2 stabilizes the RMI1 scaffolding protein, and lack of RMI2 in mitosis leads to elevated sister chromatid exchange, as observed upon RMI1 knockdown. However, much less is known about the involvement of RMI2 in meiotic recombination. So far, RMI2 homologs have been found in vertebrates and plants, but not in lower organisms such as Drosophila, yeast, or worms. We report the identification of the Caenorhabditis elegans functional homolog of RMI2, which we named RMIF-2. The protein shows a dynamic localization pattern to recombination foci during meiotic prophase I and concentration into recombination foci is mutually dependent on other BTR complex proteins. Comparative analysis of the rmif-2 and rmh-1 phenotypes revealed numerous commonalities, including in regulating CO formation and directing COs toward chromosome arms. Surprisingly, the prevalence of heterologous recombination was several fold lower in the rmif-2 mutant, suggesting that RMIF-2 may be dispensable or less strictly required for some BTR complex-mediated activities during meiosis.


Conflict of interest statement

The authors have declared that no competing interests exist.

Figures

Fig 1
Fig 1. RMIF-2 as a functional homolog of RMI2.
(A) A conservation histogram and consensus sequence (top lines), primary sequence (middle) and a secondary structure prediction (bottom line) of Caenorhabditis elegans RMIF-2 (UniProt accession Q8MXU4) and Homo sapiens RMI2 (Q96E14). In the case of RMIF-2, the conservation histogram and the consensus sequence are based on an alignment of nematode orthologs, and for RMI2 a wide selection of eukaryotic orthologs was used, including animal and plant sequences. Sequence letters were highlighted in the ClustalX color scheme to indicate amino acids with similar physicochemical properties. Secondary structure elements were predicted (Jpred), where the helices are marked as red tubes, and sheets as green arrows (JNETPSSM), [59]. Both families share the sequential arrangement of a five-stranded beta sheet and a c-terminal alpha helix. (B) Western blot analysis of FLAG pull downs revealed robust co-immunoprecipitation of HA::RMH-1 and RMIF-2::3×FLAG. ha::rmh-1 worms were used as the negative control. The predicted size of RMIF-2::3×FLAG is 16 kD and HA::RMH-1 109 kD. IP, immunoprecipitation; WB, western blot. Asterisks indicate unspecific bands. (C) A Representative image of RMIF-2 foci localization throughout the C. elegans gonad (stained with DAPI in red and HA in yellow). Foci start to appear in early pachynema and increase in number throughout mid pachynema; in the late stages of pachynema, foci numbers are reduced. Scale bar: 10μm. (D) Mean numbers of RMIF-2::HA and HA::RMH-1 foci throughout pachynema: early pachynema, 5.6 (±5.8 SD) RMIF-2 foci (n = 221) and 5 (±5.1 SD) RMH-1 foci (n = 156 nuclei); mid pachynema, 9.0 (±4.6 SD) RMIF-2 foci (n = 184) and 9.4 (±4.7 SD) RMH-1 foci (n = 106); and late pachynema, 4.3 (±2.2 SD) RMIF-2 foci (n = 118) and 5.9 (±2.3 SD) RMH-1 foci (n = 63); three gonads per genotype. Significant differences were determined using a Student T-test: ns = not significant (p > 0.05); *** p < 0.005. Data are the mean and standard deviation (error bars). (E) Representative images of C. elegans mid/late pachynema nuclei stained with DAPI (magenta), HA (yellow) and GFP (cyan). RMH-1 and RMIF-2 foci co-localize in mid–late pachynema nuclei. Scale bar: 10μm.
Fig 2
Fig 2. RMIF-2 is required for robust chiasma formation and chromosome segregation in meiosis.
(A) Quantification of DAPI-stained bodies in -1 diakinesis oocytes in the WT (number of nuclei, n = 32), rmif-2(jf113) (n = 41), rmh-1(jf54) (n = 74), spo-11(ok79) (n = 12), rmif-2(jf113) spo-11(ok79) (n = 32), rmh-1(jf54); rmif-2(jf113) (n = 27), cku-70(tm1524) (n = 19), rmh-1(jf54); cku-70(tm1524); rmif-2(jf113) (n = 33), him-6(ok412) (n = 26), and rmif-2(jf113) him-6(ok412) (n = 41) mutants. Data are the mean and standard deviation (error bars). Significant differences were determined using a Student T-test: **** p < 0.0001. (B) Representative images of chromosomes in a diakinesis nucleus for each genotype stained with DAPI. Scale bar: 10μm. (C) Quantification of RAD-51 profiles throughout meiotic prophase I (upper panel). C. elegans gonads were divided into seven equal zones. RAD-51 foci were counted in each nucleus of each zone; three representative gonads per genotype. Graphs show the percentage of nuclei with different numbers of foci per germline zone. Raw data and statistical analysis of RAD-51 profiles between different zones and genotypes via Fisher’s exact test are presented in S2 File. Scale bar: 10μm.
Fig 3
Fig 3. Chromatin loading and abundance of RMIF-2 and RMH-1 proteins are mutually dependent.
(A) Representative images of gfp::rmh-1 and gfp::rmh-1; rmif-2(jf113) pachytene nuclei stained with DAPI (magenta) and GFP (green). GFP::RMH-1 localization to nuclear foci starts in early pachynema, peaks in mid pachynema, and becomes concentrated in six foci in late pachynema. In the rmif-2 mutant background, RMH-1 fails to localize into foci throughout pachynema, except for a very few cytoplasmic foci. Scale bar: 10μm. (B) A protein fractionation shows specific HA::RMH-1 enrichment in the nucleus, which is reduced in the rmif-2 mutant. Equal amounts of protein were loaded for each fraction. C = cytosolic fraction, NS = soluble nuclear fraction, IN = insoluble nuclear fraction. LMN-1 was the loading control for nuclear fractions; GAPDH was the loading control for the cytosolic fraction. (C) Western blot normalization and quantification of nuclear fractionations from untagged WT, ha::rmh-1, and ha::rmh-1; rmif-2 samples. Three biological replicates were used for each sample. (D) Representative images of rmif-2::ha and rmh-1(jf54); rmif-2::ha pachytene nuclei stained with DAPI (magenta) and HA (green). RMIF-2 localization to nuclear foci throughout meiotic prophase starts in early pachytene nuclei, peaks in mid pachynema, and decreases in late pachynema. In the rmh-1 mutant background, RMIF-2 fails to localize to nuclear foci throughout pachynema. Scale bar: 10μm. (E) Western blot analysis of RMIF-2::HA in whole-cell extracts in WT (untagged) and the rmh-1 mutant background. WT worms were used to test the antibody specificity. The predicted size of RMIF-2::HA is 15kD. Tubulin was the loading control. (F) Western blot normalization and quantification of Untagged WT, rmh-1; rmif-2::ha and rmif-2::ha mutants. Two biological replicates were used.
Fig 4
Fig 4. Localization of HIM-6 and TOP-3 in the rmif-2 mutant.
(A) Representative him-6::ha and rmif-2(jf113) him-6::ha nuclei in mid pachynema stained with DAPI (in magenta) and HA (in green). HIM-6 localizes to bright foci throughout pachynema in him-6::ha. In the rmif-2 mutant, HIM-6 is detected in small, faint foci throughout pachynema. Scale bar: 5 μm. (B) Representative images of nuclei throughout pachynema stained with DAPI (in magenta) and OLLAS (in green). TOP-3::OLLAS localizes to distinct foci throughout early, mid, and late pachynema. In the rmif-2 mutant, TOP-3 fails to localize properly, and only a few cytoplasmic and nuclear foci can be observed. Scale bars: 5 μm. (C) For the quantification of TOP-3::OLLAS foci three gonads per genotype were each divided into four equal zones from the transition zone (beginning of meiosis) until late pachynema. (D) Quantification of TOP-3 foci in top-3::ollas and top-3::ollas; rmif-2 backgrounds, throughout the C. elegans gonad. The mean number of TOP-3 foci in each zone was WT: zone 1: 0.4 (±0.8 SD), n = 97 nuclei; zone 2: 11.5 (±6 SD), n = 89; zone 3: 13.1 (±5 SD), n = 79; and zone 4: 6.8 (±1.6 SD), n = 57; rmif-2: zone 1: 0.6 (±0.9 SD), n = 103 nuclei; zone 2: 0.9 (±1.0 SD), n = 109; zone 3: 1.0 (±1.0 SD), n = 94; zone 4: 0.7 (±0.98 SD), n = 57.
Fig 5
Fig 5. Analysis of the recombination marker OLLAS::COSA-1 in the rmif-2 and rmh-1 mutants.
(A–C) Representative images (top) stained for DAPI (in magenta) and OLLAS (in green) in late pachynema (zone 7; defined in Fig 2) and quantification of OLLAS::COSA-1 nuclear foci (bottom) in the ollas::cosa-1, in ollas::cosa-1; rmif-2(jf113) and rmh-1(jf54); ollas::cosa-1 mutants. Scale bars, 10 μm. (D) Gonads were divided into seven equal zones from the mitotic tip to late pachynema (n = 3 gonads per genotype). Significant differences in foci distribution were determined using a Mann-Whitney test: zone 4: ollas::cosa-1 vs ollas::cosa-1; rmif-2 **** (p<0.0001); ollas::cosa-1 vs rmh-1; ollas::cosa-1 **** (p<0.0001); ollas::cosa-1; rmif-2 vs rmh-1; ollas::cosa-1 ns (p>0.9999). Zone 5: ollas::cosa-1 vs ollas::cosa-1; rmif-2 **** (p<0.0001); ollas::cosa-1 vs rmh-1; ollas::cosa-1 **** (p<0.0001); ollas::cosa-1; rmif-2 vs rmh-1; ollas::cosa-1 **** (p<0.0001). Zone 6: ollas::cosa-1 vs ollas::cosa-1; rmif-2 **** (p<0.0001); ollas::cosa-1 vs rmh-1; ollas::cosa-1 **** (p<0.0001); ollas::cosa-1; rmif-2 vs rmh-1; ollas::cosa-1 **** (p<0.0001). Zone 7: ollas::cosa-1 vs ollas::cosa-1; rmif-2 **** (p<0.0001); ollas::cosa-1 vs rmh-1; ollas::cosa-1 **** (p<0.0001); ollas::cosa-1; rmif-2 vs rmh-1; ollas::cosa-1 **** (p<0.0001).
Fig 6
Fig 6. GFP::MSH-5 localization in BTR complex mutants.
(A) Representative images of GFP::MSH-5 nuclear foci (in green) and DAPI (in magenta) in early, mid, and late pachynema in the gfp::msh-5 and rmif-2(jf113) gfp::msh-5, rmh-1(jf54); gfp::msh-5, him-6(ok412) gfp::msh-5 and top-3(jf101); gfp::msh-5 mutants. Scale bars, 10 μm. (B) Quantification of GFP::MSH-5 nuclear foci in gfp::msh-5, rmif-2(jf113) gfp::msh-5, him-6(ok412) gfp::msh-5 and top-3(jf101); gfp::msh-5 mutants. Gonads were divided into seven equal zones from the mitotic tip to late pachynema (n = 3 gonads per genotype). Significant differences in foci distribution were determined using a Mann-Whitney test. Zone 3: gfp::msh-5 vs rmif-2 gfp::msh-5 **** (p<0.0001); gfp::msh-5 vs him-6 gfp::msh-5 **** (p<0.0001); gfp::msh-5 vs top-3; gfp::msh-5 **** (p<0.0001). Zone 4: gfp::msh-5 vs rmif-2 gfp::msh-5 **** (p<0.0001); gfp::msh-5 vs him-6 gfp::msh-5 **** (p<0.0001); gfp::msh-5 vs top-3; gfp::msh-5 **** (p<0.0001). Zone 5: gfp::msh-5 vs rmif-2 gfp::msh-5 **** (p<0.0001); gfp::msh-5 vs him-6 gfp::msh-5 **** (p<0.0001); gfp::msh-5 vs top-3; gfp::msh-5 **** (p<0.0001). Zone 6: gfp::msh-5 vs rmif-2 gfp::msh-5 *** (p = 0.0003); gfp::msh-5 vs him-6 gfp::msh-5 * (p = 0.0279); gfp::msh-5 vs top-3; gfp::msh-5 **** (p<0.0001). Zone 7: gfp::msh-5 vs rmif-2 gfp::msh-5 ns (p = 0.0501); gfp::msh-5 vs him-6 gfp::msh-5 ns (p = 0.3057); gfp::msh-5 vs top-3; gfp::msh-5 **** (p<0.0001). (C) Representative images of GFP::MSH-5 (yellow) and ZHP-3 (magenta) co-localization in late pachytene nuclei in gfp::msh-5 and rmif-2(jf113) gfp::msh-5 backgrounds. Scale bar, 10 μm. (D) Representative images of OLLAS (yellow) and ZHP-3 (magenta) co-localization in late pachytene nuclei in ollas::cosa-1 and ollas::cosa-1; rmif-2(jf113) backgrounds. Scale bar, 10 μm.
Fig 7
Fig 7. RMIF-2 controls the CO position and suppresses the formation of additional COs.
(A) Schematic diagrams of chromosome (Chr.) IV (left) and V (right), showing the locations of the SNPs used in the PCR-based recombination assay. (B) Recombination frequencies on chromosomes IV (left) and V (right) assessed for different genetic intervals in WT, rmif-2 and rmh-1. The ‘theoretical’ column is the expected recombination frequency based on the published genetic distance (http://www.wormbase.org). Statistical significance for recombination frequency over the total amount of worms was calculated using the Fisher’s exact test: Chr. IV WT vs rmif-2 ns (p = 0.568); Chr. V WT vs rmif-2 ns (p = 0.4579); wt vs rmh-1 ns (p = 0.6507); rmif-2 vs rmh-1 ns (p = 0.8662). Statistical significance of recombination frequencies between specific SNPs was calculated via a χ2 test: Chr IV Interval AB: WT vs Theoretical ns (p>0.05); WT vs rmif-2 ** (p = 0.0048); Interval BC: WT vs Theoretical ns (p>0.05); WT vs rmif-2 **** (p<0.0001); Interval CD: WT vs Theoretical ns (p>0.05); WT vs rmif-2 ns (p = 0.2749). Chr V Interval AB: WT vs Theoretical ns (p>0.05); WT vs rmif-2 ** (p = 0.0062); WT vs rmh-1 **** (p<0.0001); rmif-2 vs rmh-1 * (p = 0.0362). Interval BC: WT vs Theoretical ns (p>0.05); WT vs rmif-2 ns (p = 0.5759); WT vs rmh-1 ns (p = 0.8938); rmif-2 vs mrh-1 ns (p = 0.6760). Interval CD WT vs Theoretical ns (p>0.05); WT vs rmif-2 **** (p<0.0001); WT vs rmh-1 **** (p<0.0001); rmif-2 vs rmh-1 ns (p = 0.1063). Interval DE: WT vs Theoretical ns (p>0.05); WT vs rmif-2 ns (p = 0.0981); WT vs rmh-1 ns (p = 0.0533); rmif-2 vs rmh-1 ns (p = 0.6122). Number of animals analyzed Chr IV: WT 281 worms, rmif-2 364 worms; Chr V: WT 269 worms, rmif-2 362 worms; rmh-1 245 worms. COs were shifted toward the chromosome center in the mutants compared with the WT. (C) The table contains the percentage of SNPs in each genetic interval on Chr IV (left) and Chr V (right). The number of COs per interval is shown in brackets. (D) Table displaying the number and percentage (in brackets) of single (SCO), double (DCO) and triple (TCO) crossovers in the genotypes analysed. n indicates the number of worms analyzed. χ2 test analysis showed that the change in crossover distribution between WT and rmif-2 is significantly different on both chromosome IV (*** p = 0.0006) and chromosome V (** p = 0.0027). The change in crossover distribution between WT and rmh-1 on chromosome V was statistically significant (**** p<0.0001). The change in crossover distribution between rmif-2 and rmh-1 on chromosome V was not statistically significant (p = 0.0995).
Fig 8
Fig 8. RMH-1 and RMIF-2 suppress heterologous recombination to different extents.
(A) A heterologous recombination assay [12] was used to determine the involvement of rmh-1 and rmif-2 in suppressing illegitimate recombination events. The method used to score heterologous recombination relies on the use of the mIn1 inversion on chromosome II (scoring for the exchange of shown genetic markers). (B) In WT (n = 2029 worms), no heterologous recombination was observed among the progeny; rmif-2 (n = 2018) 41 recombinant progeny; rmh-1 (n = 1090), 79 recombinant progeny. (C) Rate of heterologous recombinant progeny: WT, 0%; rmif-2, 2.3%; and rmh-1, 7.24%. The level of heterologous recombination in the rmh-1 mutant is around three times higher than in the rmif-2 mutant. Statistical analysis was done with a Fisher’s exact test: WT vs rmif-2 **** (p<0.0001); WT vs rmh-1 **** (p<0.0001); rmif-2 vs rmh-1 **** (p<0.0001).

References

    1. Wright WD, Shah SS, Heyer WD. Homologous recombination and the repair of DNA double-strand breaks. J Biol Chem. 2018;293(27):10524–35. Epub 2018/03/31. doi: 10.1074/jbc.TM118.000372 ; PubMed Central PMCID: PMC6036207. - DOI - PMC - PubMed
    1. Hunter N. Meiotic Recombination: The Essence of Heredity. Cold Spring Harbor perspectives in biology. 2015;7(12). Epub 2015/10/30. doi: 10.1101/cshperspect.a016618 ; PubMed Central PMCID: PMC4665078. - DOI - PMC - PubMed
    1. Bizard AH, Hickson ID. The dissolution of double Holliday junctions. Cold Spring Harbor perspectives in biology. 2014;6(7):a016477. doi: 10.1101/cshperspect.a016477 . - DOI - PMC - PubMed
    1. Bachrati CZ, Hickson ID. RecQ helicases: suppressors of tumorigenesis and premature aging. Biochem J. 2003;374(Pt 3):577–606. Epub 2003/06/14. doi: 10.1042/BJ20030491 ; PubMed Central PMCID: PMC1223634. - DOI - PMC - PubMed
    1. Hudson DF, Amor DJ, Boys A, Butler K, Williams L, Zhang T, et al.. Loss of RMI2 Increases Genome Instability and Causes a Bloom-Like Syndrome. PLoS Genet. 2016;12(12):e1006483. Epub 2016/12/16. doi: 10.1371/journal.pgen.1006483 ; PubMed Central PMCID: PMC5157948. - DOI - PMC - PubMed

Publication types

MeSH terms

Substances