. 2021 Jul 12;17(7):e1009196.
doi: 10.1371/journal.pcbi.1009196. eCollection 2021 Jul.

Partial information decomposition reveals that synergistic neural integration is greater downstream of recurrent information flow in organotypic cortical cultures

Affiliations

Partial information decomposition reveals that synergistic neural integration is greater downstream of recurrent information flow in organotypic cortical cultures

Samantha P Sherrill et al. PLoS Comput Biol. .

Abstract

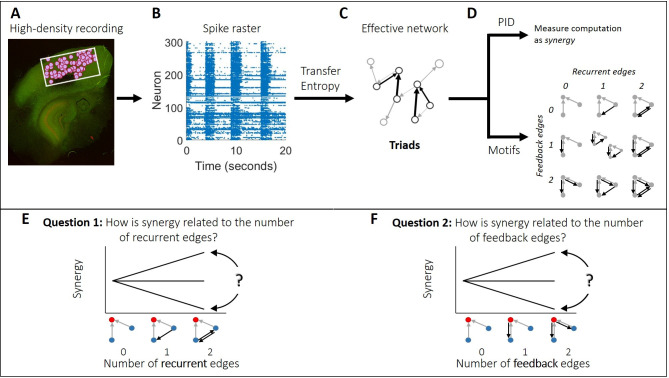
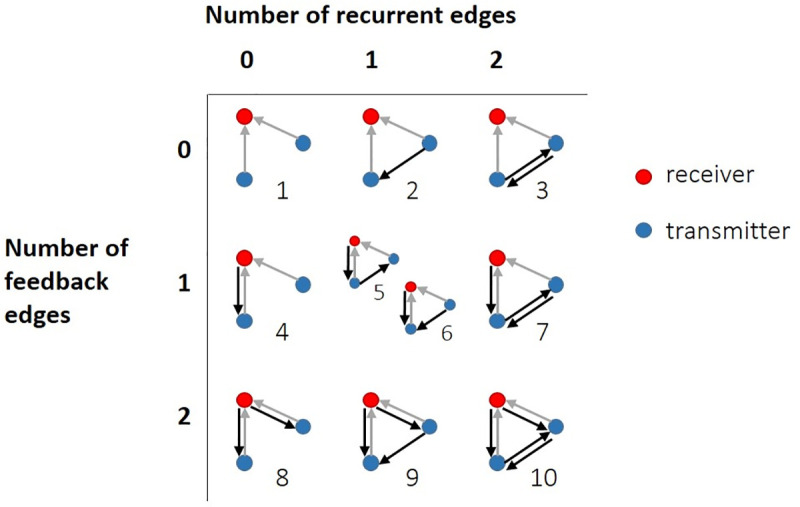
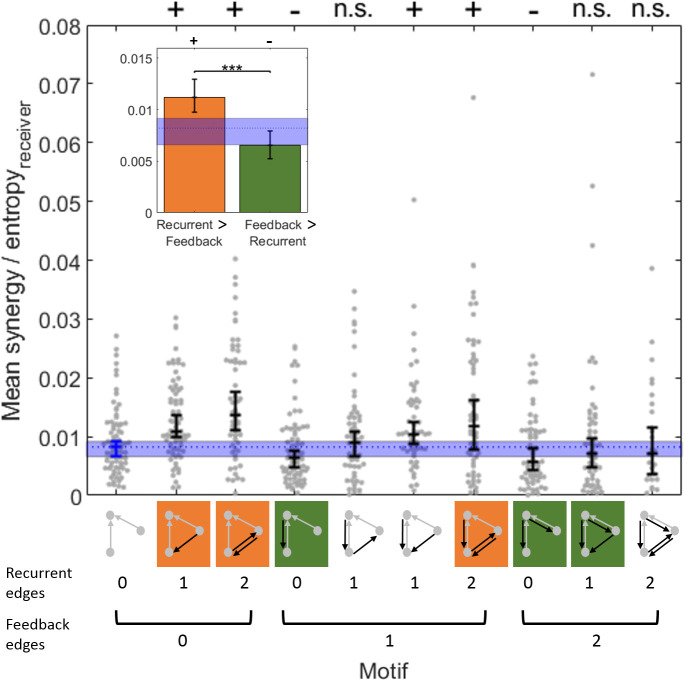
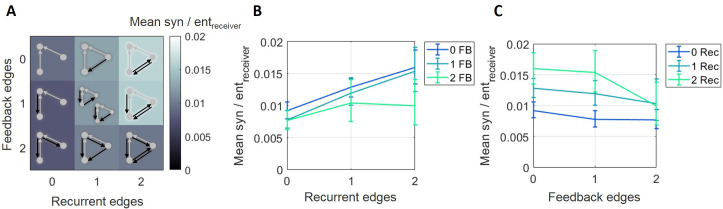
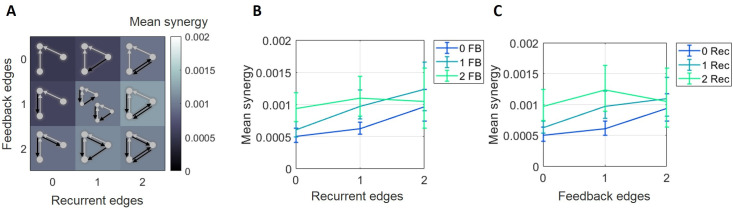
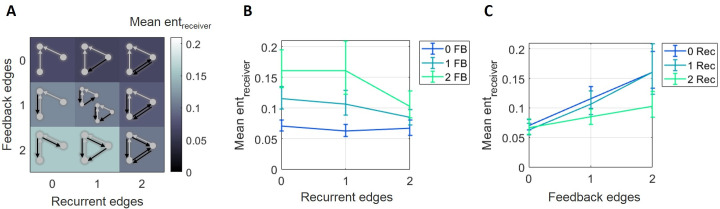
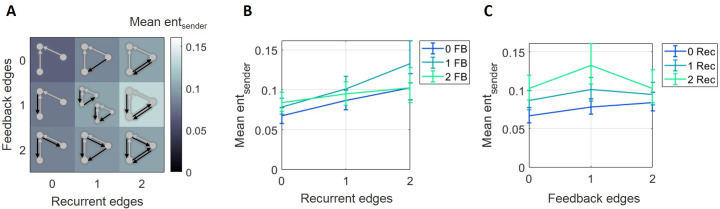
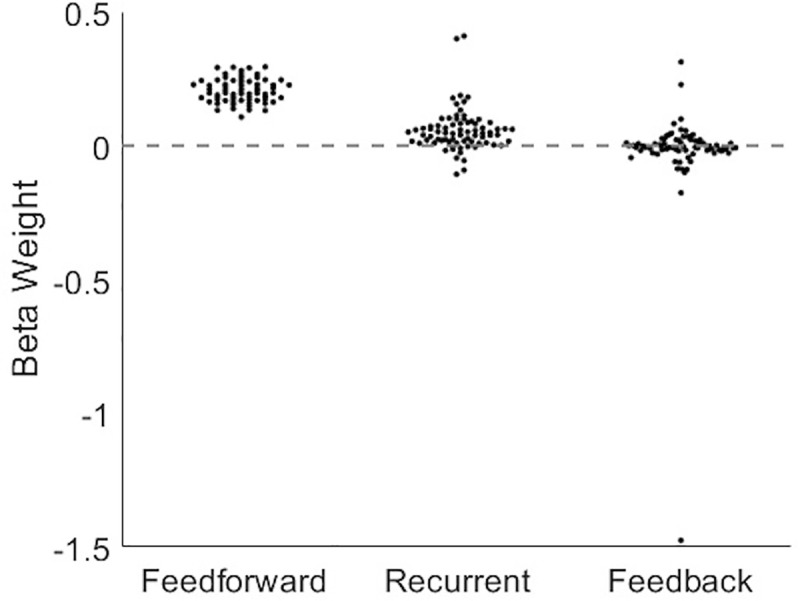
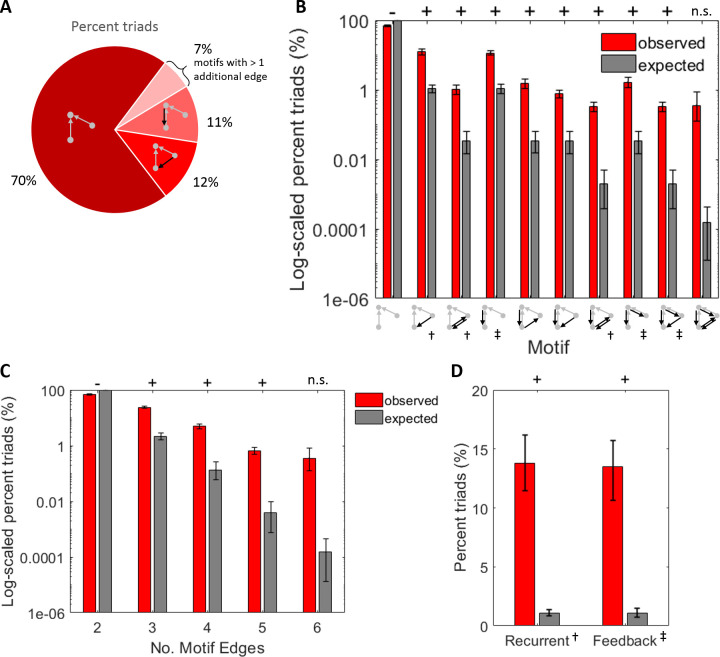
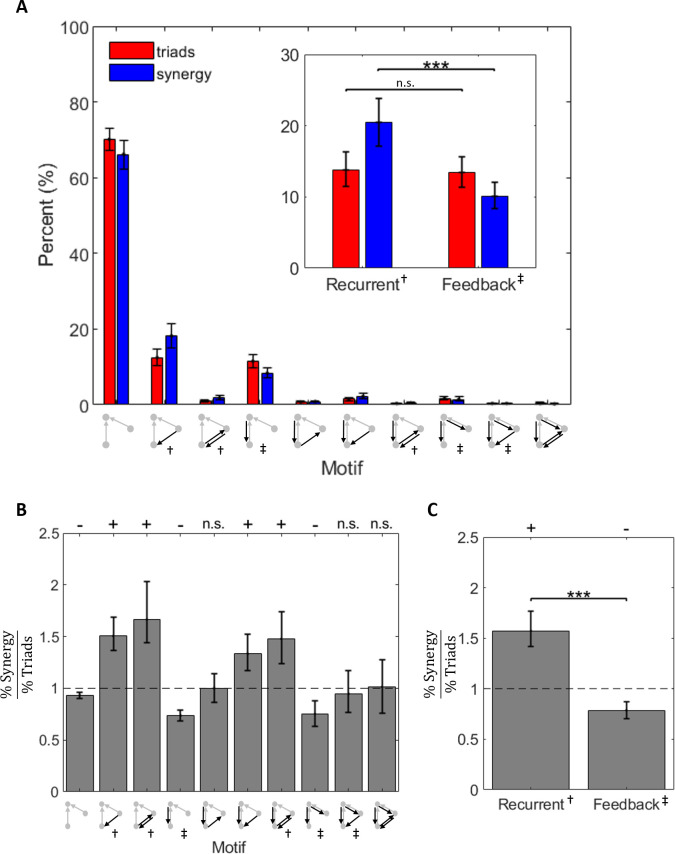
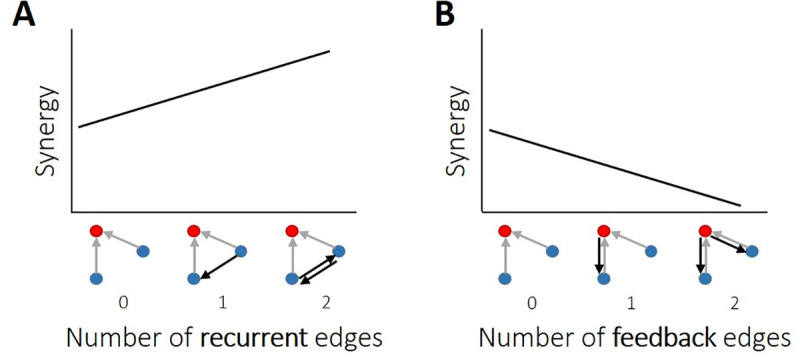
The directionality of network information flow dictates how networks process information. A central component of information processing in both biological and artificial neural networks is their ability to perform synergistic integration-a type of computation. We established previously that synergistic integration varies directly with the strength of feedforward information flow. However, the relationships between both recurrent and feedback information flow and synergistic integration remain unknown. To address this, we analyzed the spiking activity of hundreds of neurons in organotypic cultures of mouse cortex. We asked how empirically observed synergistic integration-determined from partial information decomposition-varied with local functional network structure that was categorized into motifs with varying recurrent and feedback information flow. We found that synergistic integration was elevated in motifs with greater recurrent information flow beyond that expected from the local feedforward information flow. Feedback information flow was interrelated with feedforward information flow and was associated with decreased synergistic integration. Our results indicate that synergistic integration is distinctly influenced by the directionality of local information flow.


Conflict of interest statement

The authors have declared that no competing interests exist.

Figures

Fig 1
Fig 1. Methodological approach taken to ask how synergy is related to recurrent and feedback information flow in organotypic cultures of mouse cortex.
(A) Hour-long recordings of spiking activity were collected in vitro from organotypic cultures of mouse somatosensory cortex using a high density 512-channel multielectrode array. (B) Spike sorting yielded spike trains of hundreds of well-isolated individual neurons per recording. (C) Transfer entropy was used to identify significant information flow between neuron pairs. This comprised the effective connections (edges) in a functional network. The resulting effective networks were analyzed to identify all triads consisting of two edges connecting to a common receiver. (D) For each triad, we quantified the amount of synergy via partial information decomposition (PID). We also identified all possible relevant motifs and arranged them according to the number of recurrent and feedback edges they contained. (E-F) We sought to answer two questions. (E) Is synergy positively related, negatively related, or unrelated to the number of recurrent edges? (F) Is synergy positively related, negatively related, or unrelated to the number of feedback edges? Triads consist of two transmitter neurons (blue), each with feedforward edges (gray arrows) connecting to a receiver neuron (red). Black arrows depict recurrent and feedback edges on the left and right, respectively.
Fig 2
Fig 2. Set of synergistic 3-node motifs.
Synergistic motifs were those in which both transmitters (blue dots) sent input (gray arrows) to the same receiver (red dots). Motifs were arranged in order (1–10) of the number of feedback and recurrent edges they contained (black arrows); either 0, 1 or 2.
Fig 3
Fig 3. Normalized synergy was greater in recurrent motifs than in feedback motifs.
Point clouds show the mean synergy value for each of the 75 networks analyzed for each type of motif. For distributions in which not all networks exhibited the motif, n<75. Central tendency and error bars depict the median and the 95% bootstrap confidence interval around the median. The motifs are graphically depicted below the x-axis and are organized by the number of feedback and recurrent edges. Motifs with more recurrent than feedback edges are indicated in orange. Motifs with more feedback than recurrent edges are indicated in green. Inset: Synergy values from motifs with greater recurrence or greater feedback were aggregated to directly compare the mean synergy. In both panels, the median (dotted line) and 95% bootstrap confidence interval (blue region) for baseline synergy values in default motifs (with 0 recurrent and 0 feedback edges) is shown. Significance indicators: ‘+’ and ‘-’ indicates p<0.01 by a two-tailed test wherein ‘+’ indicates significantly more than baseline and ‘-’ indicates significantly less than baseline; *** p<1x10⁻⁹.
Fig 4
Fig 4. Normalized synergy increased with greater recurrence and decreased with greater feedback.
(A) Motifs are ordered based on the number of recurrent edges (columns) and feedback edges (rows). The background heatmap, wherein brighter colors reflect larger normalized synergy values, replots the central tendency of the values shown in Fig 3. (B) Curves representing rows shown in A, plotted with errorbars computed across networks, show that synergy increased as the number of recurrent edges increased. (C) Curves representing columns shown in A, plotted with errorbars computed across networks, show that synergy decreased as the number of feedback edges increased. Errorbars are 95% bootstrap confidence intervals around the mean.
Fig 5
Fig 5. Raw synergy increased with greater recurrence and greater feedback.
(A) Mean synergy increased with the number of recurrent and feedback edges in motifs. (B) Curves representing rows shown in A, plotted with errorbars computed across networks, show that synergy increased as the number of recurrent edges increased, although the difference in means across levels was not significant. (C) Curves representing columns shown in A, plotted with errorbars computed across networks, show that synergy increased as the number of feedback edges increased. Errorbars are 95% bootstrap confidence intervals around the mean.
Fig 6
Fig 6. Receiver entropy decreased with greater recurrence and increased with greater feedback.
(A) Mean receiver entropy decreased with the number of recurrent edges and increased with the number of feedback edges in motifs. (B) Curves representing rows shown in A, plotted with errorbars computed across networks, show that receiver entropy decreased as the number of recurrent edges increased. (C) Curves representing columns shown in A, plotted with errorbars computed across networks, show that receiver entropy increased as the number of feedback edges increased. Errorbars are 95% bootstrap confidence intervals around the mean.
Fig 7
Fig 7. Sender entropy increased with greater recurrence and greater feedback.
(A) Mean sender entropy increased with the number of recurrent edges and with the number of feedback edges in motifs. (B) Curves representing rows shown in A, plotted with errorbars computed across networks, show that sender entropy increased as the number of recurrent edges increased. (C) Curves representing columns shown in A, plotted with errorbars computed across networks, show that sender entropy increased as the number of feedback edges increased. Errorbars are 95% bootstrap confidence intervals around the mean.
Fig 8
Fig 8. The strength of feedforward and recurrent edges was predictive of normalized synergy.
Histograms of beta weights for multiple linear regressions performed on the network-level revealed that feedforward and recurrent edge weights were reliable predictors of normalized synergy, across networks. Feedback edge weight was not a reliable predictor of normalized synergy.
Fig 9
Fig 9. Recurrent and feedback motifs were rare but occurred more than expected given the network-wide edge density.
(A) Percent of network triads accounted for by each motif type. Motifs with greater edge density were more rare. Values indicate means across all networks. (B) Log10 scaled observed percentages of triads compared to expected percentages of triads per motif. Expected percentages obtained by raising the probability of observing a connection to the power of the number of edges in the motif, for each network. (C) Log10 scaled observed and expected percentages of triads in (B), grouped by the number of edges they contain. (D) Linearly scaled observed and expected percentages of triads in (A), grouped by the number of recurrent and feedback edges they contain. Significance indicators: ‘+’ indicates significantly more than expected and ‘-’ indicates significantly less than expected. For all significant values, p<1x10⁻⁶. Motif indicator: † Recurrent, ‡ Feedback.
Fig 10
Fig 10. Recurrent and feedback motifs accounted for more and less network-wide synergy than expected, respectively.
(A) Both recurrent motifs and feedback motifs were relatively rare, and they accounted for a relatively small proportion of overall synergy. Red bars from Fig 9B are replotted on a linear scale here for comparison. Inset: Recurrent motifs were as common as feedback motifs, but they accounted for significantly more synergy than feedback motifs. Red bars from Fig 9D are replotted here for comparison. (B) The ratio of percent synergy to percent triads is shown per motif. Values above one indicate that the motif accounts for greater network-wide synergy than it does triads. Values less than one indicate that the motif accounts for less network-wide synergy than it does triads. (C) Recurrent motifs accounted for more synergy than expected given their frequency. Conversely, feedback motifs accounted for less synergy than expected given their frequency. Significance was determined by asking whether the distribution of ratios for each motif came from a distribution whose mean is equal to 1 (t-test). Significance indicators: ‘+’ indicates significantly more than expected and ‘-’ indicates significantly less than expected. For all significant values, p<0.001. Central tendency shown in each figure is mean and error bars are 95% bootstrap confidence intervals around the mean. Mean was selected over median to ensure that percentages sum to 100. Significance indicator: *** p<0.001. Motif indicator: † Recurrent, ‡ Feedback.
Fig 11
Fig 11. Summary of findings regarding how synergy is related to recurrent and feedback information flow in organotypic cultures of mouse cortex.
(A-B) Synergy had a positive relationship with the number of recurrent edges and a negative relationship with the number of feedback edges. That is, synergy was elevated where there was greater upstream recurrent information flow. Synergy was diminished where there was greater feedback information flow.

References

    1. Ahissar E, Kleinfeld D. Closed-loop neuronal computations: focus on vibrissa somatosensation in rat. Cerebral Cortex. 2003. Jan 1;13(1):53–62. doi: 10.1093/cercor/13.1.53 - DOI - PubMed
    1. Basheer IA, Hajmeer M. Artificial neural networks: fundamentals, computing, design, and application. Journal of microbiological methods. 2000. Dec 1;43(1):3–1. doi: 10.1016/s0167-7012(00)00201-3 - DOI - PubMed
    1. Kriegeskorte N. Deep neural networks: a new framework for modeling biological vision and brain information processing. Annual review of vision science. 2015. Nov 24;1:417–46. doi: 10.1146/annurev-vision-082114-035447 - DOI - PubMed
    1. Lamme VA, Roelfsema PR. The distinct modes of vision offered by feedforward and recurrent processing. Trends in neurosciences. 2000. Nov 1;23(11):571–9. doi: 10.1016/s0166-2236(00)01657-x - DOI - PubMed
    1. Shushruth S, Mangapathy P, Ichida JM, Bressloff PC, Schwabe L, Angelucci A. Strong recurrent networks compute the orientation tuning of surround modulation in the primate primary visual cortex. Journal of Neuroscience. 2012. Jan 4;32(1):308–21. doi: 10.1523/JNEUROSCI.3789-11.2012 - DOI - PMC - PubMed

Publication types