. 2021 Jul 12;15(7):e0009556.
doi: 10.1371/journal.pntd.0009556. eCollection 2021 Jul.

Effectiveness of Wolbachia-infected mosquito deployments in reducing the incidence of dengue and other Aedes-borne diseases in Niterói, Brazil: A quasi-experimental study

Affiliations

Effectiveness of Wolbachia-infected mosquito deployments in reducing the incidence of dengue and other Aedes-borne diseases in Niterói, Brazil: A quasi-experimental study

Sofia B Pinto et al. PLoS Negl Trop Dis. .

Abstract

Background: The introduction of the bacterium Wolbachia (wMel strain) into Aedes aegypti mosquitoes reduces their capacity to transmit dengue and other arboviruses. Evidence of a reduction in dengue case incidence following field releases of wMel-infected Ae. aegypti has been reported previously from a cluster randomised controlled trial in Indonesia, and quasi-experimental studies in Indonesia and northern Australia.

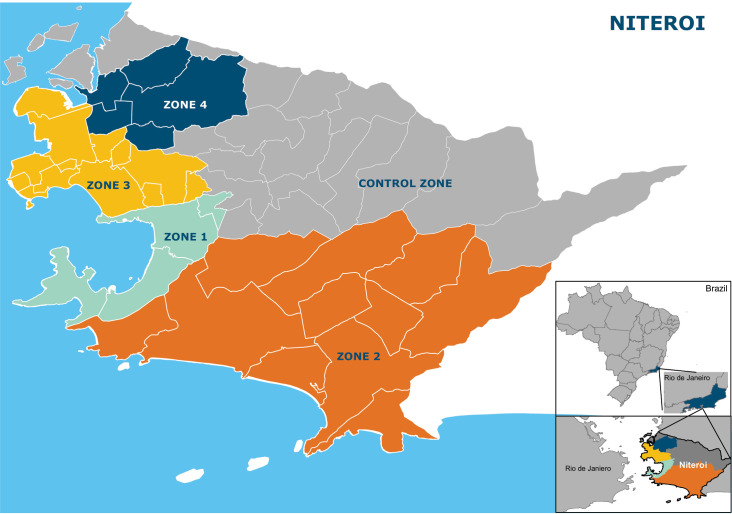
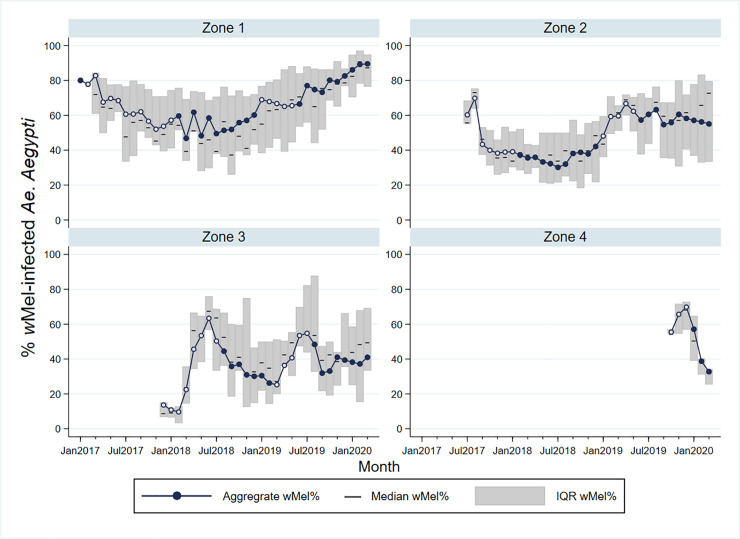
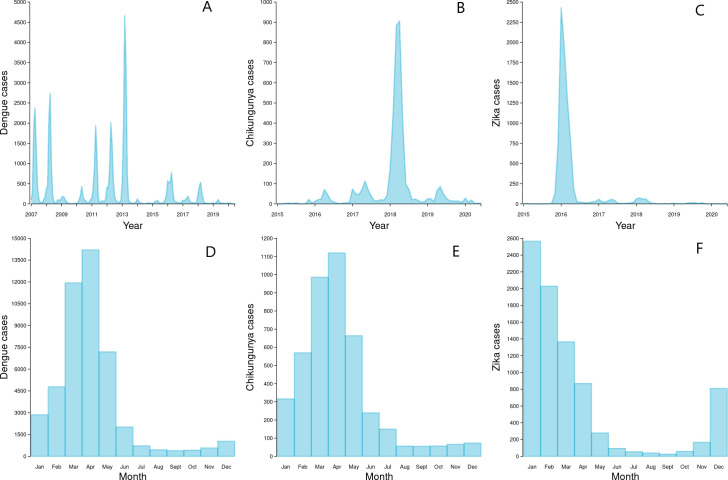
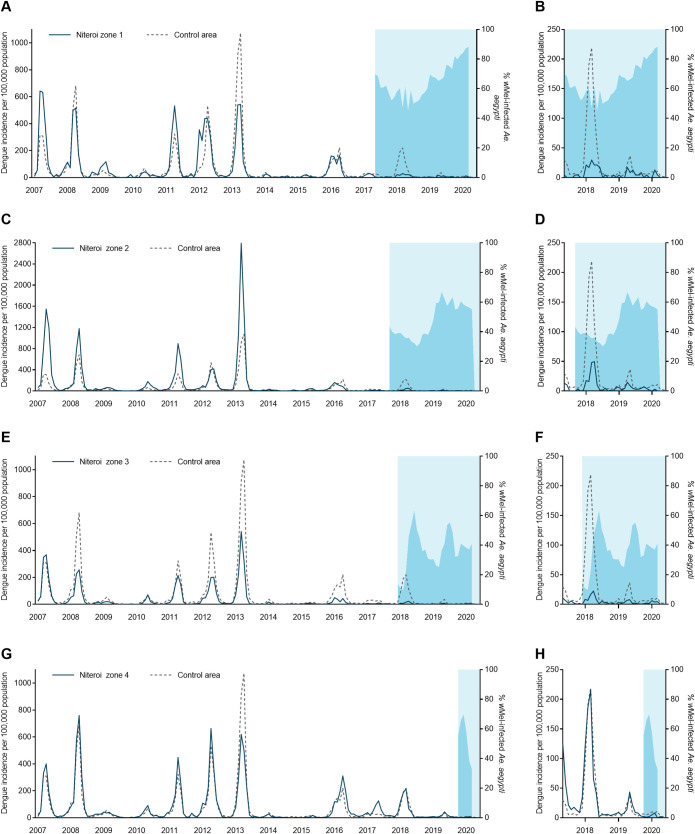
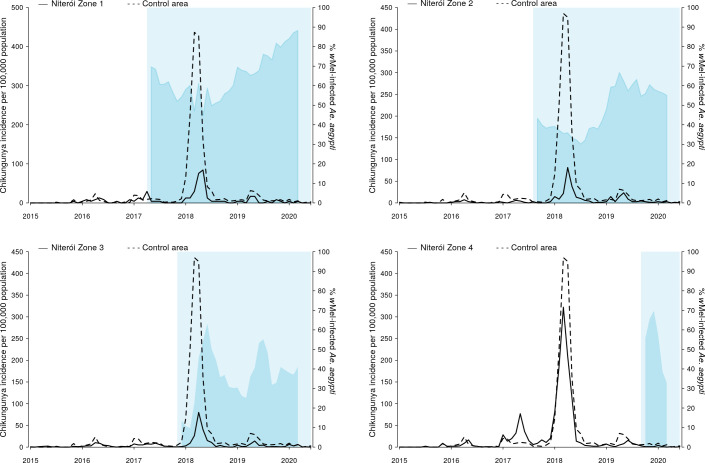
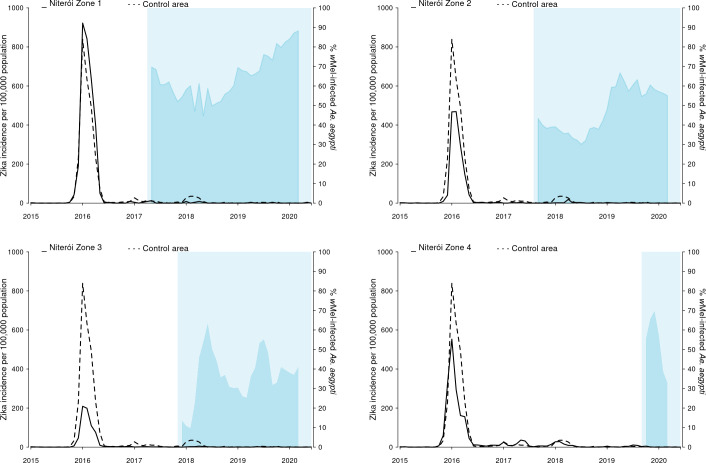
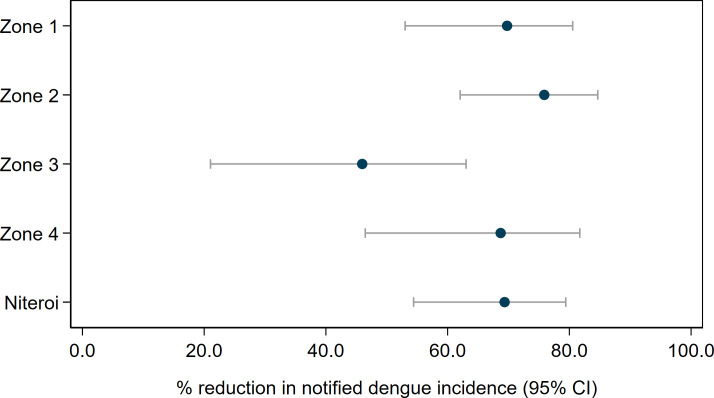
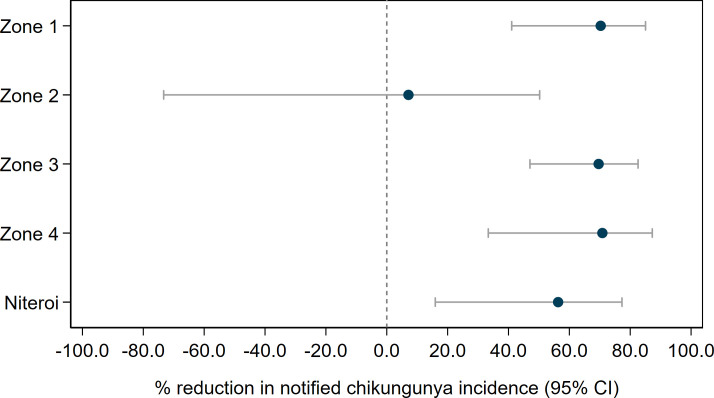
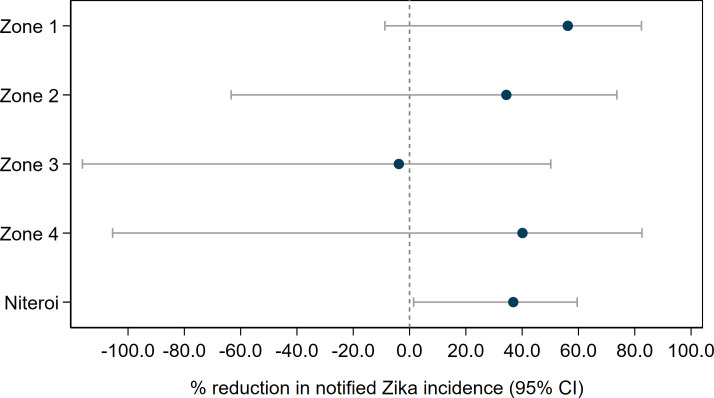
Methodology/principal findings: Following pilot releases in 2015-2016 and a period of intensive community engagement, deployments of adult wMel-infected Ae. aegypti mosquitoes were conducted in Niterói, Brazil during 2017-2019. Deployments were phased across four release zones, with a total area of 83 km2 and a residential population of approximately 373,000. A quasi-experimental design was used to evaluate the effectiveness of wMel deployments in reducing dengue, chikungunya and Zika incidence. An untreated control zone was pre-defined, which was comparable to the intervention area in historical dengue trends. The wMel intervention effect was estimated by controlled interrupted time series analysis of monthly dengue, chikungunya and Zika case notifications to the public health surveillance system before, during and after releases, from release zones and the control zone. Three years after commencement of releases, wMel introgression into local Ae. aegypti populations was heterogeneous throughout Niterói, reaching a high prevalence (>80%) in the earliest release zone, and more moderate levels (prevalence 40-70%) elsewhere. Despite this spatial heterogeneity in entomological outcomes, the wMel intervention was associated with a 69% reduction in dengue incidence (95% confidence interval 54%, 79%), a 56% reduction in chikungunya incidence (95%CI 16%, 77%) and a 37% reduction in Zika incidence (95%CI 1%, 60%), in the aggregate release area compared with the pre-defined control area. This significant intervention effect on dengue was replicated across all four release zones, and in three of four zones for chikungunya, though not in individual release zones for Zika.

Conclusions/significance: We demonstrate that wMel Wolbachia can be successfully introgressed into Ae. aegypti populations in a large and complex urban setting, and that a significant public health benefit from reduced incidence of Aedes-borne disease accrues even where the prevalence of wMel in local mosquito populations is moderate and spatially heterogeneous. These findings are consistent with the results of randomised and non-randomised field trials in Indonesia and northern Australia, and are supportive of the Wolbachia biocontrol method as a multivalent intervention against dengue, chikungunya and Zika.


Conflict of interest statement

The authors have declared that no competing interest exist.

Figures

Fig 1
Fig 1. Study site map showing the municipality of Niterói, comprising four zones in which releases of wMel-infected Aedes aegypti have been undertaken and one pre-defined parallel untreated control zone.
Neighbourhood boundaries are shown in white. The inset shows the location of Niterói within the state of Rio de Janeiro, Brazil. Maps were generated in ArcGIS 10.7 (Esri, Redlands, CA, USA) using administrative boundaries freely available from the Brazilian Institute of Geography and Statistics (IBGE).
Fig 2
Fig 2. wMel infection prevalence in Aedes aegypti mosquitoes collected from each release zone, during and after releases.
Circle markers represent the aggregate wMel infection prevalence in each zone in each calendar month from January 2017 to March 2020. Open circles indicate months when Wolbachia releases took place in any part of that zone; filled circles are months with no releases. Horizontal lines represent the median wMel infection rate among the individual neighbourhoods in each zone (n = 4 neighbourhoods in zone 1; n = 11 in zone 2; n = 13 in zone 3; n = 5 in zone 4). Shaded bars show the interquartile range (IQR) of wMel infection rates among the individual neighbourhoods in each zone, each month. Note that in January and February 2017, the only BG traps in Zone 1 were in the Jurujuba pilot release area where releases and monitoring had been ongoing throughout 2015–2016 [20]; BG monitoring in March-April 2017 had commenced in 2/4 neighbourhoods and from May 2017 in all 4 zone 1 neighbourhoods. In zone 2, BG monitoring in July-Sept 2017 had commenced in 7/11 neighbourhoods and from Oct 2017 in all 11 neighbourhoods. In zone 3 and zone 4, BG monitoring commenced in all neighbourhoods from Dec 2017 and Oct 2019, respectively.
Fig 3
Fig 3. Dengue, chikungunya and Zika time series and seasonality in Niterói.
Monthly dengue (A), chikungunya (B) and Zika (C) case notifications in Niterói from January 2007 (dengue) or January 2015 (chikungunya/Zika) to June 2020, and dengue (D), chikungunya (E) and Zika (F) case notifications aggregated by calendar month, across the same period.
Fig 4
Fig 4. Dengue incidence and wMel infection prevalence in local Aedes aegypti mosquito populations, by release zone.
Panels A,C,E,G: Lines show the monthly incidence of dengue case notifications per 100,000 population (left-hand Y axis) in Niterói release zones 1–4 (solid line in each panel) compared with the untreated control zone (dashed line), January 2007—June 2020. Light blue shading indicates the beginning of the epidemiological monitoring period in each zone, one month after initial releases were completed in each respective zone. Darker blue shading indicates the aggregate wMel infection prevalence (right-hand Y axis) in each zone in each calendar month from the start of the epidemiological monitoring period until March 2020 (no wMel monitoring April—June 2020). Panels B,D,F,H show the same data but zoomed into the period from May 2017 –March 2020 and with the dengue incidence axis rescaled, to show more clearly the trends in release and control zones in the post-intervention period.
Fig 5
Fig 5. Chikungunya incidence and wMel infection prevalence in local Aedes aegypti mosquito populations, by release zone.
Lines show the monthly incidence of chikungunya case notifications per 100,000 population (left-hand Y axis) in Niterói release zones 1–4 (solid line in each panel) compared with the untreated control zone (dashed line), January 2015—June 2020. Light blue shading indicates the beginning of the epidemiological monitoring period in each zone, one month after initial releases were completed in each respective zone. Darker blue shading indicates the aggregate wMel infection prevalence (right-hand Y axis) in each zone in each calendar month from the start of the epidemiological monitoring period until March 2020 (no wMel monitoring April—June 2020).
Fig 6
Fig 6. Zika incidence and wMel infection prevalence in local Aedes aegypti mosquito populations, by release zone.
Lines show the monthly incidence of Zika case notifications per 100,000 population (left-hand Y axis) in Niterói release zones 1–4 (solid line in each panel) compared with the untreated control zone (dashed line), January 2015—June 2020. Light blue shading indicates the beginning of the epidemiological monitoring period in each zone, one month after initial releases were completed in each respective zone. Darker blue shading indicates the aggregate wMel infection prevalence (right-hand Y axis) in each zone in each calendar month from the start of the epidemiological monitoring period until March 2020 (no wMel monitoring April—June 2020).
Fig 7
Fig 7. Estimated reduction in the incidence of dengue following Wolbachia deployments in Niterói, in each release zone individually and in the aggregate release area.
Point estimates (circles) and 95% confidence intervals (horizontal bars) from controlled interrupted time series analysis of monthly dengue case notifications to the Brazilian national disease surveillance system (Jan 2007 –June 2020).
Fig 8
Fig 8. Estimated reduction in the incidence of chikungunya following Wolbachia deployments in Niterói, in each release zone individually and in the aggregate release area.
Point estimates (circles) and 95% confidence intervals (horizontal bars) from controlled interrupted time series analysis of monthly chikungunya case notifications to the Brazilian national disease surveillance system (Jan 2015 –June 2020).
Fig 9
Fig 9. Estimated reduction in the incidence of Zika following Wolbachia deployments in Niterói, in each release zone individually and in the aggregate release area.
Point estimates (circles) and 95% confidence intervals (horizontal bars) from controlled interrupted time series analysis of monthly Zika case notifications to the Brazilian national disease surveillance system (Jan 2015 –June 2020).

References

    1. Cattarino L, Rodriguez-Barraquer I, Imai N, Cummings DAT, Ferguson NM. Mapping global variation in dengue transmission intensity. Sci Transl Med. 2020; 12(528). doi: 10.1126/scitranslmed.aax4144 - DOI - PubMed
    1. Stanaway JD, Shepard DS, Undurraga EA, Halasa YA, Coffeng LE, Brady OJ, et al.. The global burden of dengue: an analysis from the Global Burden of Disease Study 2013. Lancet Infect Dis. 2016;16(6):712–23. doi: 10.1016/S1473-3099(16)00026-8 - DOI - PMC - PubMed
    1. Shepard DS, Undurraga EA, Halasa YA, Stanaway JD. The global economic burden of dengue: a systematic analysis. Lancet Infect Dis. 2016;16(8):935–41. doi: 10.1016/S1473-3099(16)00146-8 - DOI - PubMed
    1. Bowman LR, Donegan S, McCall PJ. Is dengue vector control deficient in effectiveness or evidence?: systematic review and meta-analysis. PLoS Negl Trop Dis. 2016;10(3):e0004551. doi: 10.1371/journal.pntd.0004551 - DOI - PMC - PubMed
    1. Sim S, Ng LC, Lindsay SW, Wilson AL. A greener vision for vector control: The example of the Singapore dengue control programme. PLoS Negl Trop Dis. 2020;14(8):e0008428. doi: 10.1371/journal.pntd.0008428 - DOI - PMC - PubMed

Publication types

MeSH terms