

Genomics-informed responses in the elimination of COVID-19 in Victoria, Australia: an observational, genomic epidemiological study
- PMID: 34252365
- PMCID: PMC8270762
- DOI: 10.1016/S2468-2667(21)00133-X
Genomics-informed responses in the elimination of COVID-19 in Victoria, Australia: an observational, genomic epidemiological study
Erratum in
-
Correction to Lancet Public Health 2021; 6: e547-56.Lancet Public Health. 2021 Oct;6(10):e708. doi: 10.1016/S2468-2667(21)00214-0. Lancet Public Health. 2021. PMID: 34563280 Free PMC article. No abstract available.
Abstract
Background: A cornerstone of Australia's ability to control COVID-19 has been effective border control with an extensive supervised quarantine programme. However, a rapid recrudescence of COVID-19 was observed in the state of Victoria in June, 2020. We aim to describe the genomic findings that located the source of this second wave and show the role of genomic epidemiology in the successful elimination of COVID-19 for a second time in Australia.
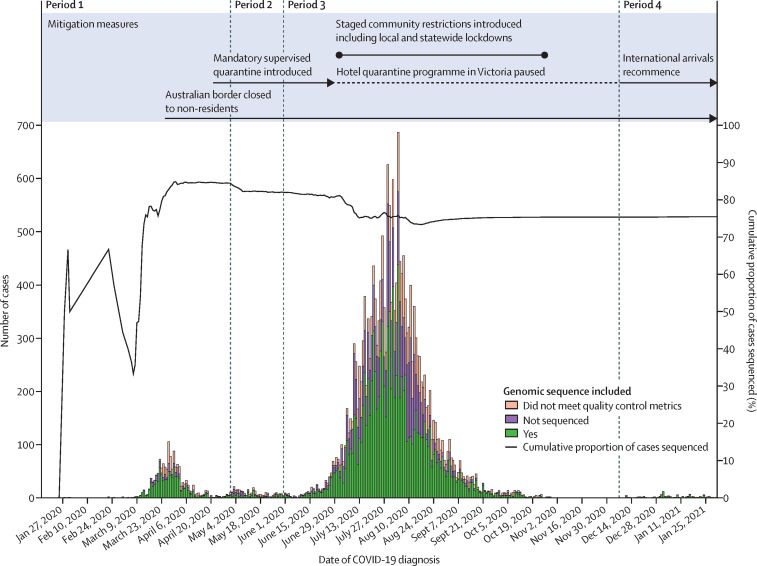
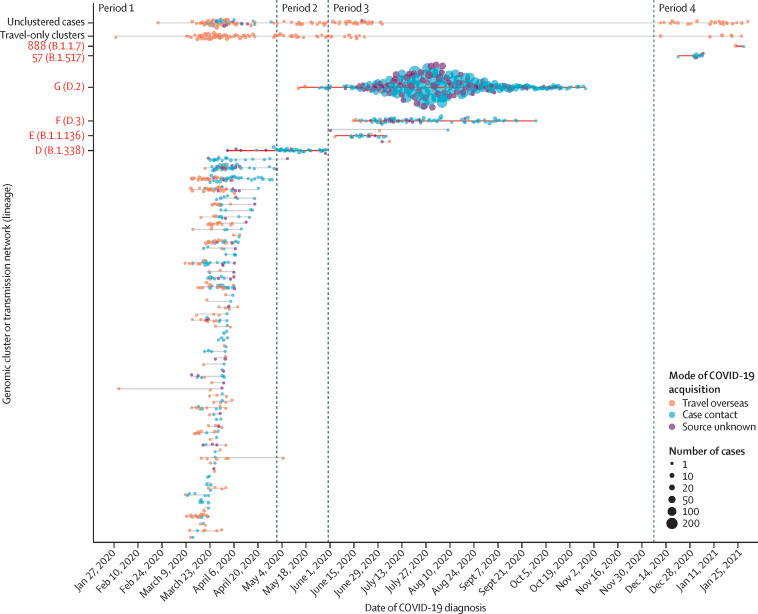
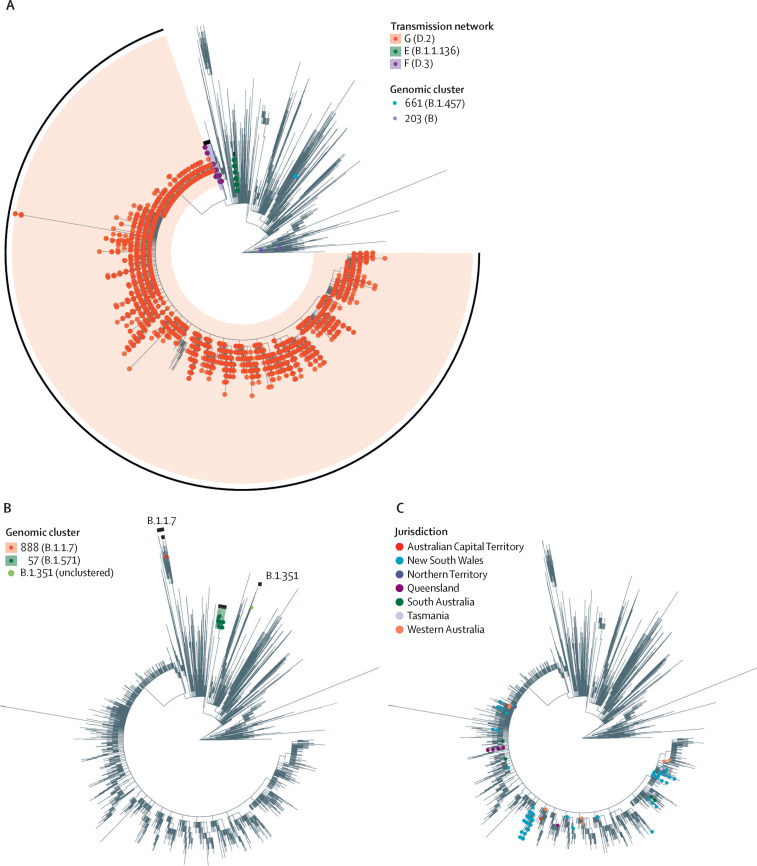
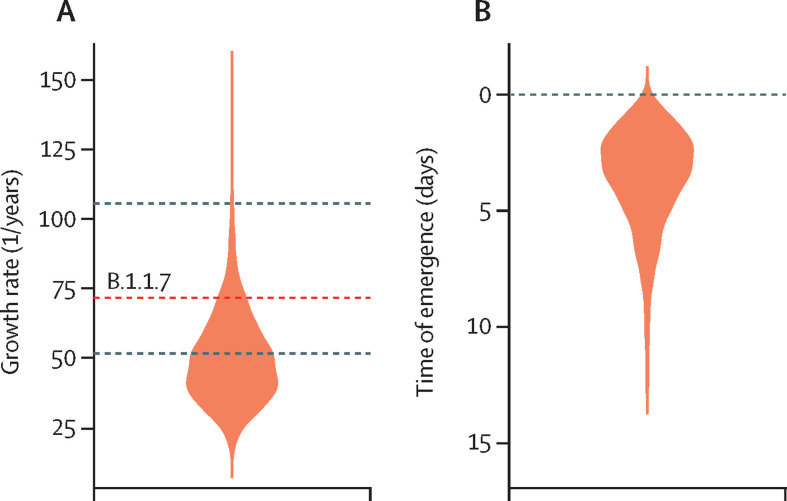
Methods: In this observational, genomic epidemiological study, we did genomic sequencing of all laboratory-confirmed cases of COVID-19 diagnosed in Victoria, Australia between Jan 25, 2020, and Jan 31, 2021. We did phylogenetic analyses, genomic cluster discovery, and integrated results with epidemiological data (detailed information on demographics, risk factors, and exposure) collected via interview by the Victorian Government Department of Health. Genomic transmission networks were used to group multiple genomic clusters when epidemiological and genomic data suggested they arose from a single importation event and diversified within Victoria. To identify transmission of emergent lineages between Victoria and other states or territories in Australia, all publicly available SARS-CoV-2 sequences uploaded before Feb 11, 2021, were obtained from the national sequence sharing programme AusTrakka, and epidemiological data were obtained from the submitting laboratories. We did phylodynamic analyses to estimate the growth rate, doubling time, and number of days from the first local infection to the collection of the first sequenced genome for the dominant local cluster, and compared our growth estimates to previously published estimates from a similar growth phase of lineage B.1.1.7 (also known as the Alpha variant) in the UK.
Findings: Between Jan 25, 2020, and Jan 31, 2021, there were 20 451 laboratory-confirmed cases of COVID-19 in Victoria, Australia, of which 15 431 were submitted for sequencing, and 11 711 met all quality control metrics and were included in our analysis. We identified 595 genomic clusters, with a median of five cases per cluster (IQR 2-11). Overall, samples from 11 503 (98·2%) of 11 711 cases clustered with another sample in Victoria, either within a genomic cluster or transmission network. Genomic analysis revealed that 10 426 cases, including 10 416 (98·4%) of 10 584 locally acquired cases, diagnosed during the second wave (between June and October, 2020) were derived from a single incursion from hotel quarantine, with the outbreak lineage (transmission network G, lineage D.2) rapidly detected in other Australian states and territories. Phylodynamic analyses indicated that the epidemic growth rate of the outbreak lineage in Victoria during the initial growth phase (samples collected between June 4 and July 9, 2020; 47·4 putative transmission events, per branch, per year [1/years; 95% credible interval 26·0-85·0]), was similar to that of other reported variants, such as B.1.1.7 in the UK (mean approximately 71·5 1/years). Strict interventions were implemented, and the outbreak lineage has not been detected in Australia since Oct 29, 2020. Subsequent cases represented independent international or interstate introductions, with limited local spread.
Interpretation: Our study highlights how rapid escalation of clonal outbreaks can occur from a single incursion. However, strict quarantine measures and decisive public health responses to emergent cases are effective, even with high epidemic growth rates. Real-time genomic surveillance can alter the way in which public health agencies view and respond to COVID-19 outbreaks.
Funding: The Victorian Government, the National Health and Medical Research Council Australia, and the Medical Research Future Fund.
Copyright © 2021 The Author(s). Published by Elsevier Ltd. This is an Open Access article under the CC BY-NC-ND 4.0 license. Published by Elsevier Ltd.. All rights reserved.
Conflict of interest statement
Declaration of interests All authors declare no competing interests.
Figures
References
-
- Munnink BBO, Nieuwenhuijse DF, Stein M, et al. Rapid SARS-CoV-2 whole-genome sequencing and analysis for informed public health decision-making in the Netherlands. Nat Med. 2020;26:1405–1410. - PubMed
Publication types
MeSH terms
LinkOut - more resources
Full Text Sources
Medical
Miscellaneous
