

Difference in mortality among individuals admitted to hospital with COVID-19 during the first and second waves in South Africa: a cohort study
- PMID: 34252381
- PMCID: PMC8270522
- DOI: 10.1016/S2214-109X(21)00289-8
Difference in mortality among individuals admitted to hospital with COVID-19 during the first and second waves in South Africa: a cohort study
Abstract
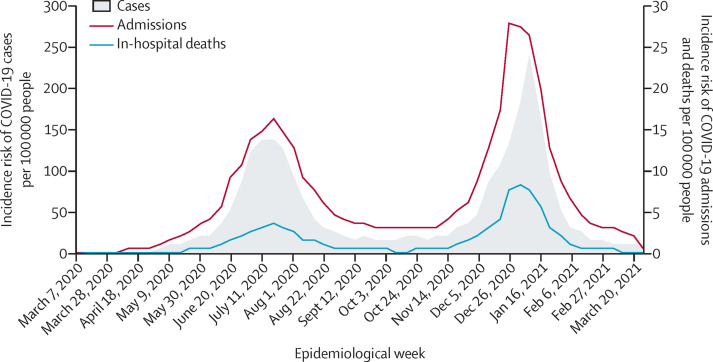
Background: The first wave of COVID-19 in South Africa peaked in July, 2020, and a larger second wave peaked in January, 2021, in which the SARS-CoV-2 501Y.V2 (Beta) lineage predominated. We aimed to compare in-hospital mortality and other patient characteristics between the first and second waves.
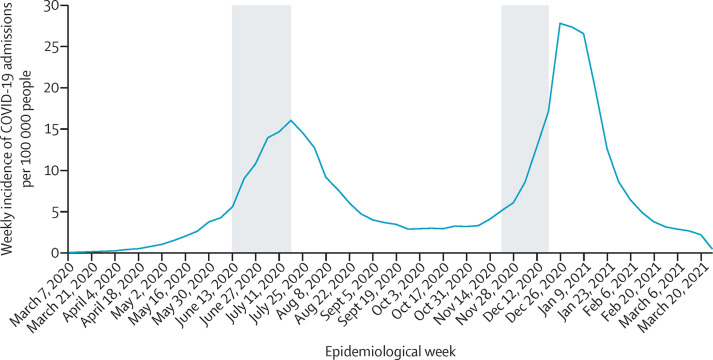
Methods: In this prospective cohort study, we analysed data from the DATCOV national active surveillance system for COVID-19 admissions to hospital from March 5, 2020, to March 27, 2021. The system contained data from all hospitals in South Africa that have admitted a patient with COVID-19. We used incidence risk for admission to hospital and determined cutoff dates to define five wave periods: pre-wave 1, wave 1, post-wave 1, wave 2, and post-wave 2. We compared the characteristics of patients with COVID-19 who were admitted to hospital in wave 1 and wave 2, and risk factors for in-hospital mortality accounting for wave period using random-effect multivariable logistic regression.
Findings: Peak rates of COVID-19 cases, admissions, and in-hospital deaths in the second wave exceeded rates in the first wave: COVID-19 cases, 240·4 cases per 100 000 people vs 136·0 cases per 100 000 people; admissions, 27·9 admissions per 100 000 people vs 16·1 admissions per 100 000 people; deaths, 8·3 deaths per 100 000 people vs 3·6 deaths per 100 000 people. The weekly average growth rate in hospital admissions was 20% in wave 1 and 43% in wave 2 (ratio of growth rate in wave 2 compared with wave 1 was 1·19, 95% CI 1·18-1·20). Compared with the first wave, individuals admitted to hospital in the second wave were more likely to be age 40-64 years (adjusted odds ratio [aOR] 1·22, 95% CI 1·14-1·31), and older than 65 years (aOR 1·38, 1·25-1·52), compared with younger than 40 years; of Mixed race (aOR 1·21, 1·06-1·38) compared with White race; and admitted in the public sector (aOR 1·65, 1·41-1·92); and less likely to be Black (aOR 0·53, 0·47-0·60) and Indian (aOR 0·77, 0·66-0·91), compared with White; and have a comorbid condition (aOR 0·60, 0·55-0·67). For multivariable analysis, after adjusting for weekly COVID-19 hospital admissions, there was a 31% increased risk of in-hospital mortality in the second wave (aOR 1·31, 95% CI 1·28-1·35). In-hospital case-fatality risk increased from 17·7% in weeks of low admission (<3500 admissions) to 26·9% in weeks of very high admission (>8000 admissions; aOR 1·24, 1·17-1·32).
Interpretation: In South Africa, the second wave was associated with higher incidence of COVID-19, more rapid increase in admissions to hospital, and increased in-hospital mortality. Although some of the increased mortality can be explained by admissions in the second wave being more likely in older individuals, in the public sector, and by the increased health system pressure, a residual increase in mortality of patients admitted to hospital could be related to the new Beta lineage.
Funding: DATCOV as a national surveillance system is funded by the National Institute for Communicable Diseases and the South African National Government.
Copyright © 2021 The Author(s). Published by Elsevier Ltd. This is an Open Access article under the CC BY-NC-ND 4.0 license. Published by Elsevier Ltd.. All rights reserved.
Conflict of interest statement
Declaration of interests We declare no competing interests.
Figures

Comment in
-
Lessons from two SARS-CoV-2 waves in South Africa.Lancet Glob Health. 2021 Sep;9(9):e1177-e1178. doi: 10.1016/S2214-109X(21)00313-2. Epub 2021 Jul 9. Lancet Glob Health. 2021. PMID: 34252380 Free PMC article. No abstract available.
References
-
- Africa Center for Strategic Studies Analyzing Africa's second wave of COVID-19. 2021. http://africacenter.org/spotlight/analyzing-africas-second-wave-of-covid...
-
- Statistics South Africa SADHS: South African Demographic and Health Survey 2016: Key Indicator Report. 2016. https://www.statssa.gov.za/publications/Report%2003-00-09/Report%2003-00...
-
- UNAIDS Country Factsheet South Africa. 2019. https://www.unaids.org/en/regionscountries/countries/southafrica
-
- WHO . World Health Organization; Geneva: 2019. Global tuberculosis report.
-
- Maluleke R. Statistics South Africa; Pretoria: 2019. Inequality trends in South Africa. A multidimensional diagnostic of inequality.
Publication types
MeSH terms
LinkOut - more resources
Full Text Sources
Medical
Miscellaneous
