. 2021 Jul 12;25(1):243.
doi: 10.1186/s13054-021-03682-7.

Individualized resuscitation strategy for septic shock formalized by finite mixture modeling and dynamic treatment regimen

Affiliations

Individualized resuscitation strategy for septic shock formalized by finite mixture modeling and dynamic treatment regimen

Penglin Ma et al. Crit Care. .

Abstract

Background: Septic shock comprises a heterogeneous population, and individualized resuscitation strategy is of vital importance. The study aimed to identify subclasses of septic shock with non-supervised learning algorithms, so as to tailor resuscitation strategy for each class.

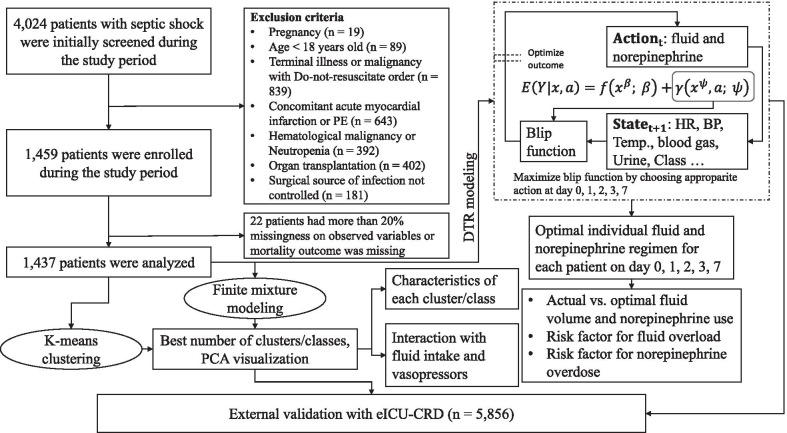
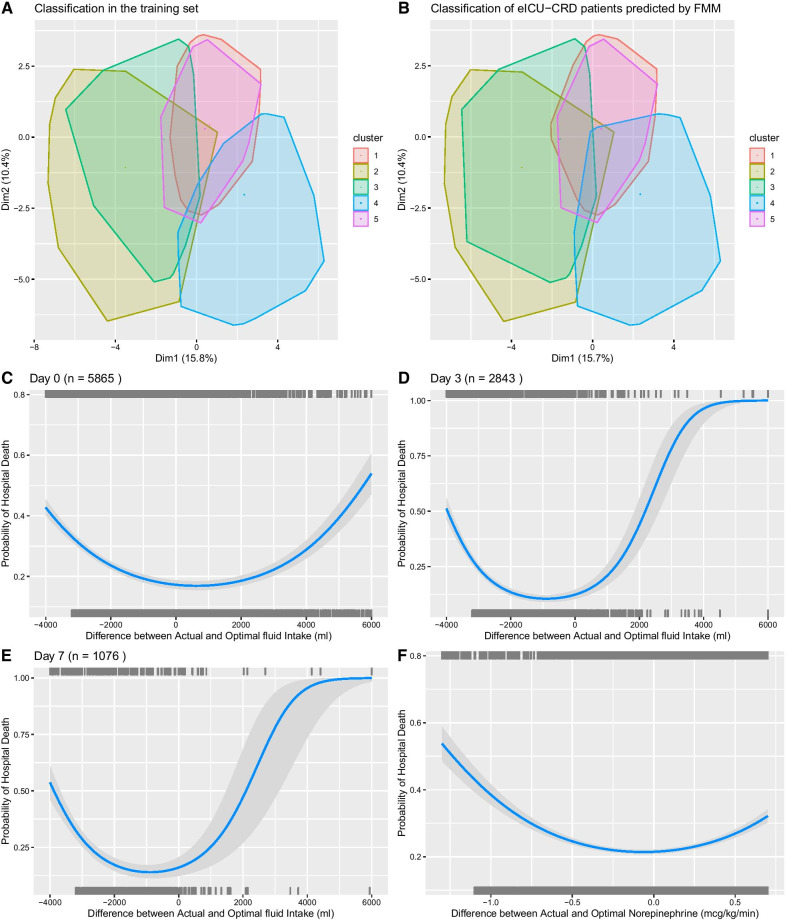
Methods: Patients with septic shock in 25 tertiary care teaching hospitals in China from January 2016 to December 2017 were enrolled in the study. Clinical and laboratory variables were collected on days 0, 1, 2, 3 and 7 after ICU admission. Subclasses of septic shock were identified by both finite mixture modeling and K-means clustering. Individualized fluid volume and norepinephrine dose were estimated using dynamic treatment regime (DTR) model to optimize the final mortality outcome. DTR models were validated in the eICU Collaborative Research Database (eICU-CRD) dataset.

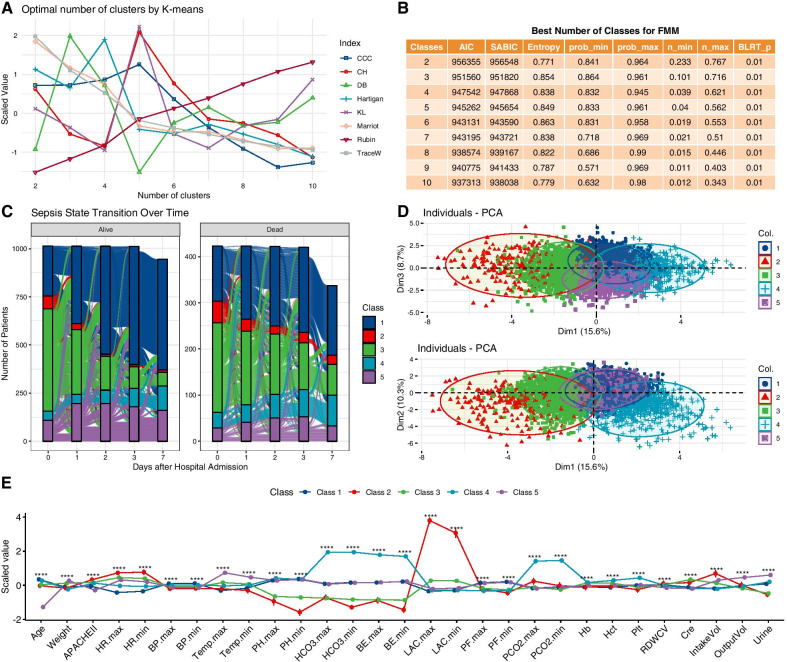
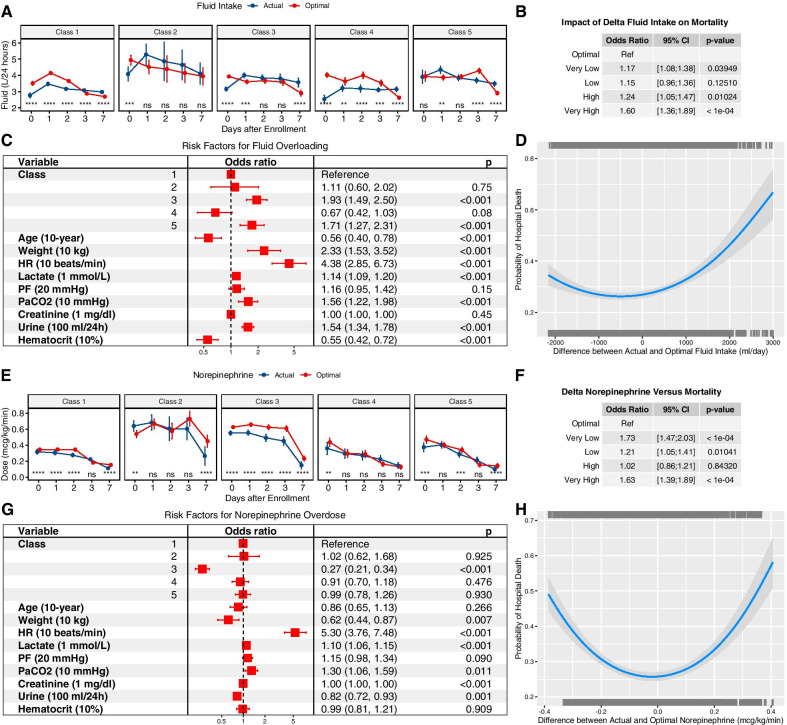
Results: A total of 1437 patients with a mortality rate of 29% were included for analysis. The finite mixture modeling and K-means clustering robustly identified five classes of septic shock. Class 1 (baseline class) accounted for the majority of patients over all days; class 2 (critical class) had the highest severity of illness; class 3 (renal dysfunction) was characterized by renal dysfunction; class 4 (respiratory failure class) was characterized by respiratory failure; and class 5 (mild class) was characterized by the lowest mortality rate (21%). The optimal fluid infusion followed the resuscitation/de-resuscitation phases with initial large volume infusion and late restricted volume infusion. While class 1 transitioned to de-resuscitation phase on day 3, class 3 transitioned on day 1. Classes 1 and 3 might benefit from early use of norepinephrine, and class 2 can benefit from delayed use of norepinephrine while waiting for adequate fluid infusion.

Conclusions: Septic shock comprises a heterogeneous population that can be robustly classified into five phenotypes. These classes can be easily identified with routine clinical variables and can help to tailor resuscitation strategy in the context of precise medicine.

Keywords: Dynamic treatment regime; Fluid resuscitation; Mortality; Sepsis.


Conflict of interest statement

The authors declare that they have no competing interests.

Figures

Fig. 1
Fig. 1
Flowchart of patient enrollment and schematic illustration of analysis workflow. A total of 1437 septic shock patients were analyzed. The first step is to identify classes of septic shock by both finite mixture modeling and K-means clustering. Clinical characteristics of each class were compared. Interaction between class membership and fluid volume or epinephrine dose was explored in a multivariable Cox model with time-varying covariates. A significant effect of interaction means different therapeutic effects across classes. Another thread of our analysis is to estimate optimal fluid volume and norepinephrine dose using dynamic treatment regimen. The key of the modeling is to construct a blip function that can help to tailor optimal dosing strategy based on current patient status and historical response to the intervention. It returns a sequential decision policy to optimize the final outcome. The optimal fluid volume or epinephrine dose was then compared with the actual strategy, and relevant risk factors can be explored for fluid overload or norepinephrine overdosing
Fig. 2
Fig. 2
Classes of septic shock. A Optimal number of clusters by K-means clustering. The statistics were scaled for better visualization. Statistics such as CCC, CH and KL showed the highest value for five clusters; lower value of DB indicates better fit which also supports the existence of five clusters. Some statistics utilize elbow point to identify the best number of clusters such as Hartigan, Marriot and TraceW. These statistics consistently indicated an elbow joint at 5-class. B Metrics for choosing the best number of classes for FMM. C Class membership transition over days 0, 1, 2, 3 and 7. It is noted that most patients in class 2 (critical class) on day 0 would transition to other classes, indicating improvement in these critical cases. Patients who transitioned to class 2 were more likely to die. D PCA showing that the five classes can be visually separated by the first three principal components. One point represents one sample (one data point per patient day). E Characteristics of the five classes identified by FMM. All numeric values were scaled (i.e., centered on mean and divided by standard deviation) for better visualization on the vertical axis. Seventeen variables were used for FMM training, but 29 variables are displayed to give a comprehensive clinical characteristics for these classes. Class 1 is the largest class over all study days with all variables in average value (the baseline class). Class 2 is characterized by poor tissue perfusion and multiple organ failure and can be called the critical class. Class 3 is characterized by highest serum creatinine and metabolic acidosis and can be called renal dysfunction class. Class 4 is characterized by the highest PaCO2 (60; IQR 50–77 mmHg) and low PF ratio (169; IQR 118–232 mmHg) and can be designated as respiratory failure class. Class 5 is characterized by young age, low mortality and well-preserved renal function and can be considered as the mild class. FMM finite mixture modeling, CCC cubic clustering criterion, CH Calinski and Harabasz index, DB Davies and Bouldin index, KL Krzanowski and Lai index. ****< 0.001
Fig. 3
Fig. 3
Multivariable Cox regression model with time-varying covariates. Relative hazard could be varying over time and our model reported the average value for a given dose. A Fluid volume and risk of mortality stratified by class membership. More fluid administration was associated with reduced risk of mortality in class 2 (Critical class). B Daily maximum dose of norepinephrine and hazard ratio. While more norepinephrine was associated with increased risk of mortality in overall population, greater dose of norepinephrine was associated with reduced risk of mortality in class 3 (respiratory failure class). The gray area indicates the 95% confidence interval, and the small bars on horizontal axis indicate sample points. C Multivariable regression model showed significant interaction between class membership and fluid volume. There was significant interaction between fluid intake and class 2 (critical class) membership (HR 0.81; 95% CI 0.69–0.95). D Larger dose of norepinephrine was associated with increased instantaneous hazard in the main effect (HR 3.17; 95% CI 2.06–4.89). There was significant interaction between class 3 and norepinephrine dose (HR for interaction: 0.28; 95% CI 0.14–0.58; p < 0.001). HRs for comorbidities were reported with the None comorbidity as reference. HR hazard ratio, CI confidence interval, CRF chronic renal failure, CAD coronary artery diseases, NorepiEq norepinephrine equivalence dose in mcg/kg/min, Cre creatinine in mg/dl, APACHEII Acute Physiology and Chronic Health Evaluation II, Intake Vol daily intake volume in liters
Fig. 4
Fig. 4
Optimal resuscitation strategy estimated by DTR. A Comparisons between actual and optimal fluid volume over days. The optimal fluid strategy is consistent with the concept of resuscitation/de-resuscitation model, especially in class 1 (baseline class) and class 3 (renal dysfunction class). However, class 3 showed earlier de-resuscitation than class 1 (day 1 vs. 3). More fluid could be given on day 0 for classes 1 to 4, indicating that initial resuscitation was usually inadequate in clinical practice. B Impact of delta fluid intake on mortality estimated by a logistic regression model fitting on validation set. Delta fluid intake was calculated as the difference between actual and optimal fluid intake at patient day level and was categorized into five levels: very low (<−1000 mL), low (− 1000 to − 500 mL), optimal (− 500 to 500 mL), high (500 to 1000 mL) and very high (> 1000 mL). Odds ratio was reported by using optimal as reference. C Risk factors for fluid overloading. D DTR internal validation was performed by examining the relationship between delta fluid intake and mortality outcome. The trained DTR model estimated optimal fluid intake for each subject in the dataset from the Chinese multicenter cohort and a logistic regression model was trained by including a quadratic term for delta fluid intake. The parabolic curve indicates that the lowest mortality can be obtained at an optimal fluid strategy. E Comparisons between actual and optimal norepinephrine dose over days, stratified by class membership. The optimal dose was larger than the actual dose on day 0 for classes 1, 3, 4 and 5, indicating early initiation of norepinephrine could be beneficial for most classes. However, class 2 (critical class) showed lower/delayed initial dose would be beneficial. Combined with the result from fluid intake, it was deducible that initial large adequate fluid volume and delayed norepinephrine use were potentially beneficial for class 2. F Validation of the DTR model in the validation set by exploring the relative risk of mortality for different levels of delta norepinephrine dose. G Multivariable regression model exploring risk factors for norepinephrine overdose. H DTR model validation by examining the relationship between delta norepinephrine dose and mortality outcome
Fig. 5
Fig. 5
Risk factors for fluid and epinephrine overdosing explored using XGboost. Gradient color indicates the original value for that variable. Each point represents a row from the original dataset. A SHAP values of individual features in predicting the risk of fluid overloading (top 20 features are shown in the figure). ICU day was the most important variable predicting fluid overload. Patients in class 3 were more likely to receive fluid overload (the purple color indicates class 3 patients, and they contribute to increased risk of fluid overload as represented by the positive value on x-axis). B SHAP values of individual features in predicting the risk of norepinephrine overdosing (top 20 features are shown in the figure). Higher heart rate (purple color) was found to be associated with increased risk (positive SHAP value on x-axis) of norepinephrine overdosing
Fig. 6
Fig. 6
External validation in the eICU-CRD database. A Classification in the training dataset. The convex hulls of data points were assigned to the different clusters, and they were projected to two-dimensional space by principal component analysis. B Classification in the eICU-CRD dataset. The class membership of the new patients was determined by the highest probability predicted by the FMM. CE Relationship between the difference between actual and optimal fluid volume and hospital mortality rate. The models were trained with quadratic terms for the difference between actual and optimal fluid volume. F The relationship between hospital mortality and the difference between actual and optimal norepinephrine dose

References

    1. Seymour CW, Rosengart MR. Septic shock: advances in diagnosis and treatment. JAMA. 2015;314:708–717. doi: 10.1001/jama.2015.7885. - DOI - PMC - PubMed
    1. Yealy DM, Kellum JA, Huang DT, Barnato AE, Weissfeld LA, ProCESS Investigators et al. A randomized trial of protocol-based care for early septic shock. N Engl J Med. 2014;370:1683–1693. doi: 10.1056/NEJMoa1401602. - DOI - PMC - PubMed
    1. Ospina-Tascón GA, Damiani LP, Estenssoro E, Teboul J-L, Cecconi M, Jibaja M, et al. Effect of a resuscitation strategy targeting peripheral perfusion status vs serum lactate levels on 28-day mortality among patients with septic shock: the ANDROMEDA-SHOCK Randomized Clinical Trial. JAMA Am Med Assoc. 2019;321:654–664. doi: 10.1001/jama.2019.0071. - DOI - PMC - PubMed
    1. Dellinger RP, Levy MM, Carlet JM, Bion J, Parker MM, Jaeschke R, et al. Surviving Sepsis Campaign: international guidelines for management of severe sepsis and septic shock: 2008. Crit Care Med. 2008;36:296–327. doi: 10.1097/01.CCM.0000298158.12101.41. - DOI - PubMed
    1. Alhazzani W, Møller MH, Arabi YM, Loeb M, Gong MN, Fan E, et al. Surviving Sepsis Campaign: guidelines on the management of critically ill adults with Coronavirus Disease 2019 (COVID-19) Intensive Care Med. 2020;44:1691–1734. doi: 10.1007/s00134-018-5367-6. - DOI - PMC - PubMed

Publication types

MeSH terms

LinkOut - more resources