. 2021 Jul 13:10:e67635.
doi: 10.7554/eLife.67635.

Lives saved with vaccination for 10 pathogens across 112 countries in a pre-COVID-19 world

Affiliations

Lives saved with vaccination for 10 pathogens across 112 countries in a pre-COVID-19 world

Jaspreet Toor et al. Elife. .

Abstract

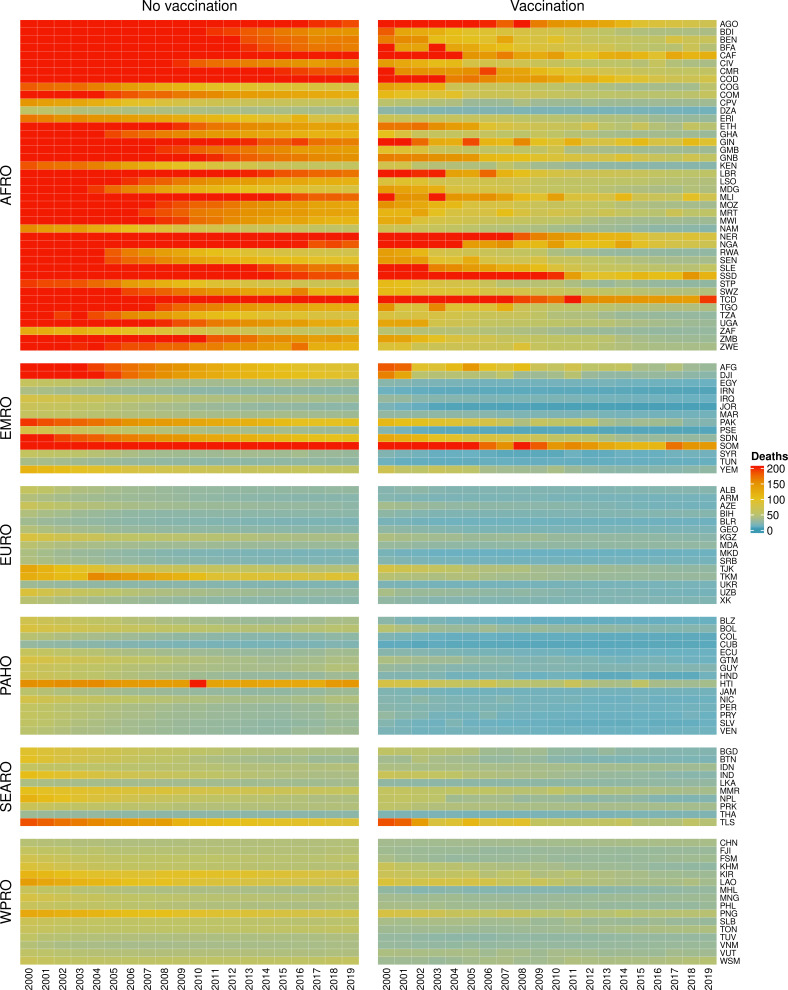
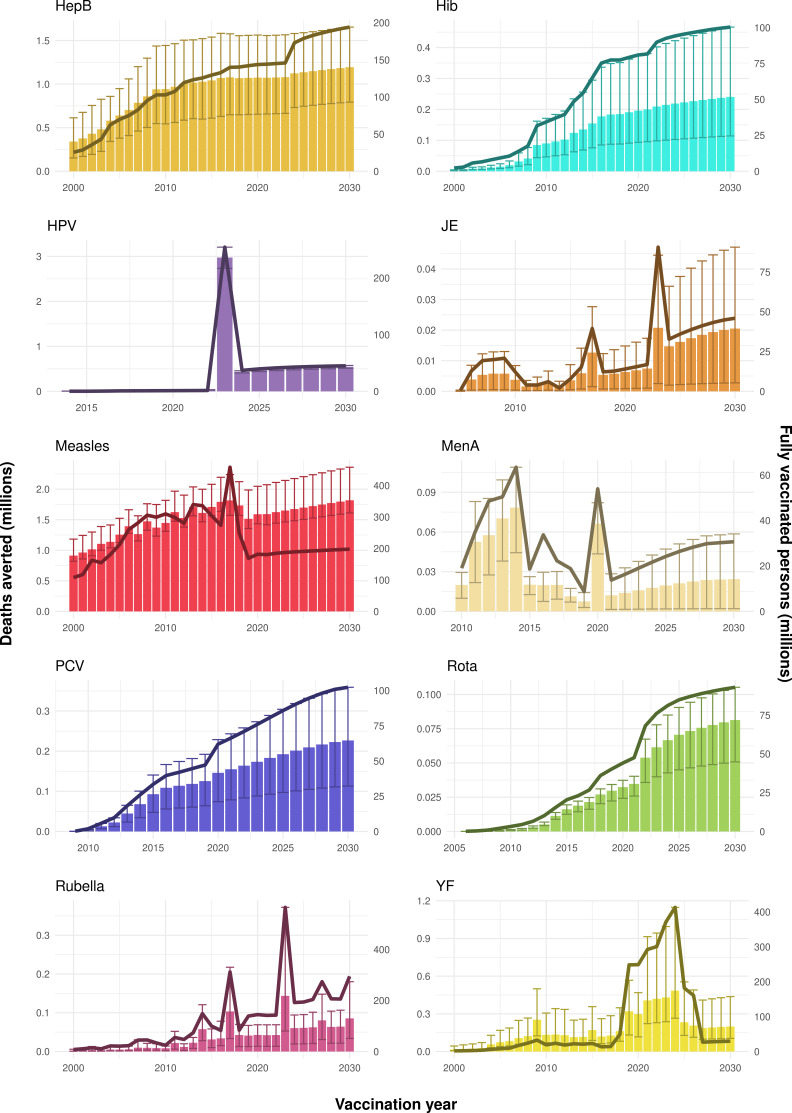
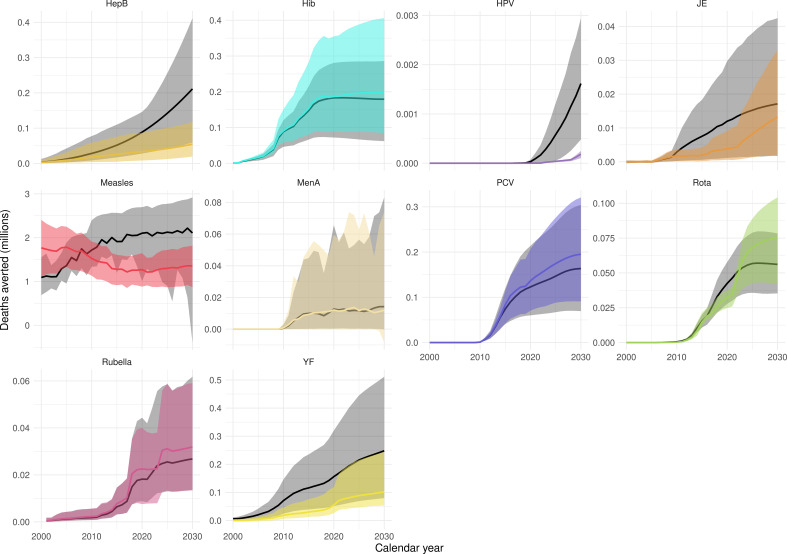
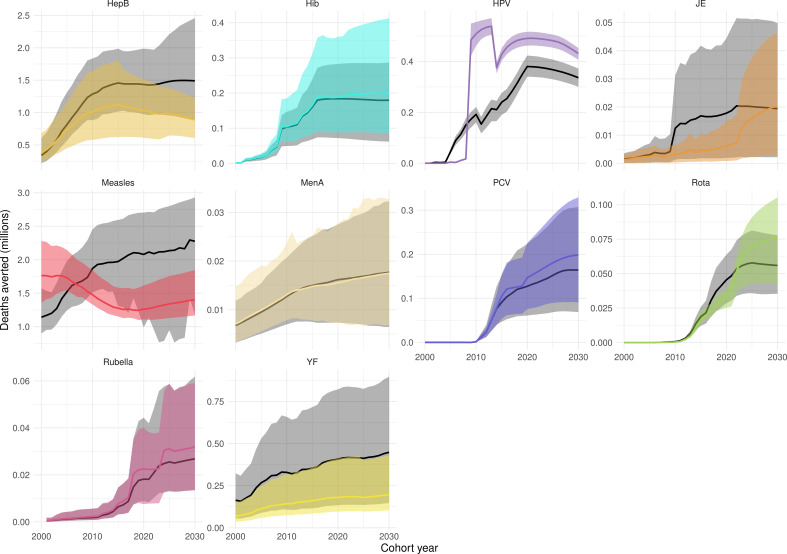
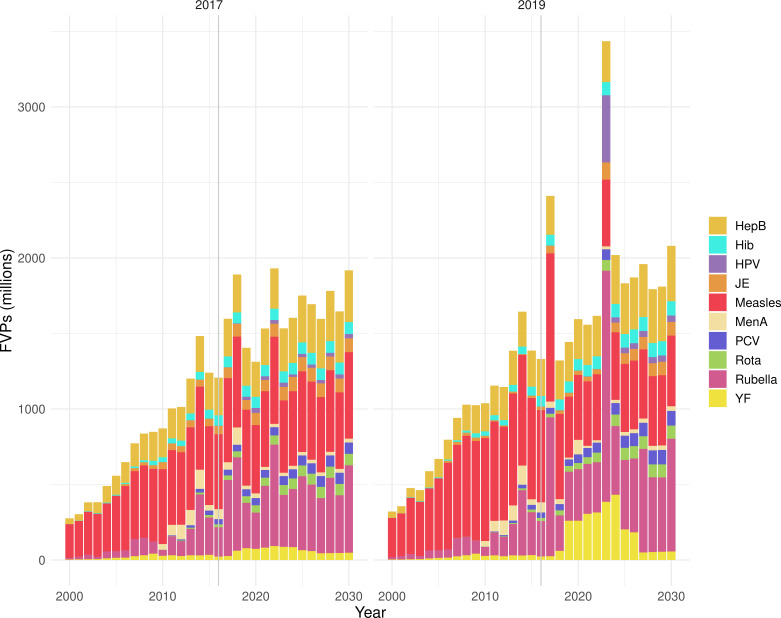
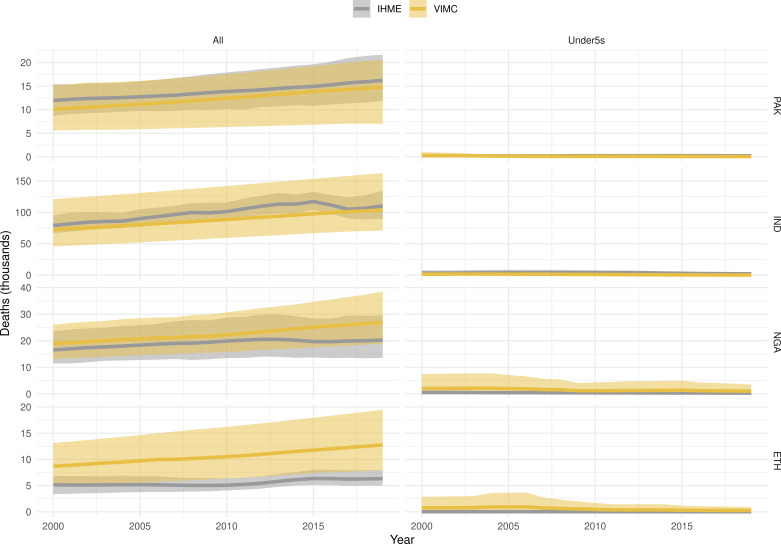
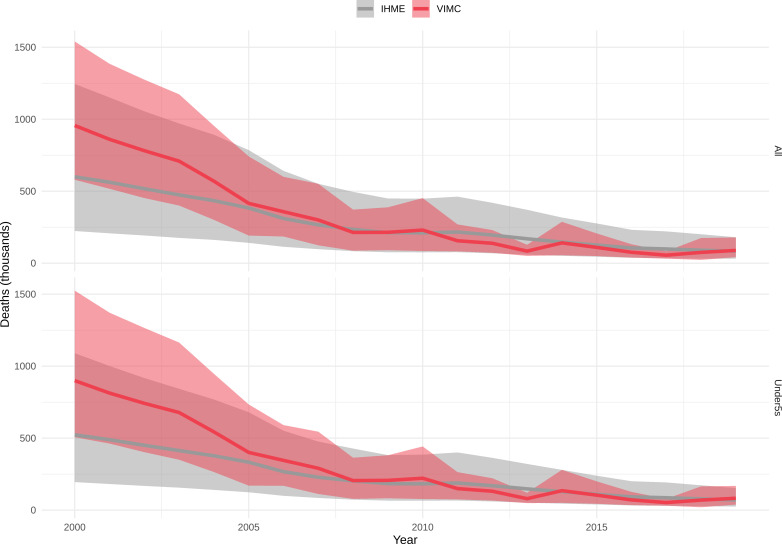
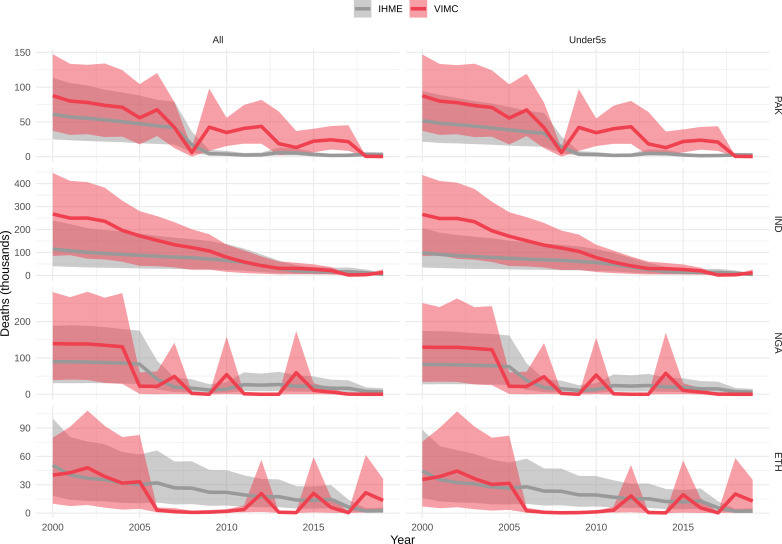
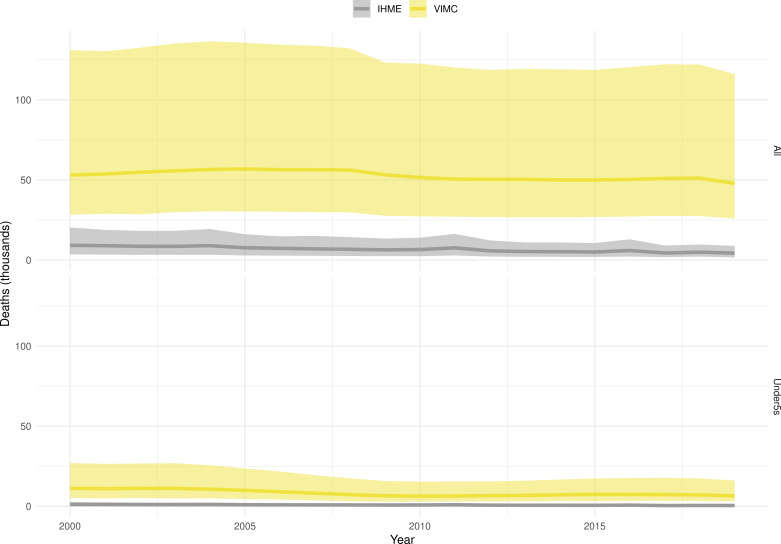
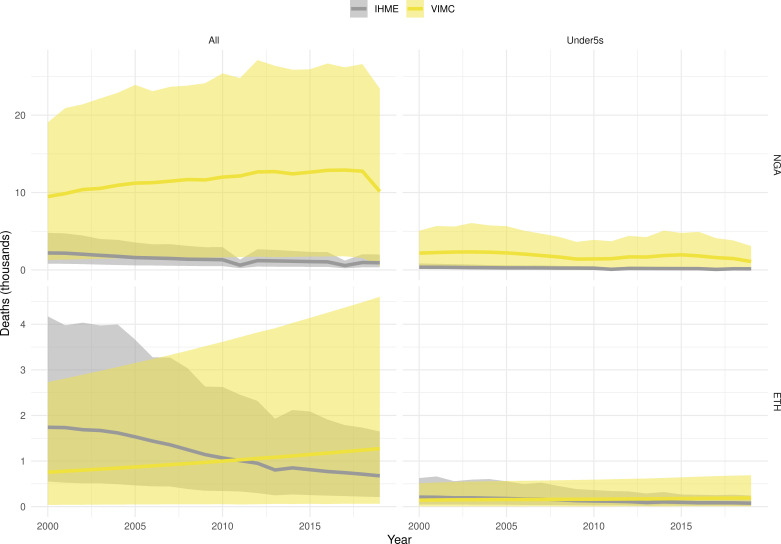
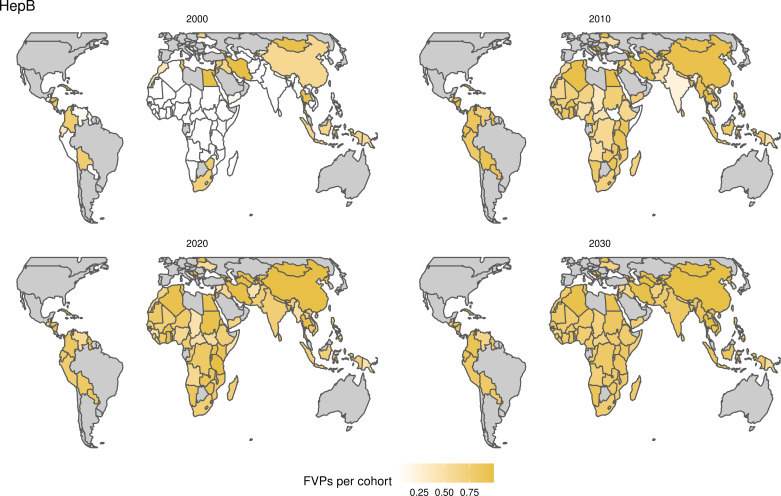
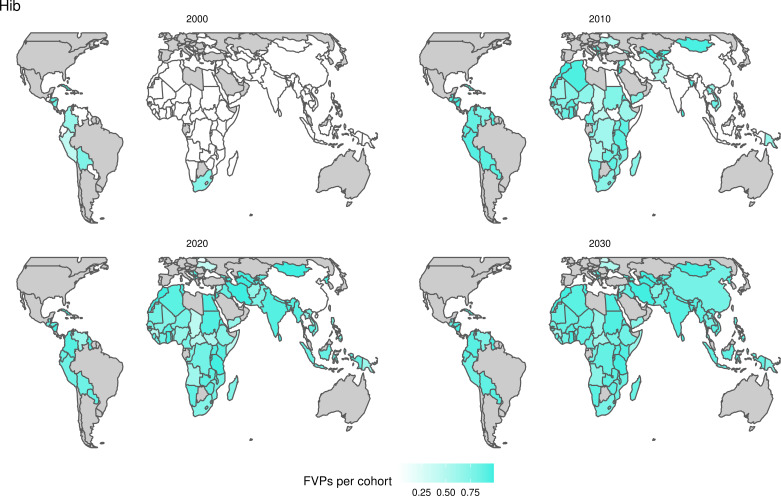
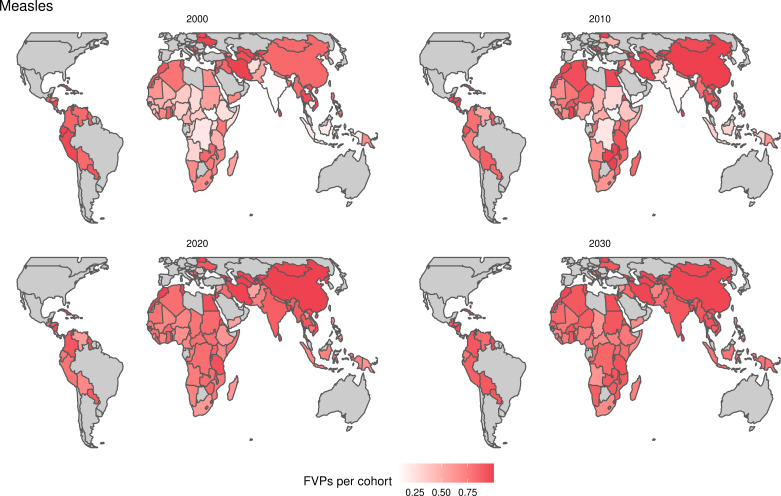
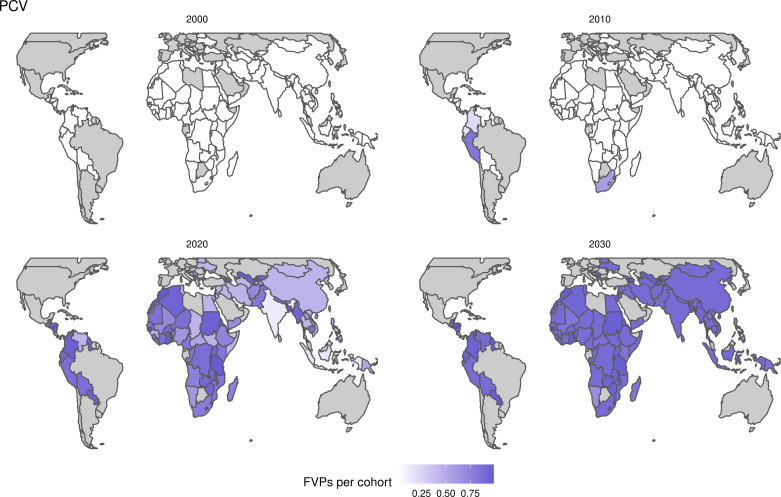
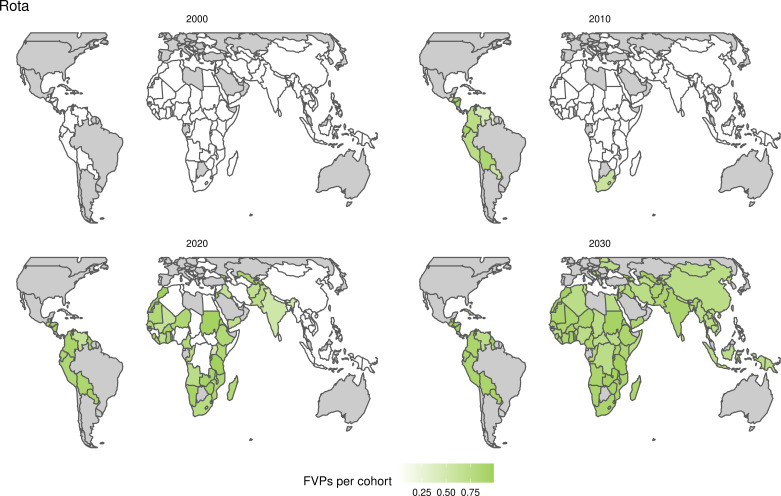
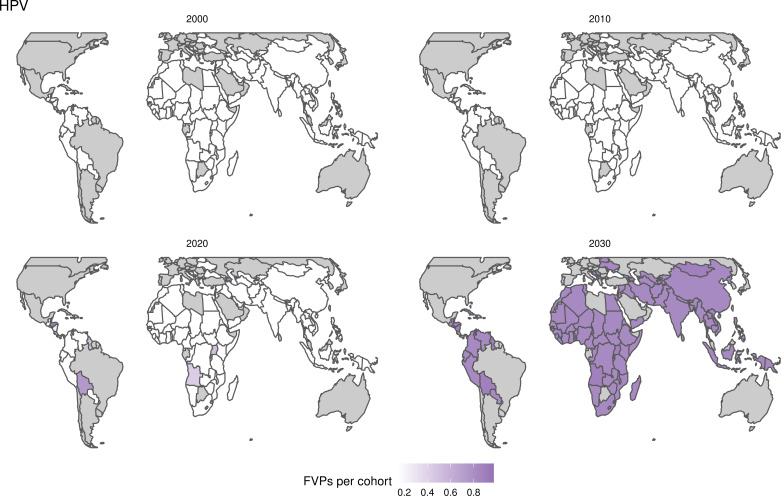
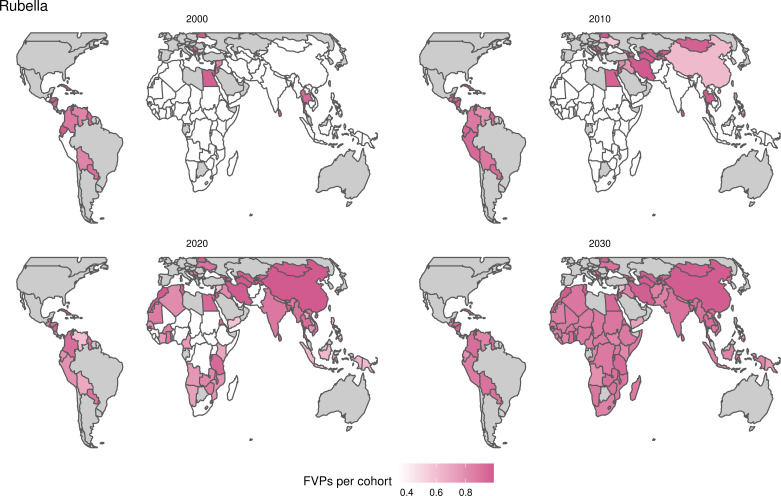
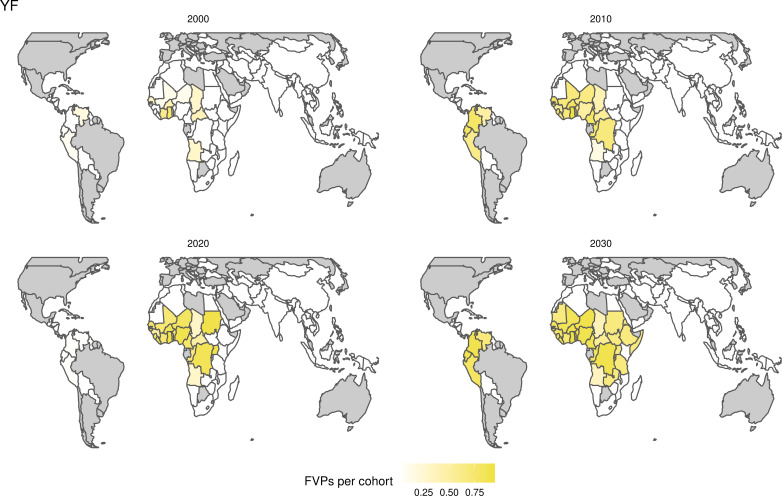
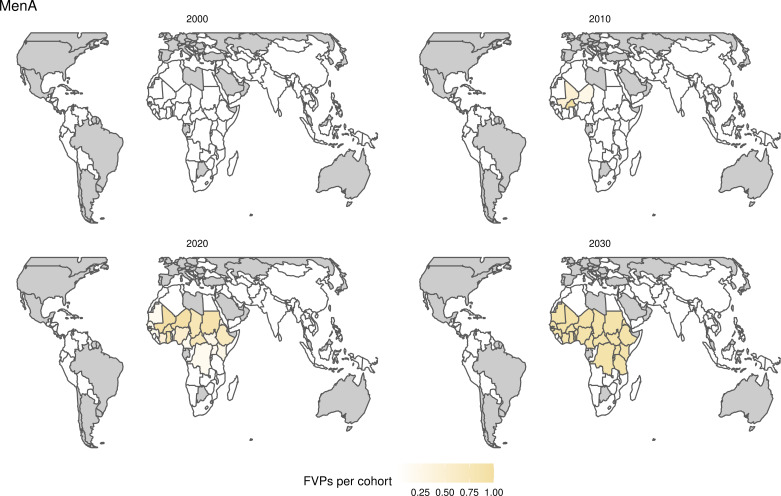
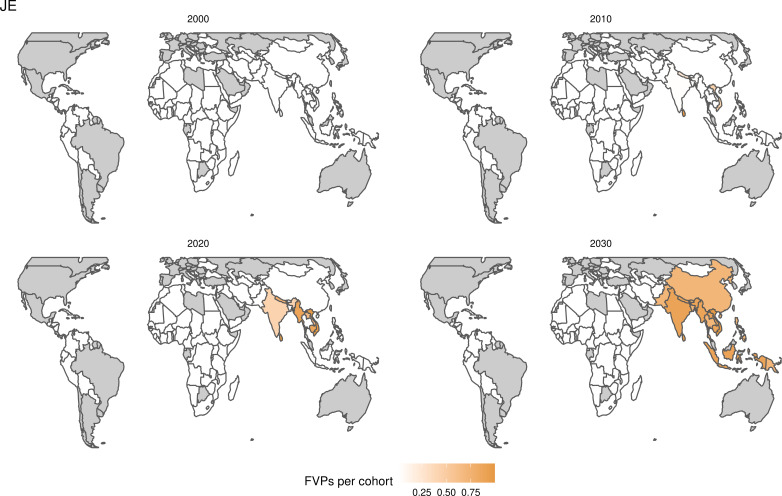
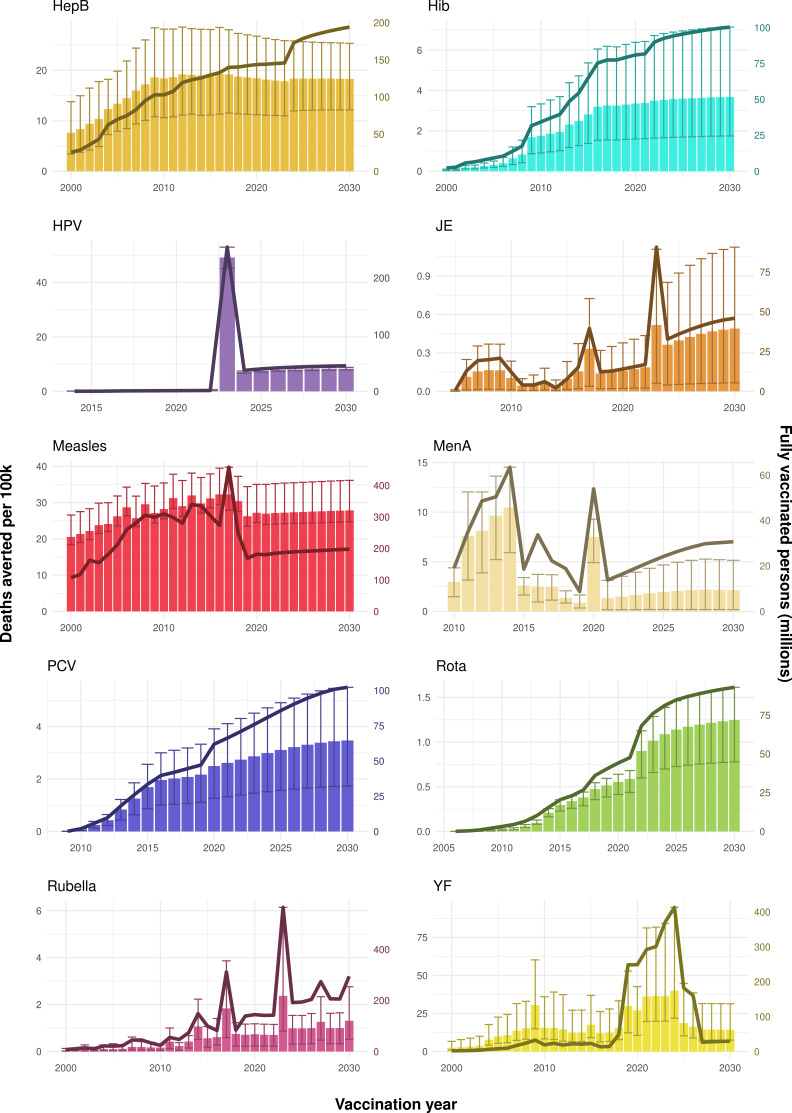
Background: Vaccination is one of the most effective public health interventions. We investigate the impact of vaccination activities for Haemophilus influenzae type b, hepatitis B, human papillomavirus, Japanese encephalitis, measles, Neisseria meningitidis serogroup A, rotavirus, rubella, Streptococcus pneumoniae, and yellow fever over the years 2000-2030 across 112 countries.

Methods: Twenty-one mathematical models estimated disease burden using standardised demographic and immunisation data. Impact was attributed to the year of vaccination through vaccine-activity-stratified impact ratios.

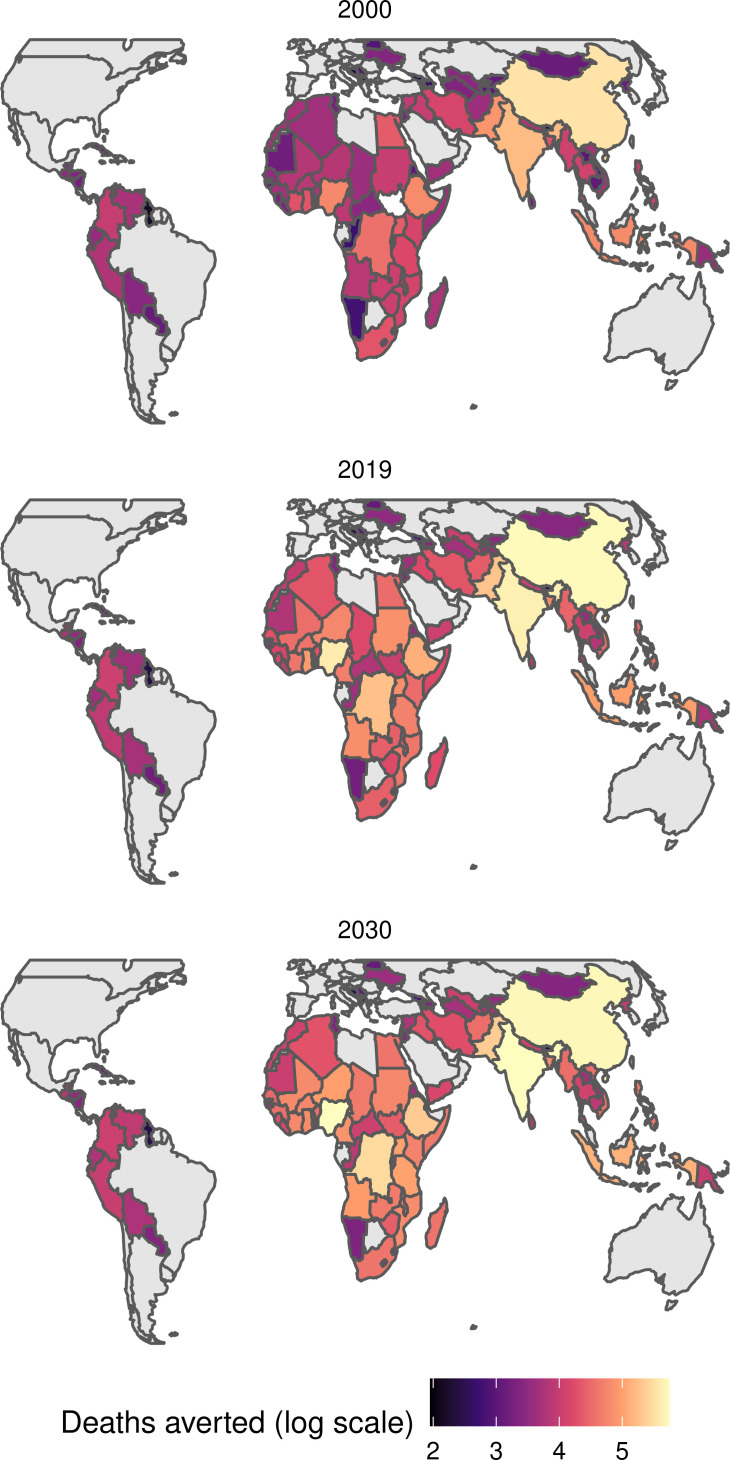
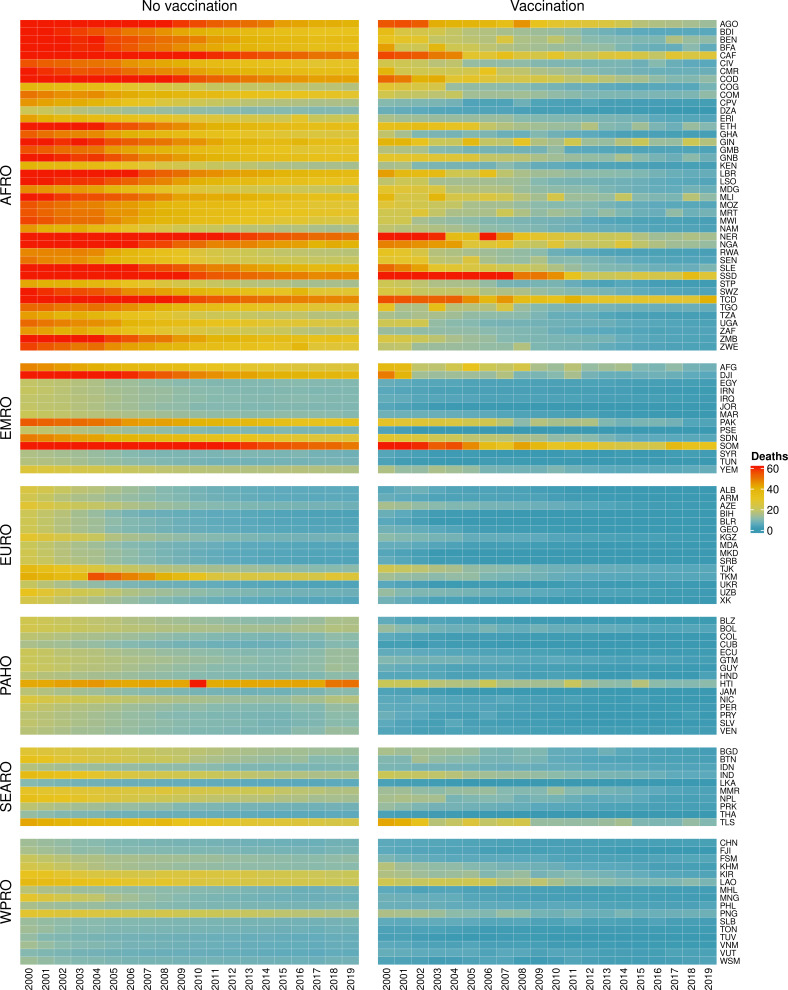
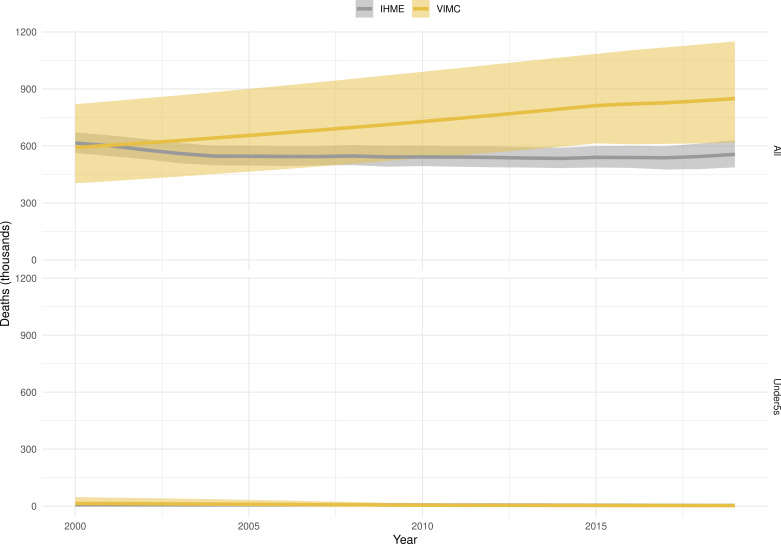
Results: We estimate 97 (95%CrI[80, 120]) million deaths would be averted due to vaccination activities over 2000-2030, with 50 (95%CrI[41, 62]) million deaths averted by activities between 2000 and 2019. For children under-5 born between 2000 and 2030, we estimate 52 (95%CrI[41, 69]) million more deaths would occur over their lifetimes without vaccination against these diseases.

Conclusions: This study represents the largest assessment of vaccine impact before COVID-19-related disruptions and provides motivation for sustaining and improving global vaccination coverage in the future.

Funding: VIMC is jointly funded by Gavi, the Vaccine Alliance, and the Bill and Melinda Gates Foundation (BMGF) (BMGF grant number: OPP1157270 / INV-009125). Funding from Gavi is channelled via VIMC to the Consortium's modelling groups (VIMC-funded institutions represented in this paper: Imperial College London, London School of Hygiene and Tropical Medicine, Oxford University Clinical Research Unit, Public Health England, Johns Hopkins University, The Pennsylvania State University, Center for Disease Analysis Foundation, Kaiser Permanente Washington, University of Cambridge, University of Notre Dame, Harvard University, Conservatoire National des Arts et Métiers, Emory University, National University of Singapore). Funding from BMGF was used for salaries of the Consortium secretariat (authors represented here: TBH, MJ, XL, SE-L, JT, KW, NMF, KAMG); and channelled via VIMC for travel and subsistence costs of all Consortium members (all authors). We also acknowledge funding from the UK Medical Research Council and Department for International Development, which supported aspects of VIMC's work (MRC grant number: MR/R015600/1).JHH acknowledges funding from National Science Foundation Graduate Research Fellowship; Richard and Peggy Notebaert Premier Fellowship from the University of Notre Dame. BAL acknowledges funding from NIH/NIGMS (grant number R01 GM124280) and NIH/NIAID (grant number R01 AI112970). The Lives Saved Tool (LiST) receives funding support from the Bill and Melinda Gates Foundation.This paper was compiled by all coauthors, including two coauthors from Gavi. Other funders had no role in study design, data collection, data analysis, data interpretation, or writing of the report. All authors had full access to all the data in the study and had final responsibility for the decision to submit for publication.

Keywords: LMICs; epidemiology; global health; mathematical modelling; vaccine impact; virus.


Conflict of interest statement

JT, SE, XL, KA, EC, HC, AC, Md, KE, MF, IG, TH, WH, DH, JH, KJ, AK, PK, AK, JL, XL, TM, CM, SM, SN, TP, AP, DR, SR, CS, SS, YT, HT, QT, ST, EV, NW, AW, KW, NF, KG No competing interests declared, MJ MLJ has received research funding from Sanofi Pasteur unrelated to the present work, MJ Reviewing editor, eLife, BL BAL reports grants and personal fees from Takeda Pharmaceuticals, personal fees from World Health Organization, outside the submitted work, TP TAP receives support from Emergent Biosolutions for work unrelated to his contribution to this study, HR HR is an employee of Center for Disease Analysis Foundation which has received grants from Gilead Sciences, AbbVie, Zeshan Foundation and EndHep2030 fund for projects unrelated to this work; HBV epidemiology data was funded by a grant from John Martin Foundation (Grant number 24), CT CLT received a consulting payment from GSK in 2018 (outside the submitted work)

Figures

Figure 1.
Figure 1.. Mean predicted deaths due to the 10 Vaccine Impact Modelling Consortium (VIMC) pathogens per 100,000 population per country for years 2000–2019 under the no vaccination and with vaccination (routine immunisations; RI only) scenarios.
Countries are arranged by World Health Organisation (WHO) African (AFRO), Eastern Mediterranean (EMRO), European (EURO), Pan American (PAHO), South-East Asian (SEARO), and Western Pacific (WPRO) regions. The difference (i.e. deaths averted) between these two scenarios are shown in Table 2 and Figure 2.
Figure 2.
Figure 2.. Deaths averted per year of vaccination for hepatitis B (HepB), Haemophilus influenzae type b (Hib), human papillomavirus (HPV), Japanese encephalitis (JE), measles, Neisseria meningitidis serogroup A (MenA), Streptococcus pneumoniae (PCV), rotavirus (Rota), rubella, and yellow fever (YF).
The bars show the number of deaths averted (in millions) in each vaccination year. Error bars indicate 95% CI. The line shows the number of fully vaccinated persons (FVPs; in millions) achieved in each year’s vaccination activities.
Appendix 5—figure 1.
Appendix 5—figure 1.. Deaths averted per calendar year for hepatitis B (HepB), Haemophilus influenzae type b (Hib), human papillomavirus (HPV), Japanese encephalitis (JE), measles, Neisseria meningitidis serogroup A (MenA), Streptococcus pneumoniae (PCV), rotavirus (Rota), rubella and yellow fever (YF).
Coloured lines and areas indicate estimates based on this Vaccine Impact Modelling Consortium (VIMC) study and grey lines and areas indicate estimates based on previous VIMC results (Li et al., 2019). Ribbons indicate 95% CI.
Appendix 5—figure 2.
Appendix 5—figure 2.. Deaths averted per birth cohort year for hepatitis B (HepB), Haemophilus influenzae type b (Hib), human papillomavirus (HPV), Japanese encephalitis (JE), measles, Neisseria meningitidis serogroup A (MenA), Streptococcus pneumoniae (PCV), rotavirus (Rota), rubella and yellow fever (YF).
Coloured lines and areas indicate estimates based on this Vaccine Impact Modelling Consortium (VIMC) study and grey lines and areas indicate estimates based on previous VIMC results (Li et al., 2019). Ribbons indicate 95% CI.
Appendix 5—figure 3.
Appendix 5—figure 3.. Comparison of fully vaccinated persons (FVPs) in millions between 2017 and 2019 model estimates used within the previous Vaccine Impact Modelling Consortium (VIMC)-wide study Li et al., 2019 and this study, respectively.
FVPs shown for hepatitis B (HepB), Haemophilus influenzae type b (Hib), human papillomavirus (HPV), Japanese encephalitis (JE), measles, Neisseria meningitidis serogroup A (MenA), Streptococcus pneumoniae (PCV), rotavirus (Rota), rubella, and yellow fever (YF).
Appendix 5—figure 4.
Appendix 5—figure 4.. Estimated number of deaths averted per year of vaccination in 2000, 2019, and 2030 for all 10 Vaccine Impact Modelling Consortium (VIMC) pathogens.
Appendix 5—figure 5.
Appendix 5—figure 5.. Mean predicted deaths for children under-5 with and without vaccination due to the 10 Vaccine Impact Modelling Consortium (VIMC) pathogens per 1000 lives per country for years 2000–2019.
Countries are arranged by World Health Organisation (WHO) African (AFRO), Eastern Mediterranean (EMRO), European (EURO), Pan American (PAHO), South-East Asian (SEARO), and Western Pacific (WPRO) regions.
Appendix 5—figure 6.
Appendix 5—figure 6.. Global deaths for hepatitis B per calendar year (in thousands) for all ages and for children under-5.
Orange lines and areas indicate estimates from the Vaccine Impact Modelling Consortium (VIMC). Grey lines and areas indicate estimates from the Global Burden of Disease Study (GBD) 2019 from the Institute for Health Metrics and Evaluation (IHME). Ribbons indicate 95% CI.
Appendix 5—figure 7.
Appendix 5—figure 7.. Deaths for hepatitis B in the PINE countries (Pakistan - PAK, India - IND, Nigeria - NGA and Ethiopia - ETH) per calendar year (in thousands) for all ages and for under-5s.
Orange lines and areas indicate estimates from the Vaccine Impact Modelling Consortium (VIMC). Grey lines and areas indicate estimates from the Global Burden of Disease Study (GBD) 2019 from the Institute for Health Metrics and Evaluation (IHME). Ribbons indicate 95% CI.
Appendix 5—figure 8.
Appendix 5—figure 8.. Global deaths for measles per calendar year (in thousands) for all ages and for children under-5.
Red lines and areas indicate estimates from the Vaccine Impact Modelling Consortium (VIMC). Grey lines and areas indicate estimates from the Global Burden of Disease Study (GBD) 2019 from the Institute for Health Metrics and Evaluation (IHME). Ribbons indicate 95% CI.
Appendix 5—figure 9.
Appendix 5—figure 9.. Deaths for measles in the PINE countries (Pakistan - PAK, India - IND, Nigeria - NGA and Ethiopia - ETH) per calendar year (in thousands) for all ages and for children under-5.
Red lines and areas indicate estimates from the Vaccine Impact Modelling Consortium (VIMC). Grey lines and areas indicate estimates from the Global Burden of Disease Study (GBD) 2019 from the Institute for Health Metrics and Evaluation (IHME). Ribbons indicate 95% CI.
Appendix 5—figure 10.
Appendix 5—figure 10.. Global deaths for yellow fever per calendar year (in thousands) for all ages and for children under-5.
Yellow lines and areas indicate estimates from the Vaccine Impact Modelling Consortium (VIMC). Grey lines and areas indicate estimates from the Global Burden of Disease Study (GBD) 2019 from the Institute for Health Metrics and Evaluation (IHME). Ribbons indicate 95% CI.
Appendix 5—figure 11.
Appendix 5—figure 11.. Deaths for yellow fever in Nigeria - NGA and Ethiopia - ETH per calendar year (in thousands) for all ages and for children under-5.
Yellow lines and areas indicate estimates from the Vaccine Impact Modelling Consortium (VIMC). Grey lines and areas indicate estimates from the Global Burden of Disease Study (GBD) 2019 from the Institute for Health Metrics and Evaluation (IHME). Ribbons indicate 95% CI.
Appendix 5—figure 12.
Appendix 5—figure 12.. Fully vaccinated persons (FVPs) per vaccination target population for Hepatitis B for years 2000, 2010, 2020, and 2030.
Appendix 5—figure 13.
Appendix 5—figure 13.. Fully vaccinated persons (FVPs) per vaccination target population for Haemophilus influenzae type b (Hib) for years 2000, 2010, 2020, and 2030.
Appendix 5—figure 14.
Appendix 5—figure 14.. Fully vaccinated persons (FVPs) per vaccination target population for measles for years 2000, 2010, 2020, and 2030.
Appendix 5—figure 15.
Appendix 5—figure 15.. Fully vaccinated persons (FVPs) per vaccination target population for Streptococcus pneumoniae (PCV) for years 2000, 2010, 2020, and 2030.
Appendix 5—figure 16.
Appendix 5—figure 16.. Fully vaccinated persons (FVPs) per vaccination target population for rotavirus for years 2000, 2010, 2020, and 2030.
Appendix 5—figure 17.
Appendix 5—figure 17.. Fully vaccinated persons (FVPs) per vaccination target population for human papillomavirus (HPV) for years 2000, 2010, 2020, and 2030.
Appendix 5—figure 18.
Appendix 5—figure 18.. Fully vaccinated persons (FVPs) per vaccination target population for rubella for years 2000, 2010, 2020, and 2030.
Appendix 5—figure 19.
Appendix 5—figure 19.. Fully vaccinated persons (FVPs) per vaccination target population for yellow fever (YF) for years 2000, 2010, 2020, and 2030.
Appendix 5—figure 20.
Appendix 5—figure 20.. Fully vaccinated persons (FVPs) per vaccination target population for Neisseria meningitidis serogroup A (MenA) for years 2000, 2010, 2020, and 2030.
Appendix 5—figure 21.
Appendix 5—figure 21.. Fully vaccinated persons (FVPs) per vaccination target population for Japanese encephalitis (JE) for years 2000, 2010, 2020, and 2030.
Appendix 5—figure 22.
Appendix 5—figure 22.. Deaths averted per 100,000 population per year of vaccination for hepatitis B (HepB), Haemophilus influenzae type b (Hib), human papillomavirus (HPV), Japanese encephalitis (JE), measles, Neisseria meningitidis serogroup A (MenA), Streptococcus pneumoniae (PCV), rotavirus (Rota), rubella, and yellow fever (YF).
The bars show the number of deaths averted (per 100,000 population) in each vaccination year. Error bars indicate 95% CI. The line shows the number of fully vaccinated persons (FVPs; in millions) achieved in each year’s vaccination activities.

References

    1. Abbas K, Procter SR, van Zandvoort K, Clark A, Funk S, Mengistu T, Hogan D, Dansereau E, Jit M, Flasche S, LSHTM CMMID COVID-19 Working Group Routine childhood immunisation during the COVID-19 pandemic in Africa: a benefit-risk analysis of health benefits versus excess risk of SARS-CoV-2 infection. The Lancet Global Health. 2020a;8:e1264–e1272. doi: 10.1016/S2214-109X(20)30308-9. - DOI - PMC - PubMed
    1. Abbas KM, van Zandvoort K, Brisson M, Jit M. Effects of updated demography, disability weights, and cervical Cancer burden on estimates of human papillomavirus vaccination impact at the global, regional, and national levels: a PRIME modelling study. The Lancet Global Health. 2020b;8:e536–e544. doi: 10.1016/S2214-109X(20)30022-X. - DOI - PMC - PubMed
    1. Abbas K, Hadley L. Prime. swh:1:rev:0da13630968de0863f38294a1c234c5947baf97eSoftware Heritage. 2021 https://archive.softwareheritage.org/swh:1:rev:0da13630968de0863f38294a1...
    1. Amouzou A, Richard SA, Friberg IK, Bryce J, Baqui AH, El Arifeen S, Walker N. How well does LiST capture mortality by wealth quintile? A comparison of measured versus modelled mortality rates among children under-five in Bangladesh. International Journal of Epidemiology. 2010;39:i186–i192. doi: 10.1093/ije/dyq034. - DOI - PMC - PubMed
    1. Anderson RM, May RM. Infectious Disease of Humans: Dynamics and Control. Oxford Univerity Press; 1991.

Publication types

Substances