. 2021 Oct;20(10):1941-1955.
doi: 10.1158/1535-7163.MCT-21-0035. Epub 2021 Jul 12.

Belantamab Mafodotin (GSK2857916) Drives Immunogenic Cell Death and Immune-mediated Antitumor Responses In Vivo

Affiliations

Belantamab Mafodotin (GSK2857916) Drives Immunogenic Cell Death and Immune-mediated Antitumor Responses In Vivo

Rocio Montes de Oca et al. Mol Cancer Ther. 2021 Oct.

Abstract

B-cell maturation antigen (BCMA) is an attractive therapeutic target highly expressed on differentiated plasma cells in multiple myeloma and other B-cell malignancies. GSK2857916 (belantamab mafodotin, BLENREP) is a BCMA-targeting antibody-drug conjugate approved for the treatment of relapsed/refractory multiple myeloma. We report that GSK2857916 induces immunogenic cell death in BCMA-expressing cancer cells and promotes dendritic cell activation in vitro and in vivo GSK2857916 treatment enhances intratumor immune cell infiltration and activation, delays tumor growth, and promotes durable complete regressions in immune-competent mice bearing EL4 lymphoma tumors expressing human BCMA (EL4-hBCMA). Responding mice are immune to rechallenge with EL4 parental and EL4-hBCMA cells, suggesting engagement of an adaptive immune response, immunologic memory, and tumor antigen spreading, which are abrogated upon depletion of endogenous CD8+ T cells. Combinations with OX40/OX86, an immune agonist antibody, significantly enhance antitumor activity and increase durable complete responses, providing a strong rationale for clinical evaluation of GSK2857916 combinations with immunotherapies targeting adaptive immune responses, including T-cell-directed checkpoint modulators.


Figures

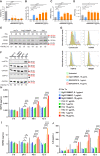
Figure 1. GSK2857916 induces ICD markers in NCI-H929 cells. A, Cell viability was measured by automated flow cytometry 48 hours after treatment. B, Calreticulin translocation to the cell surface was assessed by flow cytometry 48 hours after treatment. Gating on PI staining allowed to exclude dead cells. C, HMGB1 release into the media was assessed by ELISA. D, Extracellular ATP concentrations in the media were determined by a luciferase-based assay. For all measurements, mean ± SD of triplicates from a representative experiment shown. A one-way ANOVA statistical analysis was performed. NCI-H929 cells were treated with 10 μg/mL (E) or 1 μg/mL (F) of hIgG1-MMAF, GSK2857914 (914) or GSK2857916 (916), or were left untreated (No Tx), for 48 or 72 hours. PERK and eIF2α phosphorylation and BAP31 cleavage were evaluated by Western blot analysis. Representative results of multiple independent experiments also indicating the cell viability (%) at the time of sample collection. Note the increase in the high molecular weight band with PERK antibody upon GSK2857916 treatment, which coincides with the PERK phosphorylation (p-PERK) antibody signal. The BAF31 cleavage product is indicated by an arrowhead. GAPDH was used as loading control. Indicated in black is the predicted molecular weight of the protein and in red the molecular weight of the protein marker. G, Cell surface expression of calreticulin, HSP90, HSP70, and HMGB1 by flow cytometry in NCI-H929 cells after 72 hours of treatment. Overlaid histograms of nonpermeabilized stained cells shown. Gating was performed on live cells and utilized isotype controls. H–J, HSP70, HSP90, and IL8 release into the media after the indicated treatments and at the indicated timepoints was assessed by ELISA in NCI-H929 cells. Shown is a representative result of at least two independent experiments, bars indicate the mean ± SD of biological duplicates. A two-way ANOVA statistical analysis was performed. ns, not significant; *, P < 0.05; **, P < 0.01; ***, P < 0.001; ****, P ≤ 0.0001.
Figure 1.
GSK2857916 induces ICD markers in NCI-H929 cells. A, Cell viability was measured by automated flow cytometry 48 hours after treatment. B, Calreticulin translocation to the cell surface was assessed by flow cytometry 48 hours after treatment. Gating on PI staining allowed to exclude dead cells. C, HMGB1 release into the media was assessed by ELISA. D, Extracellular ATP concentrations in the media were determined by a luciferase-based assay. For all measurements, mean ± SD of triplicates from a representative experiment shown. A one-way ANOVA statistical analysis was performed. NCI-H929 cells were treated with 10 μg/mL (E) or 1 μg/mL (F) of hIgG1-MMAF, GSK2857914 (914) or GSK2857916 (916), or were left untreated (No Tx), for 48 or 72 hours. PERK and eIF2α phosphorylation and BAP31 cleavage were evaluated by Western blot analysis. Representative results of multiple independent experiments also indicating the cell viability (%) at the time of sample collection. Note the increase in the high molecular weight band with PERK antibody upon GSK2857916 treatment, which coincides with the PERK phosphorylation (p-PERK) antibody signal. The BAF31 cleavage product is indicated by an arrowhead. GAPDH was used as loading control. Indicated in black is the predicted molecular weight of the protein and in red the molecular weight of the protein marker. G, Cell surface expression of calreticulin, HSP90, HSP70, and HMGB1 by flow cytometry in NCI-H929 cells after 72 hours of treatment. Overlaid histograms of nonpermeabilized stained cells shown. Gating was performed on live cells and utilized isotype controls. HJ, HSP70, HSP90, and IL8 release into the media after the indicated treatments and at the indicated timepoints was assessed by ELISA in NCI-H929 cells. Shown is a representative result of at least two independent experiments, bars indicate the mean ± SD of biological duplicates. A two-way ANOVA statistical analysis was performed. ns, not significant; *, P < 0.05; **, P < 0.01; ***, P < 0.001; ****, P ≤ 0.0001.
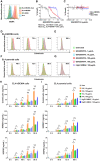
Figure 2. GSK2857916 induces DC activation and maturation in vitro. Differential expression of CD11c and HLA-DR allows for a gating strategy that distinguishes isolated iDCs from NCI-H929 tumor cells. A, Histograms representing CD11c and HLA-DR surface expression in untreated iDCs and NCI-H929 cells. Gray, antibody histogram; white, isotype histogram. B, CD40, CD83, and CD86 surface expression by flow cytometry in isolated iDCs from three healthy donors following a 24-hour co-culture with NCI-H929 cells, which were pretreated as indicated for 48 hours. Shown are the percentage of positive cells per donor and mean. A two-way ANOVA statistical analysis was performed. ns, not significant; *, P < 0.05.
Figure 2.
GSK2857916 induces DC activation and maturation in vitro. Differential expression of CD11c and HLA-DR allows for a gating strategy that distinguishes isolated iDCs from NCI-H929 tumor cells. A, Histograms representing CD11c and HLA-DR surface expression in untreated iDCs and NCI-H929 cells. Gray, antibody histogram; white, isotype histogram. B, CD40, CD83, and CD86 surface expression by flow cytometry in isolated iDCs from three healthy donors following a 24-hour co-culture with NCI-H929 cells, which were pretreated as indicated for 48 hours. Shown are the percentage of positive cells per donor and mean. A two-way ANOVA statistical analysis was performed. ns, not significant; *, P < 0.05.
Figure 3. GSK2857916 induces ICD markers in EL4-hBCMA cells. A, BCMA cell surface expression by flow cytometry in EL4-hBCMA, EL4 parental, and NCI-H929 cells. Overlaid histograms depicting BCMA normalized median fluorescence intensity (MFI) in nonpermeabilized stained cells shown. Gating was performed on live cells and utilized isotype controls. Dose–response curves in EL4-hBCMA, EL4 parental, and NCI-H929 cells, following 3 days of exposure to GSK2857916 (B) or GSK2857914 (C). Shown is representative data normalized to % growth from at least three independent experiments with mean ± SD of biological quadruplicates. Mean IC50 values from at least three independent experiments also reported. D, Calreticulin cell surface expression by flow cytometry in EL4-hBCMA cells at the indicated timepoints in untreated cells and after exposure to 1, 10, or 100 μg/mL of GSK2857916 in vitro. Overlaid histograms of nonpermeabilized stained cells shown. Gating was performed on live cells and utilized isotype controls. E, Calreticulin cell surface expression as in (D) 96 hours after exposure to 100 μg/mL of GSK2857914 or hIgG1-MMAF and in untreated cells in vitro. F and G, Calreticulin cell surface expression as in (D or E) in EL4 parental cells. Calreticulin, HMGB1 and HSP60 release into the media after the indicated treatments and at the indicated timepoints assessed by ELISA in EL4-hBCMA (H) and EL4 parental (I) cells. Shown is a representative result of at least two independent experiments, bars indicate the mean ± SD of biological duplicates or triplicates. A two-way ANOVA statistical analysis was performed. ns, not significant; *, P < 0.05; **, P < 0.01; ***, P < 0.001; ****, P ≤ 0.0001.
Figure 3.
GSK2857916 induces ICD markers in EL4-hBCMA cells. A, BCMA cell surface expression by flow cytometry in EL4-hBCMA, EL4 parental, and NCI-H929 cells. Overlaid histograms depicting BCMA normalized median fluorescence intensity (MFI) in nonpermeabilized stained cells shown. Gating was performed on live cells and utilized isotype controls. Dose–response curves in EL4-hBCMA, EL4 parental, and NCI-H929 cells, following 3 days of exposure to GSK2857916 (B) or GSK2857914 (C). Shown is representative data normalized to % growth from at least three independent experiments with mean ± SD of biological quadruplicates. Mean IC50 values from at least three independent experiments also reported. D, Calreticulin cell surface expression by flow cytometry in EL4-hBCMA cells at the indicated timepoints in untreated cells and after exposure to 1, 10, or 100 μg/mL of GSK2857916 in vitro. Overlaid histograms of nonpermeabilized stained cells shown. Gating was performed on live cells and utilized isotype controls. E, Calreticulin cell surface expression as in (D) 96 hours after exposure to 100 μg/mL of GSK2857914 or hIgG1-MMAF and in untreated cells in vitro. F and G, Calreticulin cell surface expression as in (D or E) in EL4 parental cells. Calreticulin, HMGB1 and HSP60 release into the media after the indicated treatments and at the indicated timepoints assessed by ELISA in EL4-hBCMA (H) and EL4 parental (I) cells. Shown is a representative result of at least two independent experiments, bars indicate the mean ± SD of biological duplicates or triplicates. A two-way ANOVA statistical analysis was performed. ns, not significant; *, P < 0.05; **, P < 0.01; ***, P < 0.001; ****, P ≤ 0.0001.
Figure 4. GSK2857916 in vivo antitumor activity is mediated by host innate and adaptive immune responses and is MMAF dependent. A, Therapeutic efficacy (left) and survival (right) in C57BL/6 mice bearing EL4-hBCMA tumors. Animals were treated intraperitoneally when tumors reached approximately 150 to 200 mm3 with saline, hIgG1-MMAF or increasing doses of GSK2857916 twice a week for 3 weeks, as indicated (n = 10 mice/group). B, Animals with complete and sustained tumor regressions from (A; n = 9 mice/group) and age-matched naïve controls (n = 10 mice/group) were (re)-challenged with 1 × 10⁵ EL4-hBCMA or EL4 parental cells on day 77 (the last dose of GSK2857916 was on day 17). Therapeutic efficacy (left) and survival (right) were monitored for 50 days after cell (re)-inoculation. C, Therapeutic efficacy (left) and survival (right) in EL4-hBCMA tumor-bearing mice dosed with 30 mg/kg as in (A) with several versions of the GSK2857914 antibody or the GSK2857916 ADC, as indicated (n = 10 mice/group). Efficacy data expressed as mean tumor volume ± SEM, over time. Kaplan–Meier survival in percentage, significant P values by a standard log-rank test (P < 0.05).
Figure 4.
GSK2857916 in vivo antitumor activity is mediated by host innate and adaptive immune responses and is MMAF dependent. A, Therapeutic efficacy (left) and survival (right) in C57BL/6 mice bearing EL4-hBCMA tumors. Animals were treated intraperitoneally when tumors reached approximately 150 to 200 mm3 with saline, hIgG1-MMAF or increasing doses of GSK2857916 twice a week for 3 weeks, as indicated (n = 10 mice/group). B, Animals with complete and sustained tumor regressions from (A; n = 9 mice/group) and age-matched naïve controls (n = 10 mice/group) were (re)-challenged with 1 × 10⁵ EL4-hBCMA or EL4 parental cells on day 77 (the last dose of GSK2857916 was on day 17). Therapeutic efficacy (left) and survival (right) were monitored for 50 days after cell (re)-inoculation. C, Therapeutic efficacy (left) and survival (right) in EL4-hBCMA tumor-bearing mice dosed with 30 mg/kg as in (A) with several versions of the GSK2857914 antibody or the GSK2857916 ADC, as indicated (n = 10 mice/group). Efficacy data expressed as mean tumor volume ± SEM, over time. Kaplan–Meier survival in percentage, significant P values by a standard log-rank test (P < 0.05).
Figure 5. Depletion of CD8+ T cells abrogates GSK2857916 antitumor activity. A–H, EL4-hBCMA tumors were established (as in Fig. 4) and animals were treated on days 1, 3, 6, 9, 13, and 16 with GSK2857916 or hIgG1-MMAF (15 mg/kg; red ticks labeled as “ADC”). T-cell–depleting doses of anti-CD4, anti-CD8, or both (300 μg/mouse) were administered on days 1, 5, 9, and 16 (blue ticks labeled as “Depletion”). Efficacy data expressed as individual tumor volumes over time (n = 10 mice/group). The number of tumor free/total mice is indicated in the bottom right corner. I and J, Depletion of CD4+ and/or CD8+ T cells was verified on day 15 by flow cytometry.
Figure 5.
Depletion of CD8+ T cells abrogates GSK2857916 antitumor activity. AH, EL4-hBCMA tumors were established (as in Fig. 4) and animals were treated on days 1, 3, 6, 9, 13, and 16 with GSK2857916 or hIgG1-MMAF (15 mg/kg; red ticks labeled as “ADC”). T-cell–depleting doses of anti-CD4, anti-CD8, or both (300 μg/mouse) were administered on days 1, 5, 9, and 16 (blue ticks labeled as “Depletion”). Efficacy data expressed as individual tumor volumes over time (n = 10 mice/group). The number of tumor free/total mice is indicated in the bottom right corner. I and J, Depletion of CD4+ and/or CD8+ T cells was verified on day 15 by flow cytometry.
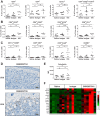
Figure 6. GSK2857916 enhances intratumor immune cell infiltration and activation. Quantification by flow cytometry of immune cells infiltrating C57BL/6 mice bearing EL4-hBCMA tumors following treatment with GSK2857916 or isotype control (at 15 mg/kg), or saline vehicle. A, CD8+, CD4+, and regulatory (CD4+CD25+FoxP3+) T cells, and DC (CD11c+). B, T-cell activation markers CD25, CD69, and ICOS and the exhaustion marker PD-1. C, Quantification of the DC costimulatory molecule CD86, T-cell proliferation (Ki67) and cytotoxicity (granzyme B, GrzB) in TILs and NK cells (CD49b+). A one-way ANOVA statistical analysis was performed. ns, not significant; *, P < 0.05; **, P < 0.01; ***, P < 0.001; ****, P ≤ 0.0001. D, IHC for CD8 reactive cells in mice bearing EL4-hBCMA tumors treated with GSK2857914 (top) or GSK2857916 (bottom) at 15 mg/kg (as in Fig. 4). Representative images, 20× magnification. E, Quantification of calreticulin cell surface expression (MFI) on tumor cells in mice. F, Heatmap depicting a type I IFN-related gene signature following treatment with saline, isotype control or GSK2857916 (at 15 mg/kg) from the same experiment as in (A–C, E). Each column represents an individual mouse and each row an individual gene.
Figure 6.
GSK2857916 enhances intratumor immune cell infiltration and activation. Quantification by flow cytometry of immune cells infiltrating C57BL/6 mice bearing EL4-hBCMA tumors following treatment with GSK2857916 or isotype control (at 15 mg/kg), or saline vehicle. A, CD8+, CD4+, and regulatory (CD4+CD25+FoxP3+) T cells, and DC (CD11c+). B, T-cell activation markers CD25, CD69, and ICOS and the exhaustion marker PD-1. C, Quantification of the DC costimulatory molecule CD86, T-cell proliferation (Ki67) and cytotoxicity (granzyme B, GrzB) in TILs and NK cells (CD49b+). A one-way ANOVA statistical analysis was performed. ns, not significant; *, P < 0.05; **, P < 0.01; ***, P < 0.001; ****, P ≤ 0.0001. D, IHC for CD8 reactive cells in mice bearing EL4-hBCMA tumors treated with GSK2857914 (top) or GSK2857916 (bottom) at 15 mg/kg (as in Fig. 4). Representative images, 20× magnification. E, Quantification of calreticulin cell surface expression (MFI) on tumor cells in mice. F, Heatmap depicting a type I IFN-related gene signature following treatment with saline, isotype control or GSK2857916 (at 15 mg/kg) from the same experiment as in (A–C, E). Each column represents an individual mouse and each row an individual gene.
Figure 7. Therapeutic synergy by combining GSK2857916 and an agonist anti-OX86 antibody. Therapeutic efficacy (left) and survival (right) in C57BL/6 mice bearing EL4-hBCMA tumors. Animals were treated intraperitoneally when tumors reached approximately 150 to 200 mm3 with GSK2857916 or hIgG1-MMAF at 10 mg/kg and/or a mouse anti-OX86 IgG2a or IgG2a isotype antibody at 0.2, 1, and 5 mg/kg, plus saline control, all twice a week for 3 weeks, as indicated. Efficacy data expressed as mean tumor volume ± SEM over time. Kaplan–Meier survival in percentage, significant P values by a standard log-rank test (P < 0.05; n = 10 mice/group) provided for the combination against the first or second single agent listed, respectively.
Figure 7.
Therapeutic synergy by combining GSK2857916 and an agonist anti-OX86 antibody. Therapeutic efficacy (left) and survival (right) in C57BL/6 mice bearing EL4-hBCMA tumors. Animals were treated intraperitoneally when tumors reached approximately 150 to 200 mm3 with GSK2857916 or hIgG1-MMAF at 10 mg/kg and/or a mouse anti-OX86 IgG2a or IgG2a isotype antibody at 0.2, 1, and 5 mg/kg, plus saline control, all twice a week for 3 weeks, as indicated. Efficacy data expressed as mean tumor volume ± SEM over time. Kaplan–Meier survival in percentage, significant P values by a standard log-rank test (P < 0.05; n = 10 mice/group) provided for the combination against the first or second single agent listed, respectively.

References

    1. Sakuishi K, Apetoh L, Sullivan JM, Blazar BR, Kuchroo VK, Anderson AC. Targeting Tim-3 and PD-1 pathways to reverse T cell exhaustion and restore anti-tumor immunity. J Exp Med 2010;207:2187–94. - PMC - PubMed
    1. Hoos A. Development of immuno-oncology drugs - from CTLA4 to PD1 to the next generations. Nat Rev Drug Discov 2016;15:235–47. - PubMed
    1. Gramaglia I, Weinberg AD, Lemon M, Croft M. Ox-40 ligand: a potent costimulatory molecule for sustaining primary CD4 T cell responses. J Immunol 1998;161:6510–7. - PubMed
    1. Mahoney KM, Rennert PD, Freeman GJ. Combination cancer immunotherapy and new immunomodulatory targets. Nat Rev Drug Discov 2015;14:561–84. - PubMed
    1. Wargo JA, Reuben A, Cooper ZA, Oh KS, Sullivan RJ. Immune effects of chemotherapy, radiation, and targeted therapy and opportunities for combination with immunotherapy. Semin Oncol 2015;42:601–16. - PMC - PubMed

Publication types

MeSH terms