. 2021 Aug 25;41(34):7197-7205.
doi: 10.1523/JNEUROSCI.0490-21.2021. Epub 2021 Jul 12.

Dopamine Axons in Dorsal Striatum Encode Contralateral Visual Stimuli and Choices

Affiliations

Dopamine Axons in Dorsal Striatum Encode Contralateral Visual Stimuli and Choices

Morgane M Moss et al. J Neurosci. .

Abstract

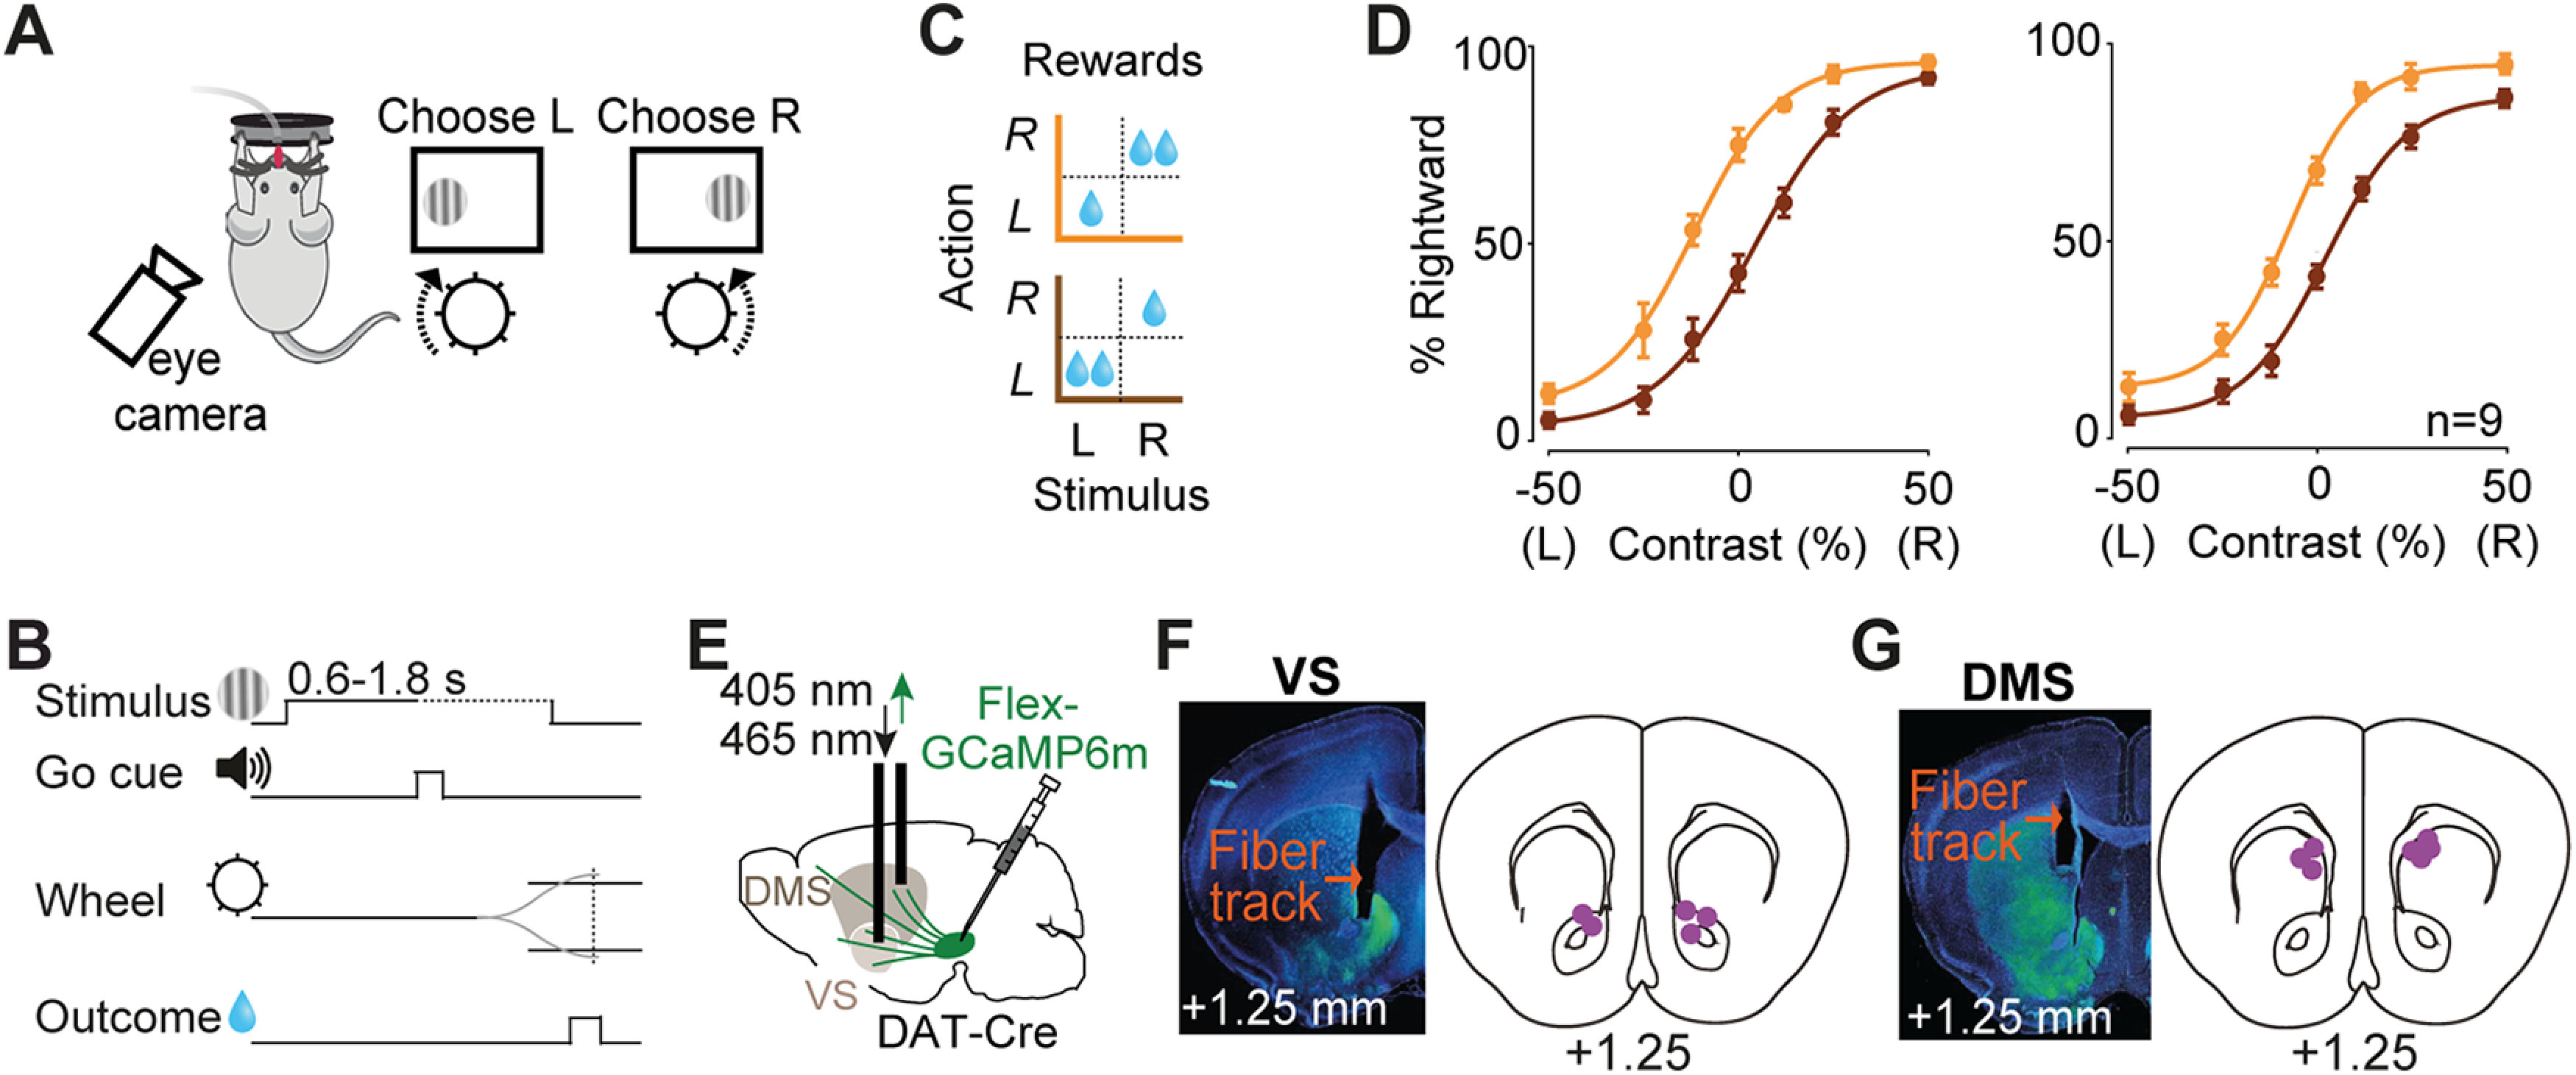
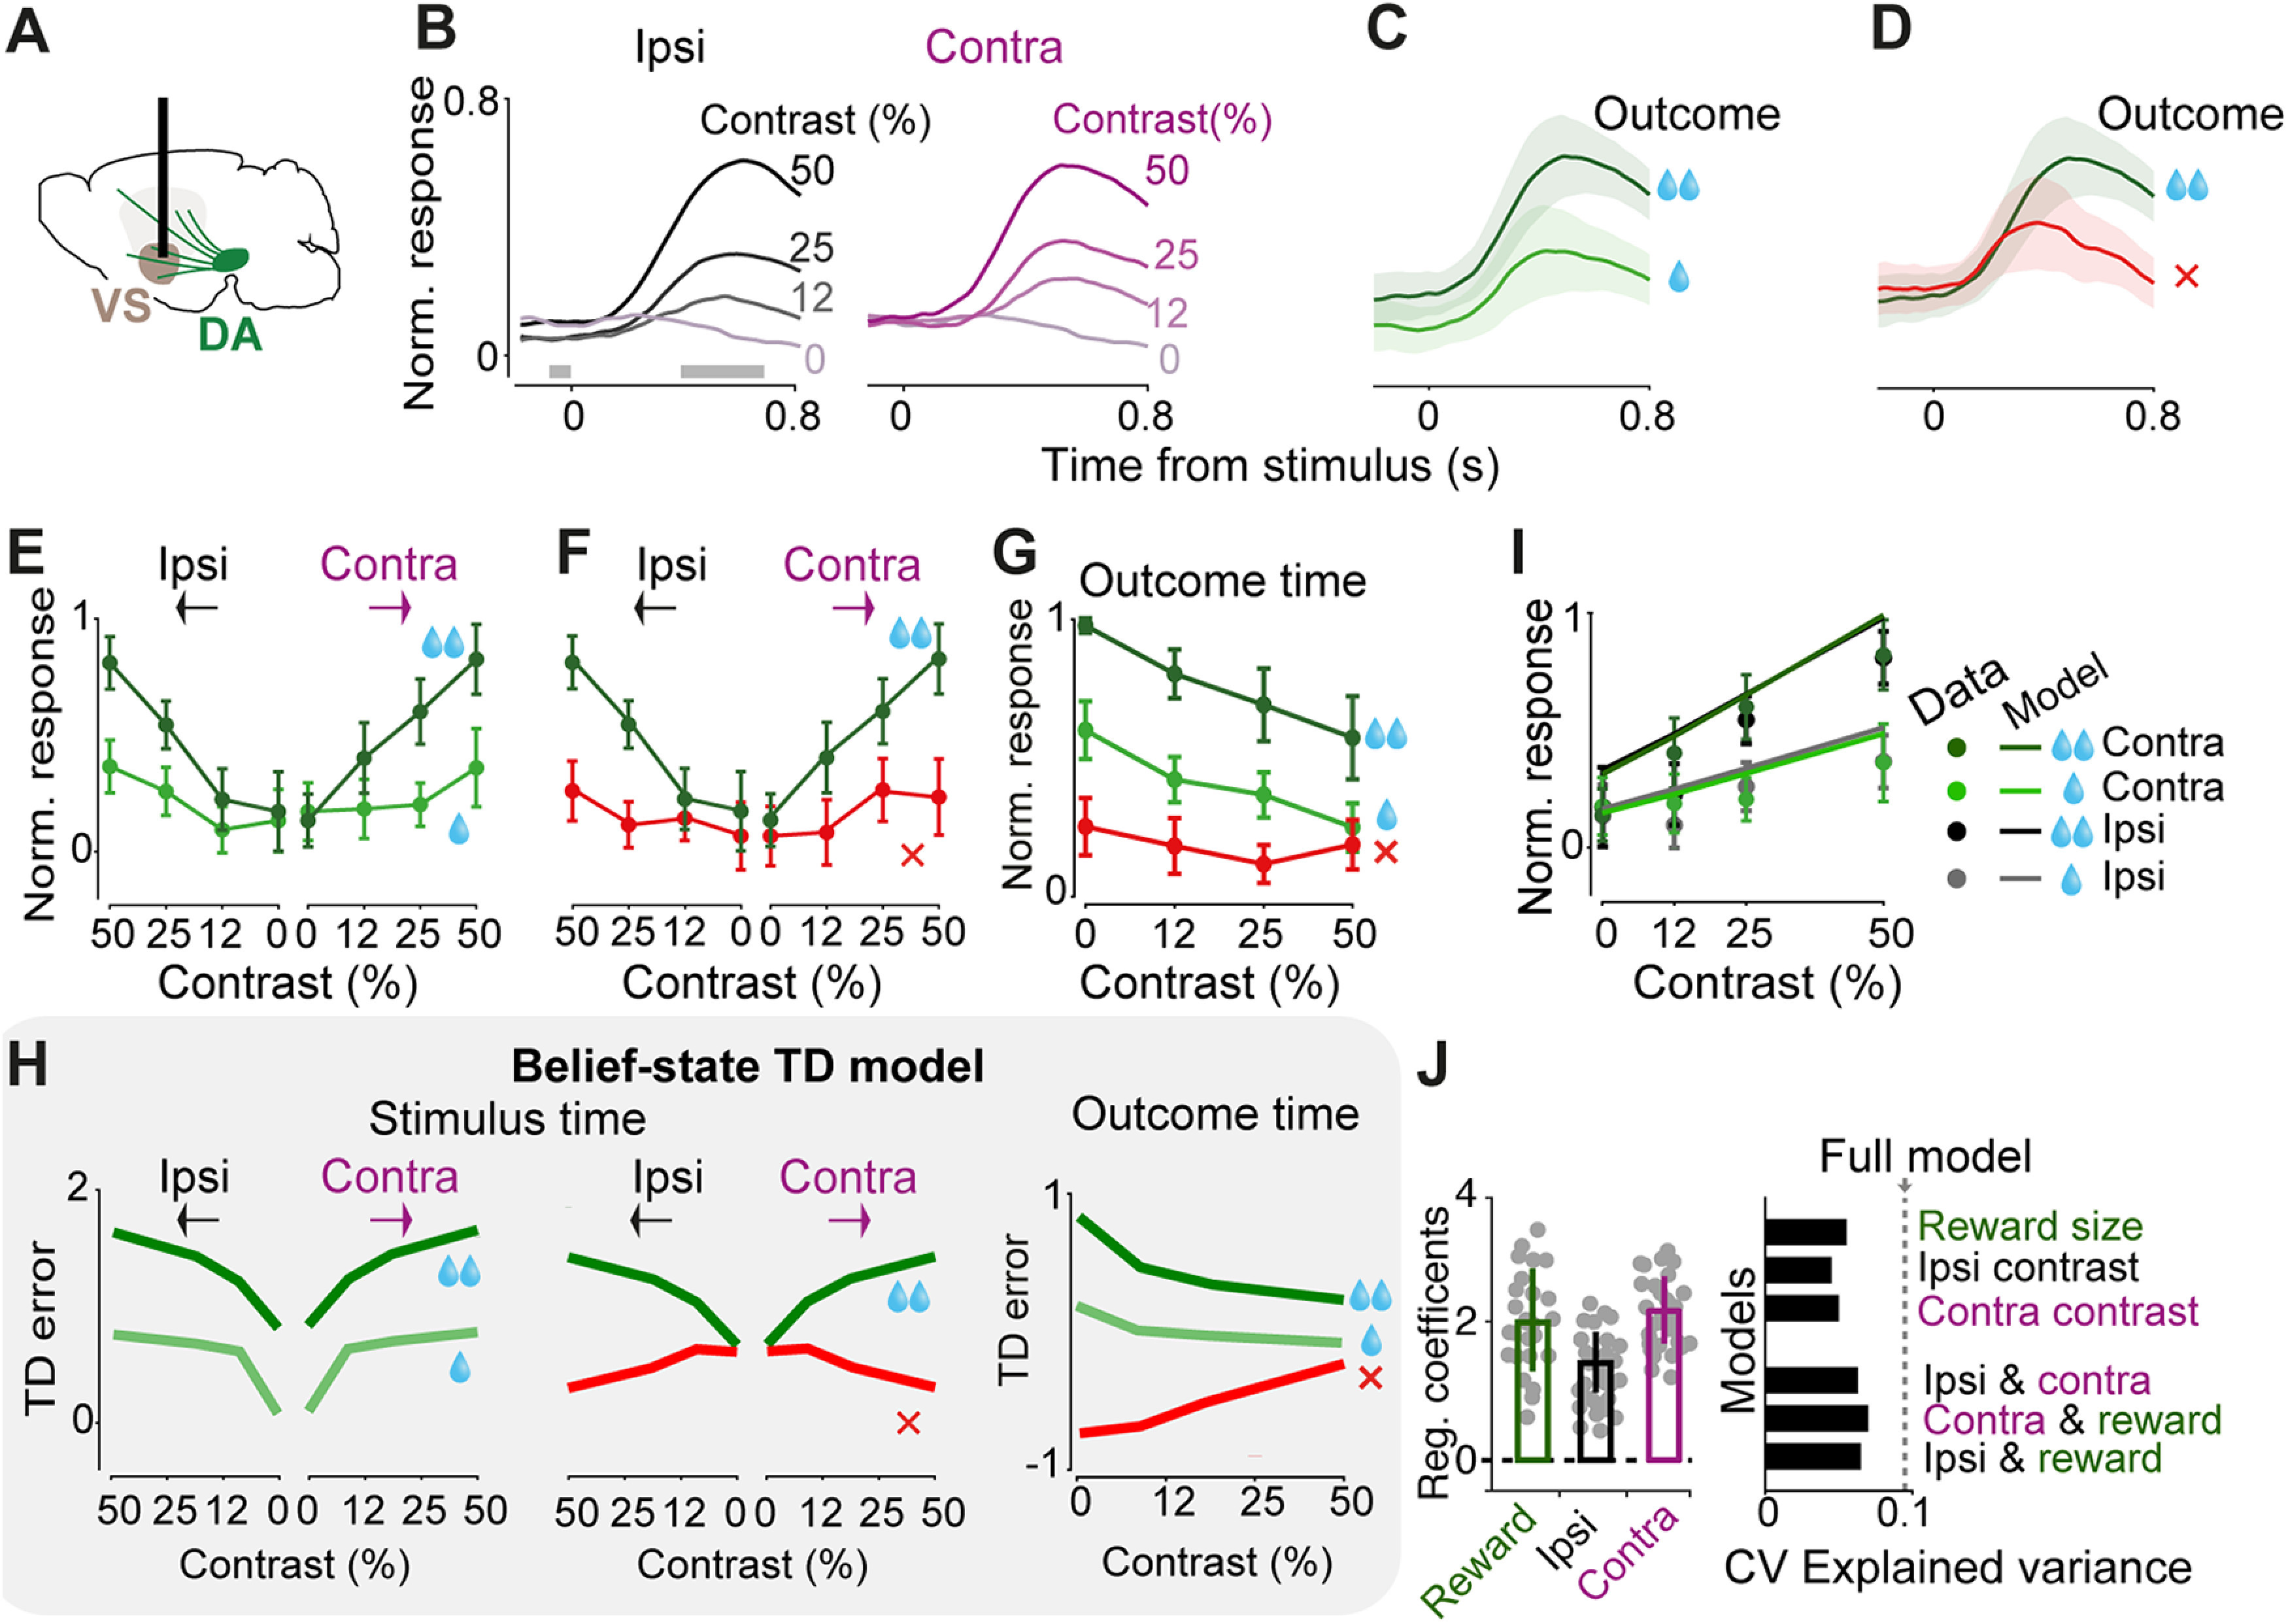
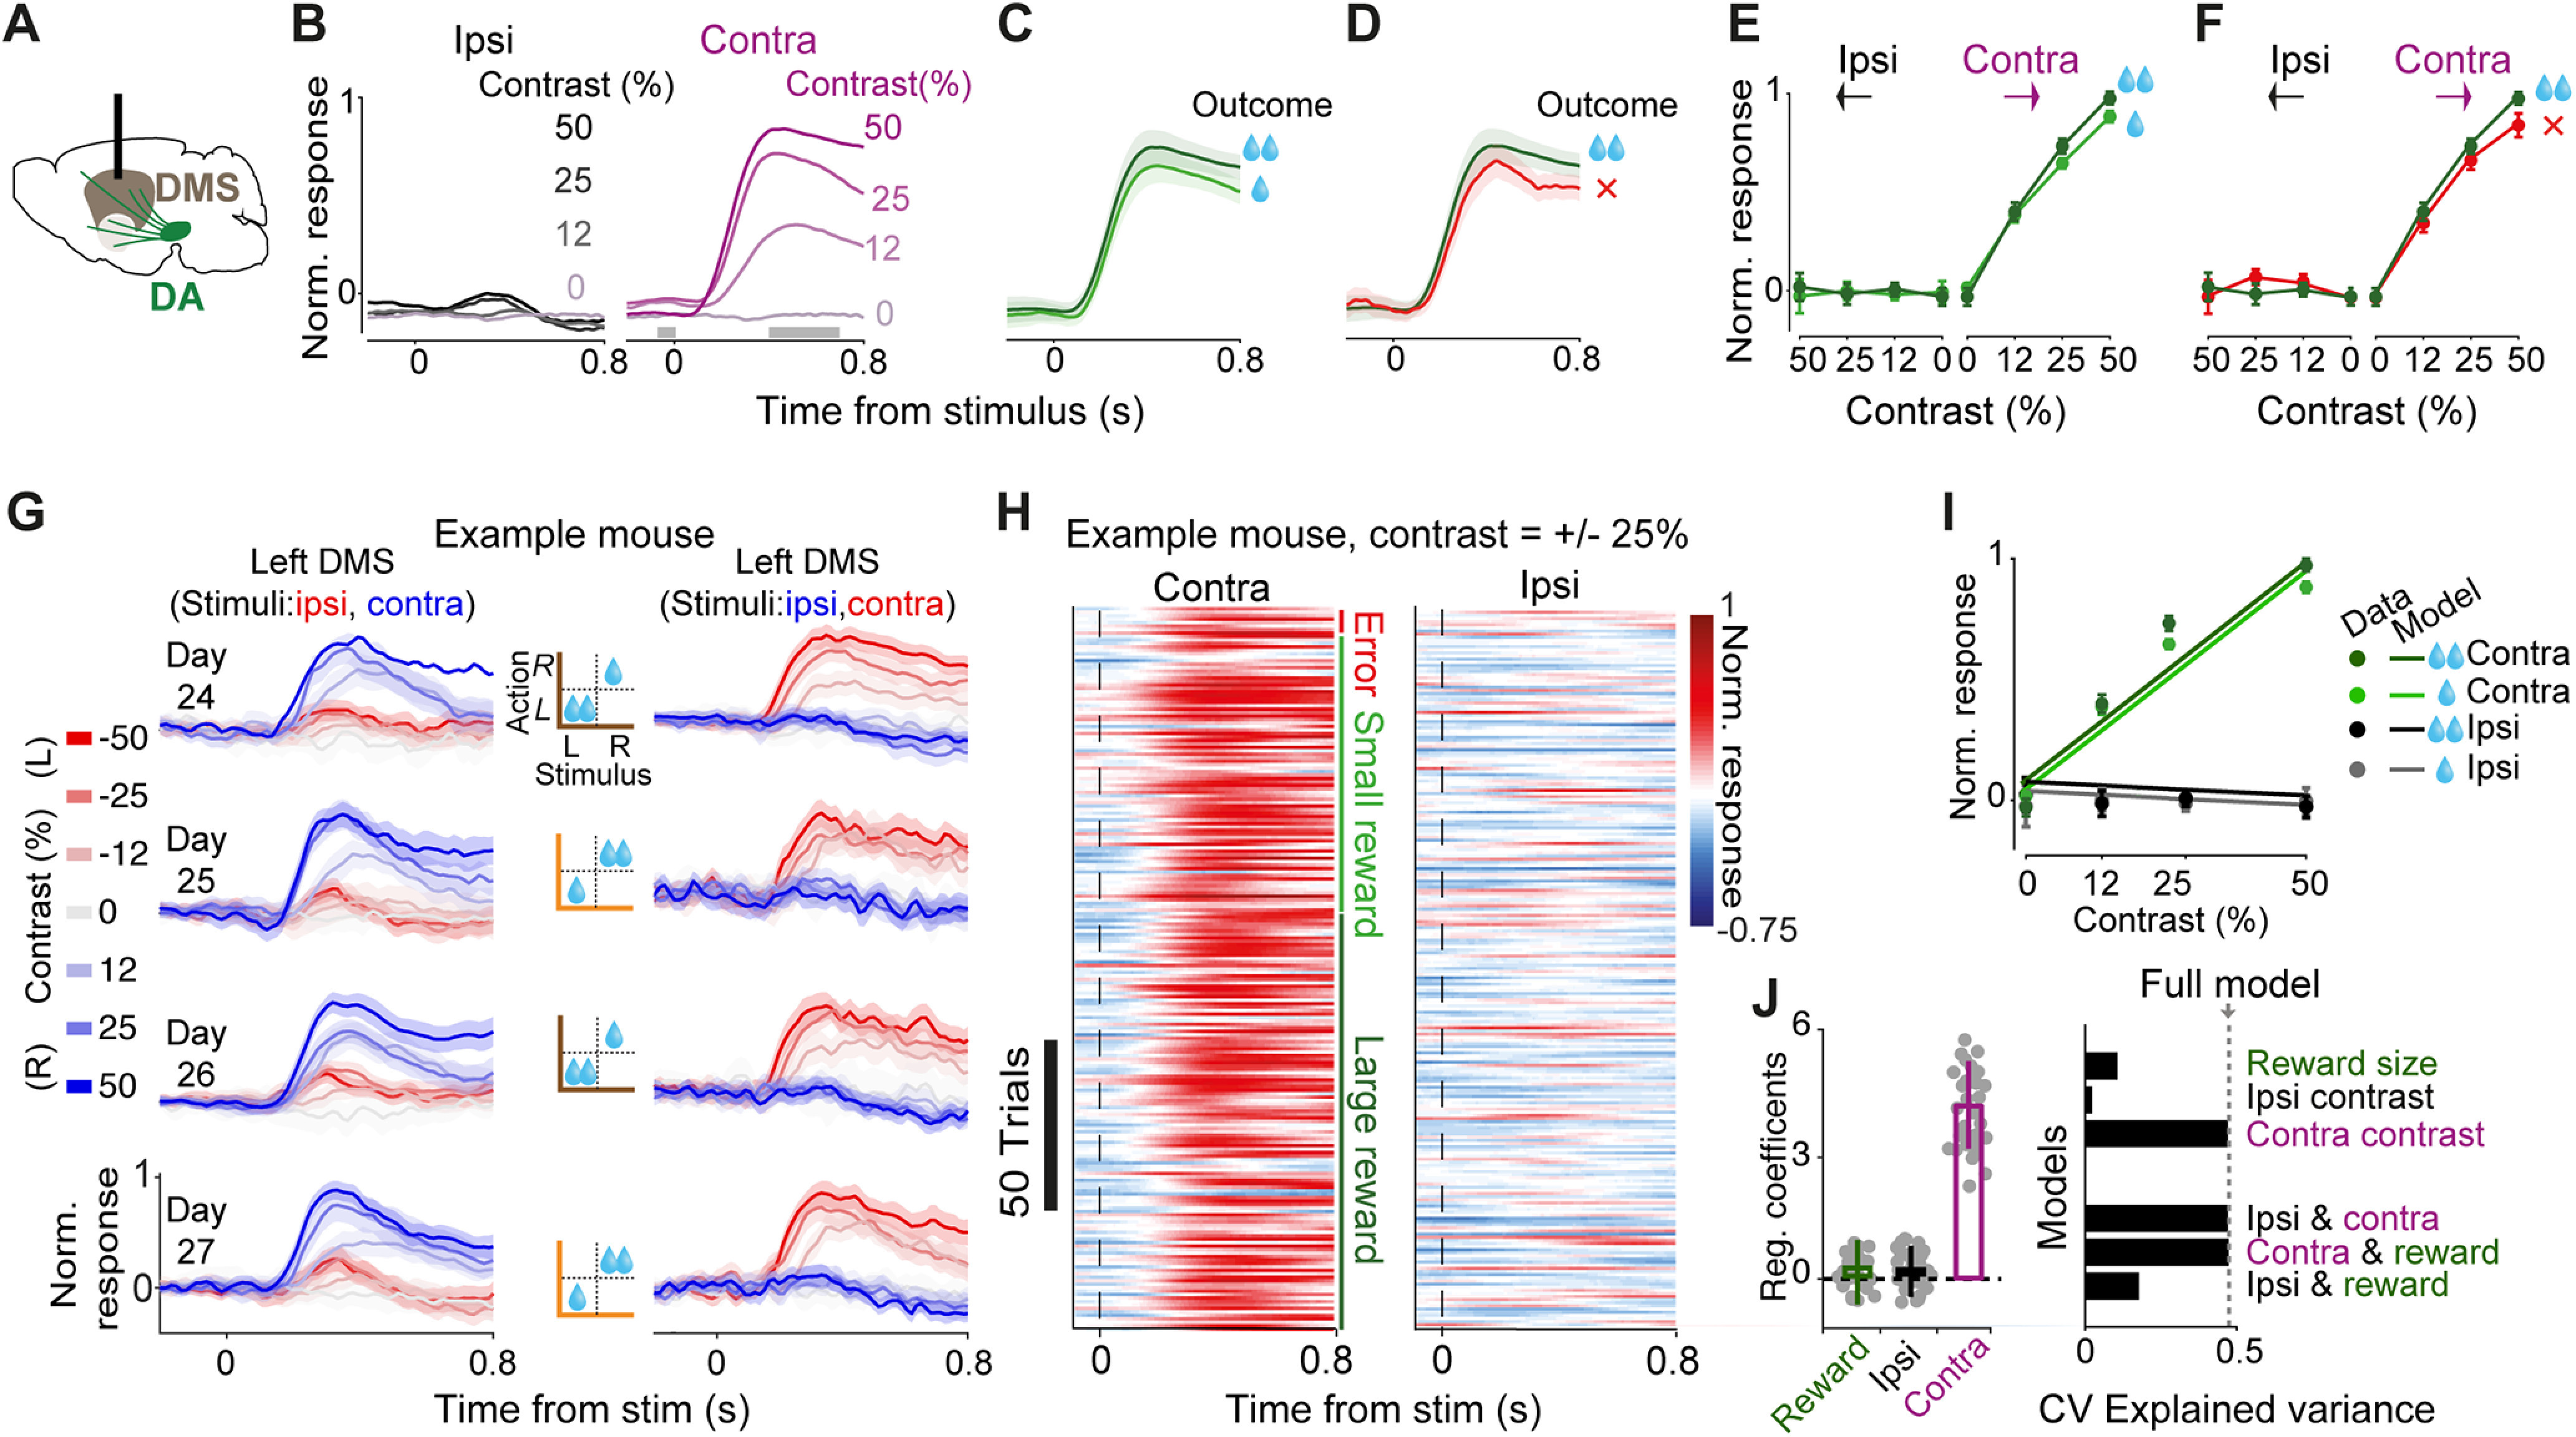
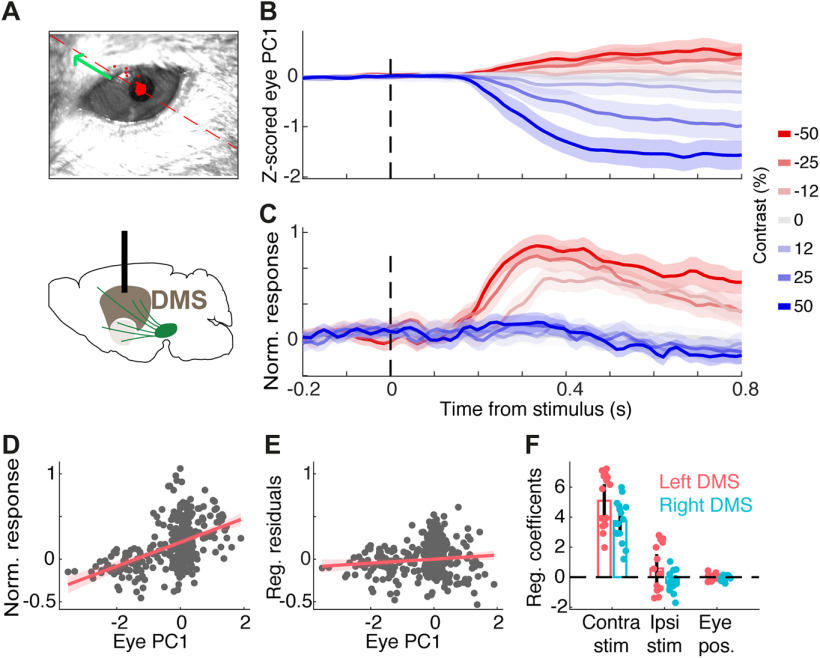
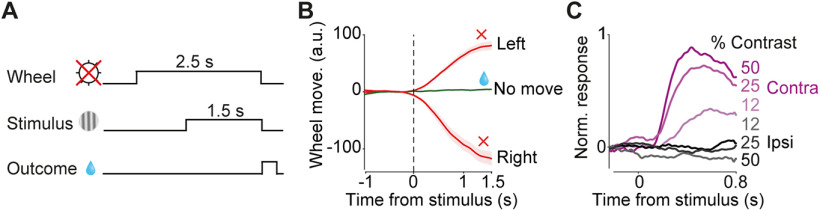
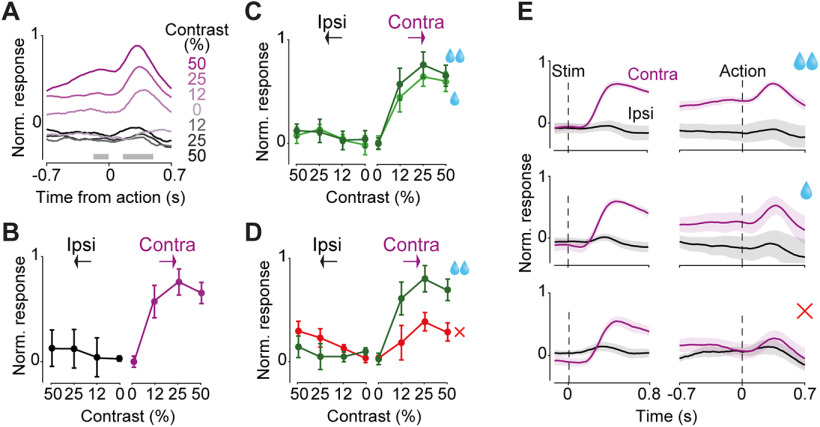
The striatum plays critical roles in visually-guided decision-making and receives dense axonal projections from midbrain dopamine neurons. However, the roles of striatal dopamine in visual decision-making are poorly understood. We trained male and female mice to perform a visual decision task with asymmetric reward payoff, and we recorded the activity of dopamine axons innervating striatum. Dopamine axons in the dorsomedial striatum (DMS) responded to contralateral visual stimuli and contralateral rewarded actions. Neural responses to contralateral stimuli could not be explained by orienting behavior such as eye movements. Moreover, these contralateral stimulus responses persisted in sessions where the animals were instructed to not move to obtain reward, further indicating that these signals are stimulus-related. Lastly, we show that DMS dopamine signals were qualitatively different from dopamine signals in the ventral striatum (VS), which responded to both ipsilateral and contralateral stimuli, conforming to canonical prediction error signaling under sensory uncertainty. Thus, during visual decisions, DMS dopamine encodes visual stimuli and rewarded actions in a lateralized fashion, and could facilitate associations between specific visual stimuli and actions.SIGNIFICANCE STATEMENT While the striatum is central to goal-directed behavior, the precise roles of its rich dopaminergic innervation in perceptual decision-making are poorly understood. We found that in a visual decision task, dopamine axons in the dorsomedial striatum (DMS) signaled stimuli presented contralaterally to the recorded hemisphere, as well as the onset of rewarded actions. Stimulus-evoked signals persisted in a no-movement task variant. We distinguish the patterns of these signals from those in the ventral striatum (VS). Our results contribute to the characterization of region-specific dopaminergic signaling in the striatum and highlight a role in stimulus-action association learning.

Keywords: dopamine; dorsal striatum; mice; sensory uncertainty; ventral striatum; visual decision.


Figures

Figure 1.
Figure 1.
Imaging striatal dopamine axons during decisions requiring integration of sensory evidence and reward value. A, Task schematic. Mice were head-fixed in front of a screen displaying grating stimuli on the left or right side. Mice were rewarded with water for turning a steering wheel to bring the grating stimulus into the center. B, Task timeline. C, Reward size changed in blocks of 100–500 trials with larger reward available on either right (orange) or left (brown) correct choices. D, Left, Average psychometric curves of an example mouse (12 sessions), showing probability of choosing the stimulus on the right as a function of contrast on the left (L) or right (R), in the two asymmetric reward conditions (orange vs brown). Right, Population psychometric curves. E, Schematic of AAV-Flex-GCaMP6 injection into the midbrain of DAT-Cre mice and implantation of optic fiber above the VS or DMS. F, Left, Histologic slide showing GCaMP expression (green) and position of optic fiber in the VS of an example animal. Right, Estimated position of fiber optic tips. G, The same as F but for DMS.
Figure 2.
Figure 2.
VS dopamine axons respond to both contralateral and ipsilateral visual stimuli and encode confidence-dependent prediction errors. A, Schematic showing imaging of VS dopamine axons. B, Normalized fluorescence following stimulus onset, separated by the contrast of grating stimulus presented ipsilaterally (left) or contralaterally (right). Fluorescence was normalized and averaged across mice (n = 4; see Materials and Methods). Only correct trials that resulted in large reward are shown. Horizontal gray bars indicate the window used for the analyses in E, F. C, Same as B, for trials where a high-contrast (50%) contralateral stimulus was followed by correct choices leading to large (dark green) versus small (light green) rewards. Shaded regions in this and subsequent figures show SEM across mice. D, Same as C, for trials in which the choices were directed toward the larger-reward side correctly (dark green) or incorrectly (red). E, Average VS dopamine responses to stimuli as a function of stimulus contrast, separated by stimulus side and reward size. Responses reflect the difference in mean z-scored responses before and after stimulus onset (in the windows shown in B), normalized to the maximum response of each mouse, and then averaged across mice (see Materials and Methods). F, As in E but separated by trial outcome. G, Quantification of VS dopamine responses at the time of trial outcome (averaged across recordings from both hemispheres) separated based on the trial stimulus contrast and trial outcome. H, Schematic showing prediction errors of a TD model that incorporates sensory decision confidence (i.e., subjective probability that the choice will be correct given the percept), adapted from Lak et al. (2020). The TD errors at the time of stimuli and outcomes are scaled by the stimulus contrast, error/correct as well as the reward size, resembling VS dopamine responses shown in EG. I, Lines are the fit of a regression model that includes contrast of both ipsilateral and contralateral stimuli and reward size (see Materials and Methods). Circles are normalized responses to stimulus onset (averaged across mice). J, Left, Average regression coefficients of the full model. Each dot is a session, and error bars are SEM across sessions. Right, Cross-validated regression analysis on stimulus responses. Dotted line indicates cross-validated proportion of explained variance by the full regression model. Top bars indicate explained variance of a reduced model consisting only of reward size, contrast of ipsilateral or contralateral stimulus. Bottom bars indicate explained variance of reduced models each including two regressors. Hence the full model is necessary to account for the neural data.
Figure 3.
Figure 3.
DMS Dopamine axons respond to contralateral but not ipsilateral visual stimuli. A, Schematic showing imaging of DMS dopamine axons. B, Normalized fluorescence following stimulus onset, separated by the contrast of grating stimuli presented ipsilaterally (left) or contralaterally (right). Fluorescence was normalized and averaged across mice (n = 5). Only correct trials that resulted in large reward are shown. C, Same as B, for trials where a high-contrast (50%) contralateral stimulus was followed by correct choices leading to large (dark green) versus small (light green) rewards. D, Same as C, for trials in which the choices were directed toward the large-reward side correctly (dark green) or incorrectly (red). E, Average DMS dopamine responses as a function of stimulus contrast, separated by stimulus side and reward size. Responses reflect the difference in mean z-scored responses before and after stimulus onset (in the windows shown in B), normalized to the maximum response of each mouse, and then averaged across mice. F, As in E but separated by trial outcome. G, DMS dopamine responses following stimulus onset recorded bilaterally in four consecutive sessions of an example mouse. Left column shows recordings in the left DMS, hence stimuli presented on the left and right side of the screen are ipsilateral and contralateral respectively (and vice versa for recordings shown on the right column). Middle column shows reward contingency in each recorded session. Only rewarded trials are shown. Error bars are SEM across trials. H, Trial-by-trial normalized responses in an example mouse for all trials in which the contrast of the stimulus was 25% either on the left or the right side. Trials are separated based on the trial outcome (error, small reward or large reward). I, Circles are normalized mean responses to stimulus onset, averaged across mice. Lines are predictions of the trial-by-trial regression model that only included contralateral stimulus contrast as a regressor (see Materials and Methods). J, Left, Average regression coefficients of the full model, including the contrast of ipsilateral and contralateral stimuli as well as the size of pending reward. Each dot is a session, and error bars are SEM across sessions. Right, Cross-validated regression analysis on stimulus responses. Dotted line indicates cross-validated explained variance by the full regression model. Top bars indicate explained variance of a reduced model consisting only of reward size, contrast of ipsilateral or contralateral stimulus. Bottom bars indicate explained variance of reduced models each including two regressors. Hence, the model that only includes the contrast of the contralateral stimuli is sufficient to explain the neural data.
Figure 4.
Figure 4.
DMS dopamine responses to contralateral stimuli cannot be explained by eye movements. A, Top: Example frame of the eye video. The red dashed line and green arrow indicates the positive direction of the first principal component (PC) of 2D eye position. All sessions with eye recordings were of the left eye. Bottom: Schematic of DMS dopamine recording. B, Z-scored first PC of pupil position in an example session. C, Dopamine signals recorded in the right DMS in the same session shown in B. D, The relationship between the first PC of pupil position and neural signals in the example session, before adjusting for the effect of stimulus contrast. Each dot indicates one trial. E, The relationship between the first PC of pupil position and neural signals after regressing out the confounding effect of stimulus contrast, indicating a negligible relationship between eye position and neural activity. F, The regression coefficients separately shown for sessions with left or right DMS dopamine recording in five mice. Each dot is one session and bars indicate averages across sessions. Coefficients of pupil position and ipsilateral stimuli were not significantly different from zero while coefficients of contralateral stimuli were significantly larger than zero (p = 0.96, p = 0.69, and p < 0.00001, respectively).
Figure 5.
Figure 5.
DMS dopamine responses to contralateral stimuli are not because of the task motor requirements. A, Schematic of no-movement task. After a 1.5-s period of no wheel movement, a stimulus appeared on the left or right side of the screen. Mice (n = 3) had to hold the wheel still for a further 1.5 s to receive a reward. B, Wheel position in no-movement, move left, and move right trials averaged across all trials of all sessions. C, Stimulus aligned normalized mean DMS responses in trials in which mice successfully held the wheel still, separated by stimulus contrast.
Figure 6.
Figure 6.
DMS dopamine axons encode specific combinations of stimuli and actions in a lateralized manner. A, Action-aligned signals during correct trials in DMS dopamine axons averaged across mice (n = 5). Gray horizontal bars indicate the analysis window used in the subsequent panels. Note that the difference in responses before the action reflect responses to stimuli that preceded the action onset (Fig. 3B). B, Average change in normalized neural responses after versus before action initiation. Responses reflect the difference in mean responses before and after the action onset (in the windows shown in A), normalized to the maximum response of each mouse, and then averaged across mice (see Materials and Methods). C, Average action-aligned signals separated by size of reward obtained. D, As in C but separated by choice accuracy. E, Summary of DMS dopamine signals during the choice task. Average stimulus responses of contralateral and ipsilateral DA axons in the choice task, separated by reward size and choice accuracy aligned to the stimulus onset (left) and action onset (right). Note that in the correct trials, contralateral action followed contralateral stimulus and in the error trials contralateral action followed ipsilateral stimulus. All panels show responses averaged across n = 5 mice, and error bars are SEM across mice.

References

    1. Balleine BW, Delgado MR, Hikosaka O (2007) The role of the dorsal striatum in reward and decision-making. J Neurosci 27:8161–8165. 10.1523/JNEUROSCI.1554-07.2007 - DOI - PMC - PubMed
    1. Bhagat J, Wells MJ, Harris KD, Carandini M, Burgess CP (2020) Rigbox: an open-source toolbox for probing neurons and behavior. eNeuro 7:ENEURO.0406-19.2020. 10.1523/ENEURO.0406-19.2020 - DOI - PMC - PubMed
    1. Björklund A, Dunnett SB (2007) Dopamine neuron systems in the brain: an update. Trends Neurosci 30:194–202. 10.1016/j.tins.2007.03.006 - DOI - PubMed
    1. Brasted PJ, Humby T, Dunnett SB, Robbins TW (1997) Unilateral lesions of the dorsal striatum in rats disrupt responding in egocentric space. J Neurosci 17:8919–8926. 10.1523/JNEUROSCI.17-22-08919.1997 - DOI - PMC - PubMed
    1. Brown VJ, Robbins TW (1989) Deficits in response space following unilateral striatal dopamine depletion in the rat. J Neurosci 9:983–989. 10.1523/JNEUROSCI.09-03-00983.1989 - DOI - PMC - PubMed

Publication types

LinkOut - more resources