. 2021 Jul 12;12(1):4245.
doi: 10.1038/s41467-021-24499-6.

TSC2 regulates lysosome biogenesis via a non-canonical RAGC and TFEB-dependent mechanism

Affiliations

TSC2 regulates lysosome biogenesis via a non-canonical RAGC and TFEB-dependent mechanism

Nicola Alesi et al. Nat Commun. .

Abstract

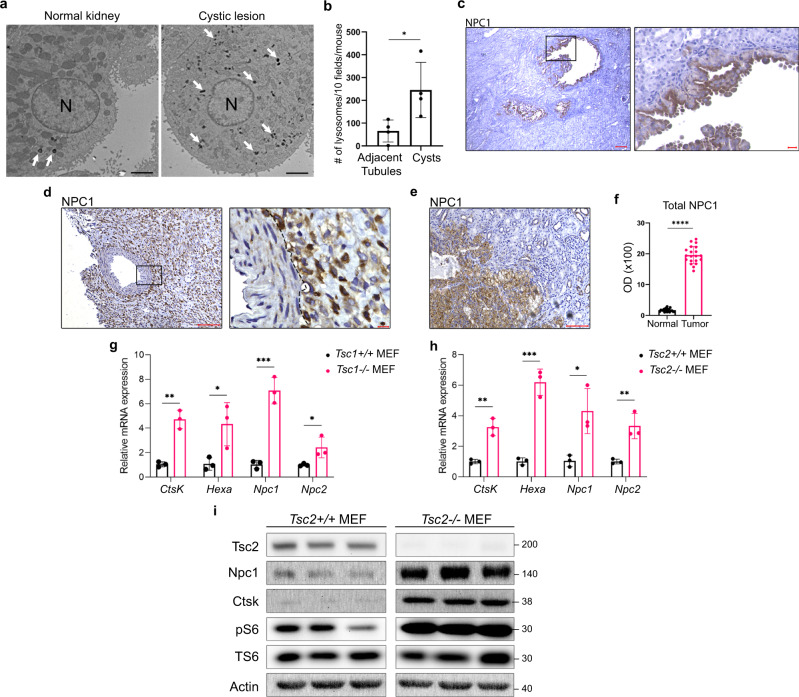
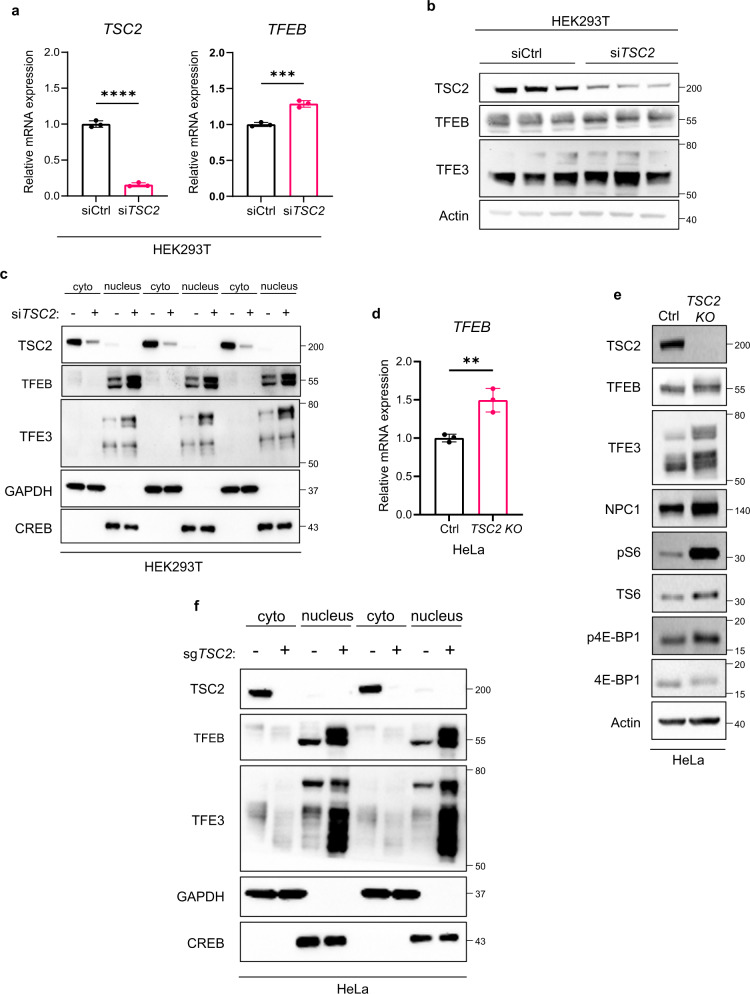
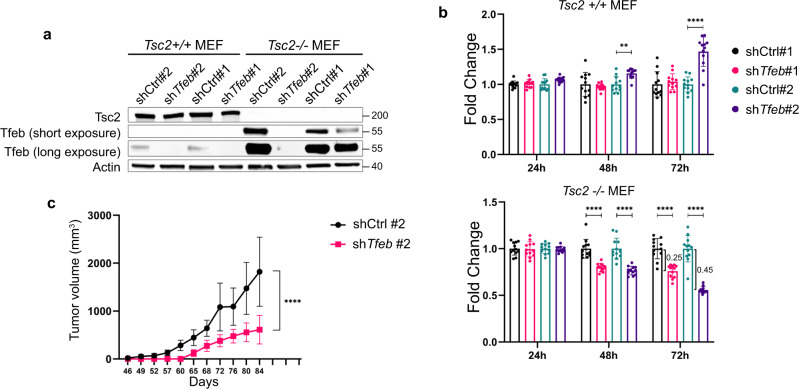
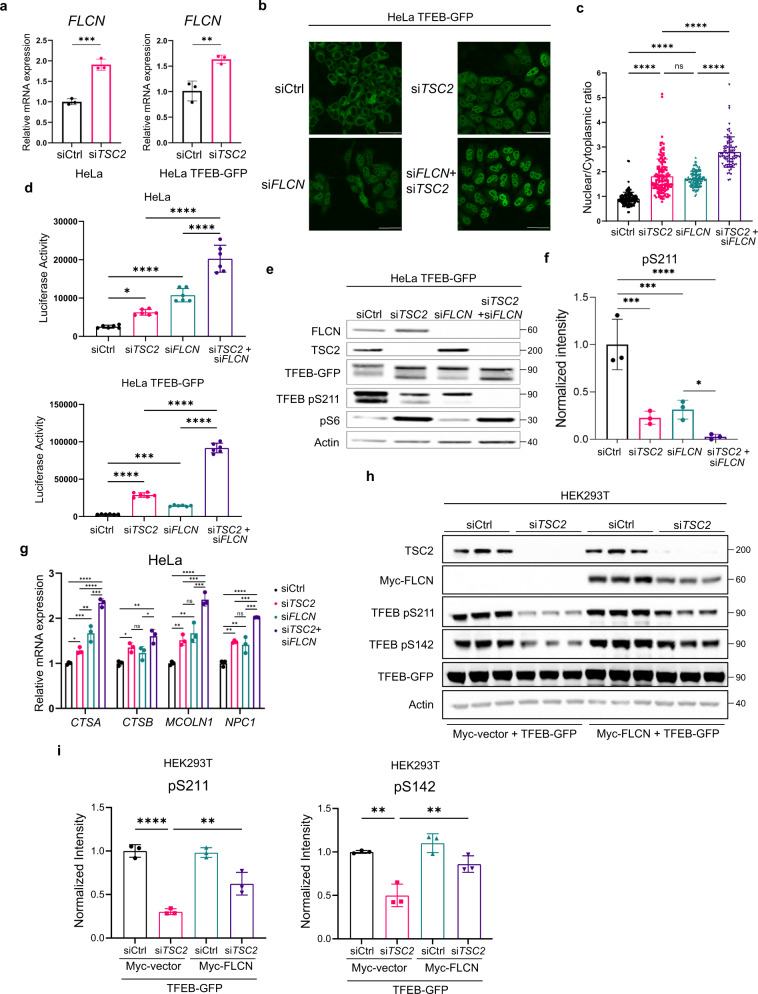
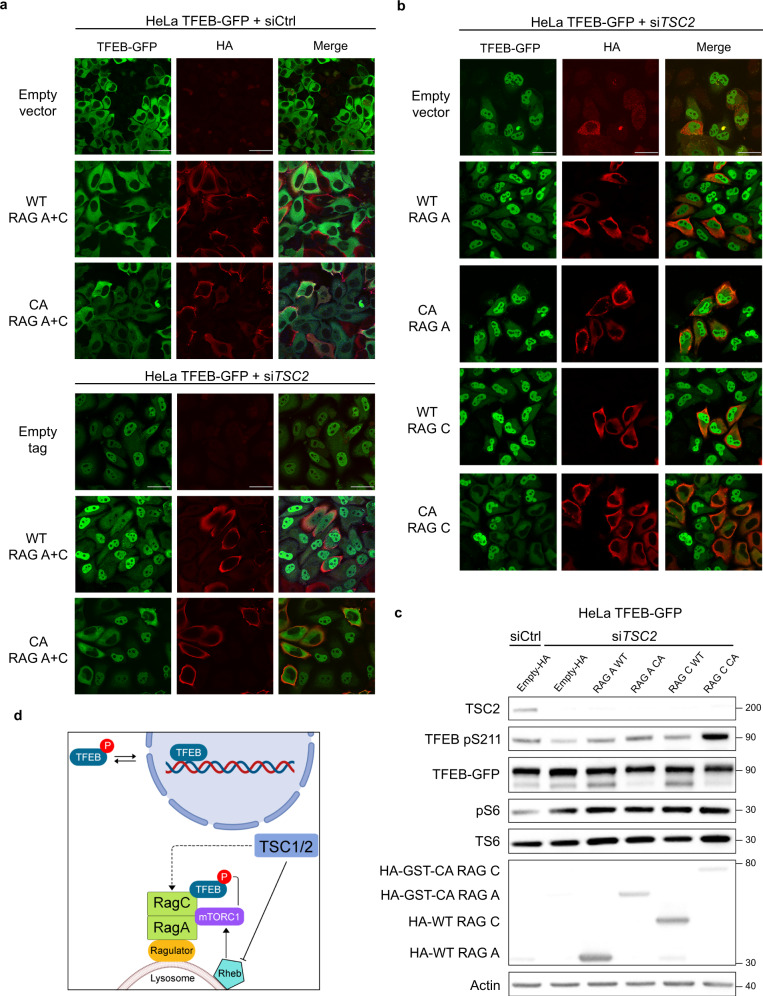
Tuberous Sclerosis Complex (TSC) is caused by TSC1 or TSC2 mutations, resulting in hyperactivation of the mechanistic target of rapamycin complex 1 (mTORC1). Transcription factor EB (TFEB), a master regulator of lysosome biogenesis, is negatively regulated by mTORC1 through a RAG GTPase-dependent phosphorylation. Here we show that lysosomal biogenesis is increased in TSC-associated renal tumors, pulmonary lymphangioleiomyomatosis, kidneys from Tsc2+/- mice, and TSC1/2-deficient cells via a TFEB-dependent mechanism. Interestingly, in TSC1/2-deficient cells, TFEB is hypo-phosphorylated at mTORC1-dependent sites, indicating that mTORC1 is unable to phosphorylate TFEB in the absence of the TSC1/2 complex. Importantly, overexpression of folliculin (FLCN), a GTPase activating protein for RAGC, increases TFEB phosphorylation at the mTORC1 sites in TSC2-deficient cells. Overexpression of constitutively active RAGC is sufficient to relocalize TFEB to the cytoplasm. These findings establish the TSC proteins as critical regulators of lysosomal biogenesis via TFEB and RAGC and identify TFEB as a driver of the proliferation of TSC2-deficient cells.


Conflict of interest statement

The authors declare no competing interests.

Figures

Fig. 1
Fig. 1. Increased lysosome biogenesis in TSC.
a Transmission electron microscopy representative images showing increased lysosomes (white arrows) in renal cyst-lining cells in 18mo Tsc2+/− mice compared to the normal kidney. N denotes nucleus. Scale bar = 2 µm. b Quantification of lysosomes in 10 fields/kidney in 18mo Tsc2+/− mice cysts and adjacent normal tubules (n = 4 kidneys), p = 0.0285. ce Immunohistochemistry for the lysosomal marker NPC1 in renal cysts from Tsc2+/− mice (n = 6 kidneys), (left image scale bar = 100 µm, right image scale bar = 20 µm) (c), human renal angiomyolipoma (n = 3 patient samples) (left image scale bar = 100 µm, right image scale bar = 10 µm) (d), and TSC-associated renal cell carcinoma (n = 3 patient samples). Scale bar = 100 µm (e). The dashed line in d shows the boundary between angiomyolipoma cells on the right and a blood vessel on the left. f NPC1 optical density quantified for TSC-associated renal cell carcinomas (20 measurements on 5 random areas of tumor and normal adjacent kidney quantified per section in 3 patient samples). g, h qRT-PCR analysis of lysosomal genes in Tsc1+/+ and Tsc1−/− MEFs (g) and Tsc2+/+ and Tsc2−/− MEFs (h), (n = 3 biological replicates per condition). i Immunoblot analysis of the lysosomal proteins NPC1 and Cathepsin K (CTSK) in Tsc2+/+ and Tsc2−/− MEFs (n = 3 biological replicates per condition, samples not contiguous, from the same gel). Graphs are presented as mean ± SD. Statistical analysis in b was performed using the Mann–Whitney U test, *p < 0.05. Statistical analyses in (f), (g), and (h) were performed using two-tailed Students t-test, *p < 0.05, **p < 0.01, ***p < 0.001, ****p < 0.0001. Source data are provided as a Source data file.
Fig. 2
Fig. 2. TSC2 loss induces nuclear localization and increased transcriptional activity of TFEB.
a TFEB is increased and primarily nuclear in TSC-associated renal cell carcinoma. The dashed line shows the boundary between tumor and normal adjacent kidney. Scale bar = 100 µm. b TFEB optical density quantified from a, (15 measurements on 5 random areas of tumor and normal adjacent kidney quantified per section in 3 patient samples). c TFEB is primarily nuclear in human angiomyolipoma compared to blood vessel. The dashed line shows the boundary between tumor cells on the right and a blood vessel on the left. The black arrow indicates nuclear TFEB in a tumor cell. The white arrow indicates cytoplasmic TFEB in the cells of the blood vessel wall (n = 3 patient samples). Left image scale bar = 100 µm, right image scale bar = 10 µm. d, e HeLa-TFEB-GFP cells were transfected with TSC1 or TSC2 siRNA for 72 h and visualized with confocal live imaging. Scale bar = 50 µm (d). The nuclear/cytoplasmic ratio of GFP was quantified using ImageJ as described in methods, (n = 3 random fields per condition, 29 cells for Ctrl siRNA, 30 cells for TSC1 siRNA and 29 cells for TSC2 siRNA were analyzed) (e). f Representative immunoblotting of HeLa-TFEB-GFP cells transfected with Ctrl, TSC1 or TSC2 siRNA for 72 h (n = 3 biological replicates per condition). Blot was analyzed by staining with the indicated antibodies, phospho-S6 (S235/S236) is the indicator of increased mTORC1 activity, NPC1 is the indicator of TFEB transcriptional activity. g Densitometry for phospho TFEB S142 and phospho TFEB S211 was performed using ImageJ and normalized to total TFEB-GFP (n = 3 biological replicates per condition). h Luciferase activity of HeLa and HeLa-TFEB-GFP stably expressing the GPNMB luciferase reporter and transfected with TSC2 or FLCN (as positive control) siRNAs for 72 h (n = 3 biological replicates per condition). Graphs are presented as mean ± SD. Statistical analyses were performed using two-tailed Students t-test or one-way ANOVA if more than two groups, **p < 0.01, ***p < 0.001, ****p < 0.0001. Source data are provided as a Source data file.
Fig. 3
Fig. 3. Endogenous TFEB and TFE3 are enriched in the nucleus of TSC2-deficient HEK293T and HeLa cells.
a qRT-PCR analysis of TSC2 and TFEB expression in HEK293T cells transfected with control or TSC2 siRNA for 72 h (n = 3 biological replicates per condition), p < 0.0001 for TSC2 and p = 0.0008 for TFEB. b Immunoblot analysis (biologic triplicates) of whole-cell lysates of HEK293T cells transfected as in (a) with indicated antibodies and used for fractionation in (c). c Immunoblot analysis (biological triplicates) of TFEB and TFE3 in cytoplasmic (cyto) and nuclear (nucleus) fractions of HEK293T cells transfected as in (a), GAPDH and CREB were used as markers of cytoplasmic and nuclear fraction, respectively. d qRT-PCR analysis of TFEB expression in HeLa cells with non-targeting control (Ctrl) or TSC2 CRISPR knock-out (TSC2 KO) (n = 3 biological replicates), p = 0.0062. e Representative immunoblotting of TFEB and TFE3 in whole-cell lysates of Ctrl and TSC2 KO HeLa cells used for fractionation in (f), with phospho-S6 (S235/S236) and p4E-BP1 (Thr37/46) as indicators of mTORC1 activity and NPC1 as an indicator of TFEB transcriptional activity. f Immunoblotting of TFEB and TFE3 in cytoplasmic (cyto) and nuclear (nucleus) fractions of HeLa Ctrl and TSC2 KO cells, GAPDH and CREB were used as markers of cytoplasmic and nuclear fraction, respectively (n = 3 biological replicates per condition). Graphs are presented as mean ± SD. Statistical analyses were performed using two-tailed Students t-test, **p < 0.01, ***p < 0.001, ****p < 0.0001. Source data are provided as a Source data file.
Fig. 4
Fig. 4. Tfeb downregulation decreases proliferation of Tsc-deficient cells.
a Confirmation of shRNA knockdown of TFEB in Tsc2+/+ and Tsc2−/− MEFs (n = 3 biological replicates per condition). b Proliferation of Tsc2+/+ and Tsc2−/− MEFs with Ctrl or Tfeb shRNA assessed by crystal violet staining (n = 12 biological replicates per condition). c Tumor volume of Tsc2−/− MEFs with Ctrl or Tfeb shRNA#2 subcutaneously injected into immunodeficient mice (n = 10 each group). Graphs are presented as mean ± SD. Statistical analyses were performed using two-tailed Students t-test, **p < 0.01, ****p < 0.0001. Source data are provided as a Source data file.
Fig. 5
Fig. 5. TSC2 and FLCN cooperate in the regulation of TFEB phosphorylation, nuclear translocation, and lysosomal gene expression.
a qRT-PCR analysis of FLCN in HeLa and HeLa-TFEB-GFP cells transfected with Ctrl or TSC2 siRNA for 72 h (n = 3 biological replicates per condition), p = 0.0005 for HeLa and p = 0.007 for HeLa TFEB-GFP cells. b, c HeLa-TFEB-GFP cells were transfected with indicated siRNAs for 72 h and analyzed by confocal imaging after fixation and staining for GFP. Scale bar = 50 µm, b, nuclear/cytoplasmic ratio of TFEB-GFP as quantitated with Cell Profiler is shown in (c) (146 cells were analyzed in Ctrl siRNA, 140 cells in TSC2 siRNA, 120 cells in FLCN siRNA and 88 cells in TSC2+FLCN siRNA were analyzed in n = 3 biological replicates). d Luciferase activity of HeLa and HeLa-TFEB-GFP stably expressing the GPNMB luciferase reporter and transfected with indicated siRNAs for 72 h (n = 6 biological replicates per condition). e, f Representative immunoblotting of phosphorylated TFEB at S211 in HeLa-GFP-TFEB cells after downregulation of TSC2, FLCN, or both analyzed by staining with the indicated antibodies, with phospho-S6 (S235/S236) as an indicator of mTORC1 activity (e), band intensity quantitated using ImageJ and normalized to total TFEB-GFP (n = 3 biological replicates per condition) (f). g Expression of lysosomal genes in HeLa cells after siRNA downregulation for 72 h of TSC2, FLCN, or both (n = 3 biological replicates each condition). h, i Overexpression of myc-FLCN in HEK293T cells with TSC2 downregulation by siRNA increases TFEB-GFP phosphorylation at S211 and S142 (h), band intensity quantitated using ImageJ and normalized to total TFEB-GFP (i) (n = 3 biological replicates). Graphs are presented as mean ± SD. Statistical analyses were performed using two-tailed Students t-test, or one-way ANOVA if more than two groups, *p < 0.05, **p < 0.01, ***p < 0.001, ****p < 0.0001. Source data are provided as a Source data file.
Fig. 6
Fig. 6. Activation of RAGC is sufficient to re-localize TFEB into the cytoplasm in TSC2-deficient cells.
a Immunofluorescent analysis of HeLa-TFEB-GFP cells after siRNA downregulation for 72 h transfected with wild-type (WT) RAGA plus WT RAGC vs. constitutively active (CA) RAGA (RAGA Q66L) plus CA RAGC (RAGC S75N) for 48 h (n = 3 biological replicates per condition). b Immunofluorescent analysis of HeLa-TFEB-GFP cells after TSC2 siRNA downregulation as in (a), and individually transfected with WT RAGA, CA RAGA, WT RAGC, or CA RAGC for 48 h (n = 3 biological replicates per condition). c Representative immunoblot analysis of cells treated as in (b) with indicated antibodies (n = 3 biological replicates per condition). d Working model in which TSC2 regulates TFEB cytoplasmic/nuclear localization via RAGC (created with BioRender.com). Scale bars = 50 µm. Source data are provided as a Source data file.

References

    1. Crino PB, Nathanson KL, Henske EP. The tuberous sclerosis complex. N. Engl. J. Med. 2006;355:1345–1356. doi: 10.1056/NEJMra055323. - DOI - PubMed
    1. Henske EP, Jozwiak S, Kingswood JC, Sampson JR, Thiele EA. Tuberous sclerosis complex. Nat. Rev. Dis. Prim. 2016;2:16035. doi: 10.1038/nrdp.2016.35. - DOI - PubMed
    1. Yang P, et al. Renal cell carcinoma in tuberous sclerosis complex. Am. J. Surgical Pathol. 2014;38:895. doi: 10.1097/PAS.0000000000000237. - DOI - PMC - PubMed
    1. Kim J, Guan K-L. mTOR as a central hub of nutrient signalling and cell growth. Nat. Cell Biol. 2019;21:63–71. doi: 10.1038/s41556-018-0205-1. - DOI - PubMed
    1. Yecies JL, Manning BD. mTOR links oncogenic signaling to tumor cell metabolism. J. Mol. Med. 2011;89:221–228. doi: 10.1007/s00109-011-0726-6. - DOI - PubMed

Publication types

MeSH terms

Substances