. 2021 Jul 12;12(1):4250.
doi: 10.1038/s41467-021-24378-0.

Profiling variable-number tandem repeat variation across populations using repeat-pangenome graphs

Collaborators, Affiliations

Profiling variable-number tandem repeat variation across populations using repeat-pangenome graphs

Tsung-Yu Lu et al. Nat Commun. .

Abstract

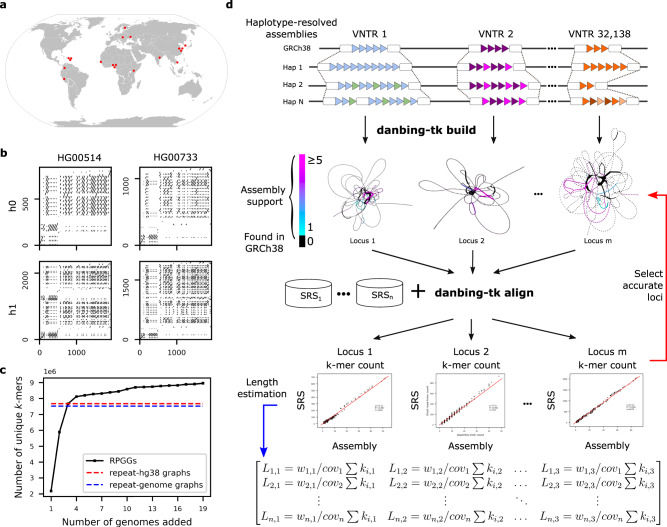
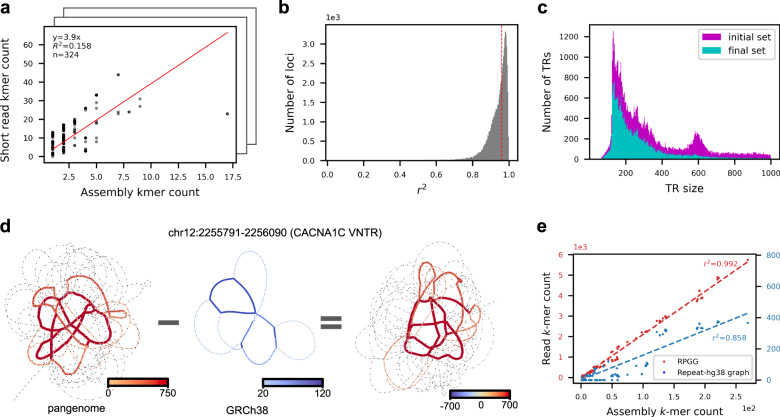
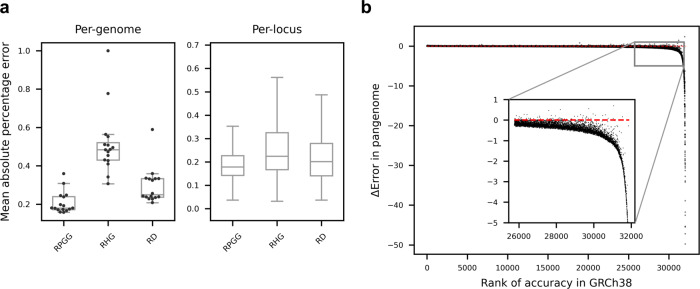
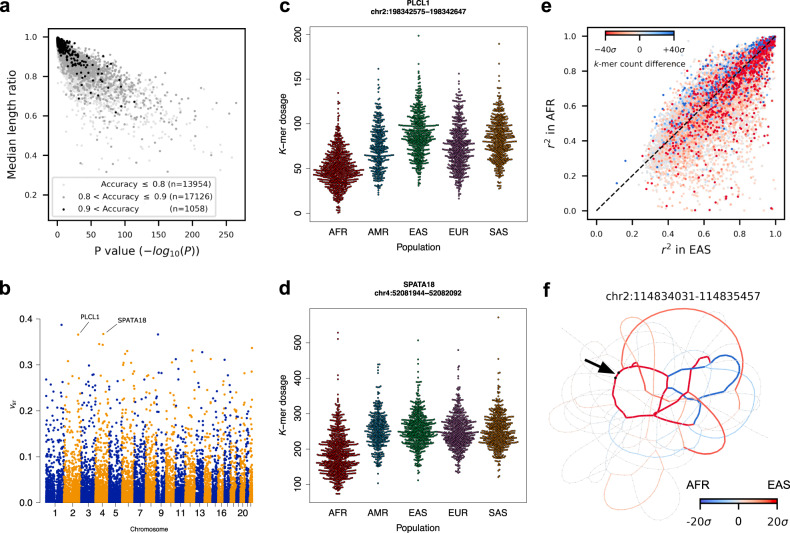
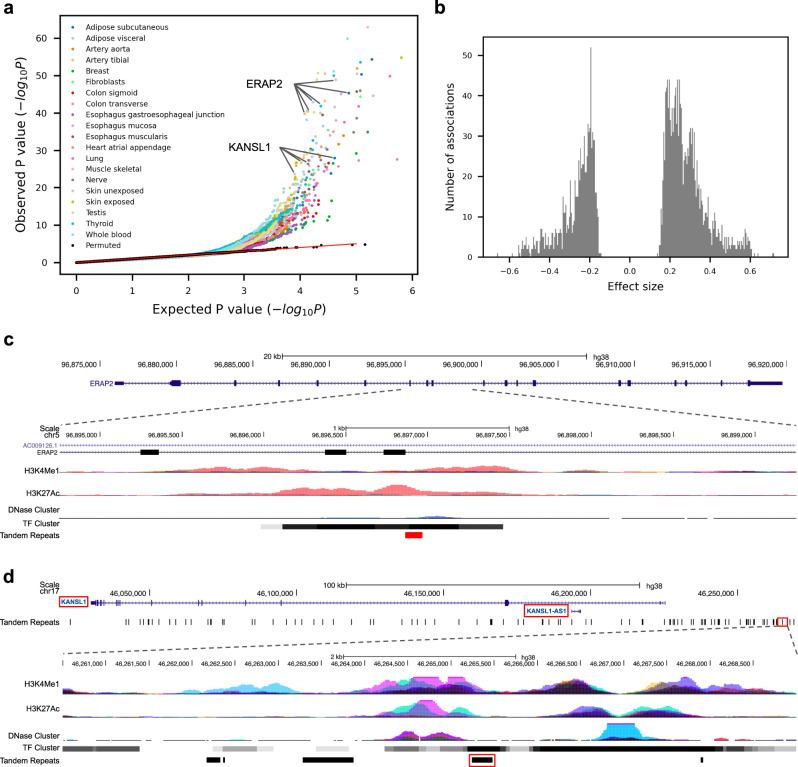
Variable number tandem repeats (VNTRs) are composed of consecutive repetitive DNA with hypervariable repeat count and composition. They include protein coding sequences and associations with clinical disorders. It has been difficult to incorporate VNTR analysis in disease studies that use short-read sequencing because the traditional approach of mapping to the human reference is less effective for repetitive and divergent sequences. In this work, we solve VNTR mapping for short reads with a repeat-pangenome graph (RPGG), a data structure that encodes both the population diversity and repeat structure of VNTR loci from multiple haplotype-resolved assemblies. We develop software to build a RPGG, and use the RPGG to estimate VNTR composition with short reads. We use this to discover VNTRs with length stratified by continental population, and expression quantitative trait loci, indicating that RPGG analysis of VNTRs will be critical for future studies of diversity and disease.


Conflict of interest statement

The authors declare no competing interests.

Figures

Fig. 1
Fig. 1. Sequence diversity of VNTRs in human populations.
a Global diversity of long-read assemblies. b Dot-plot analysis of the VNTR locus chr1:2280569–2282538 (SKI intron 1 VNTR) in genomes that demonstrate varying motif usage and length. c Diversity of RPGG as genomes are incorporated, measured by the number of k-mers in the 32,138 VNTR graphs. Total graph size built from GRCh38 and an average genome are also shown. d Danbing-tk workflow analysis. (top) VNTR loci defined from the reference are used to map haplotype loci. Each locus is converted to a de Bruijn graph, from which the collection of graphs is the RPGG. The de Bruijn graphs shown illustrate sequences missing from the RPGG built only on GRCh38. The alignments may be either used to select which loci may be accurately mapped in the RPGG using SRS that match the assemblies (red), or may be used to estimate lengths on sample datasets (blue). Source data are provided as a Source Data file.
Fig. 2
Fig. 2. Mapping short reads to repeat-pangenome graphs.
a An example of evaluating the alignment quality of a locus mapped by SRS reads. The alignment quality is measured by the r2 of a linear fit between the k-mer counts from the ground truth assemblies and from the mapped reads (Methods). b Distribution of the alignment quality scores of 73,582 loci. Loci with alignment quality less than 0.96 when averaged across samples are removed from downstream analysis (Methods). c Distribution of VNTR lengths in GRCh38 removed or retained for downstream analysis. d, e Comparing the read mapping results of the CACNA1C VNTR using RPGG or repeat-GRCh38. d The k-mer counts in each graph and the differences are visualized with edge width and color saturation. To visualize paths with less mapped reads, k-mer counts are clipped at 750 (left), 120 (middle), and 700 (right), respectively, with the maximal k-mer count of each graph being 5744, 375, and 5378, respectively. e The k-mer counts from the ground truth assemblies are regressed against the counts from reads mapped to the RPGG (red) and repeat-GRCh38 (blue), respectively. Source data are provided as a Source Data file.
Fig. 3
Fig. 3. VNTR length prediction.
a Accuracies of VNTR length-prediction measured for each genome (left; n = 16) and each locus (right; n = 32,138). Mean absolute percentage error (MAPE) in VNTR length is averaged across loci and genomes, respectively. Lengths were predicted based on repeat-pangenome graphs (RPGG), repeat-GRCh38 (RHG) or naive read depth method (RD), respectively. Boxes span from the lower quartile to the upper quartile, with horizontal lines indicating the median. Whiskers extend to points that are within 1.5 interquartile range (IQR) from the upper or the lower quartiles. b Relative performance of RPGG versus repeat-GRCh38. Loci are ordered along the x-axis by genotyping accuracy in repeat-GRCh38. The y-axis shows the decrease in MAPE using RPGG versus repeat-GRCh38. The subplot shows loci poorly genotyped (MAPE > 0.4) in repeat-GRCh38. The red dotted line indicates the baseline without any improvement. the counts from reads mapped to the RPGG (red) and repeat-GRCh38 (blue), respectively. Source data are provided as a Source Data file.
Fig. 4
Fig. 4. Population properties of VNTR loci.
a Ratios of median length between populations for loci with significant differences in average length. Loci are stratified by accuracy prediction (<0.8), medium (0.8–0.9), and high (0.9+). b Manhattan plot of VST values. c, d The distribution of estimated length via k-mer dosage in continental populations for PLCL1 and SPATA18 VNTR loci, selected to visualize the distribution of dosage in different populations. Each point is an individual. e Differential usage and expansion of motifs between the EAS and AFR populations. For each locus, the proportion of variance explained by the most informative k-mer in the EAS is shown for the EAS and AFR populations on the x- and y-axes, respectively. Points are colored by the difference in normalized k-mer counts, with red and blue indicating k-mers more abundant in EAS and AFR populations, respectively. f An example VNTR with differential motif usage. Edges are colored if the k-mer count is biased toward a certain population. The black arrow indicates the location of the k-mer that explains the most variance of VNTR length in the EAS population. Source data are provided as a Source Data file.
Fig. 5
Fig. 5. cis-eQTL mapping of VNTRs.
a eVNTR discoveries in 20 human tissues. The quantile-quantile plot shows the observed P-value of each association test (two-sided t-test) versus the P-value drawn from the expected uniform distribution. Black dots indicate the permutation results from the top 5% associated (gene, VNTR) pairs in each tissue. The regression plots for ERAP2 and KANSL1 are shown in c and d. b Effect size distribution (n = 2510) of significant associations from all tissues. c, d Genomic view of disease-related (eGene,eVNTR) pairs (ERAP2, chr5:96896863–96896963) (c) and (KANSL1, chr17:46265245–46265480) (d) are shown. Red boxes indicate the location of eGenes and eVNTRs.

References

    1. Consortium IHGS, International Human Genome Sequencing Consortium. Initial sequencing and analysis of the human genome. Nature. 2001;409:860–921. doi: 10.1038/35057062. - DOI - PubMed
    1. Viguera E, Canceill D, Ehrlich SD. Replication slippage involves DNA polymerase pausing and dissociation. EMBO J. 2001;20:2587–2595. doi: 10.1093/emboj/20.10.2587. - DOI - PMC - PubMed
    1. Gatchel JR, Zoghbi HY. Diseases of unstable repeat expansion: mechanisms and common principles. Nat. Rev. Genet. 2005;6:743–755. doi: 10.1038/nrg1691. - DOI - PubMed
    1. Hannan AJ. Tandem repeats mediating genetic plasticity in health and disease. Nat. Rev. Genet. 2018;19:286–298. doi: 10.1038/nrg.2017.115. - DOI - PubMed
    1. Mallick S, et al. The Simons Genome Diversity Project: 300 genomes from 142 diverse populations. Nature. 2016;538:201–206. doi: 10.1038/nature18964. - DOI - PMC - PubMed

Publication types