. 2021 Jul 12;11(1):14269.
doi: 10.1038/s41598-021-93774-9.

Influence of heart rate correction formulas on QTc interval stability

Affiliations

Influence of heart rate correction formulas on QTc interval stability

Irena Andršová et al. Sci Rep. .

Abstract

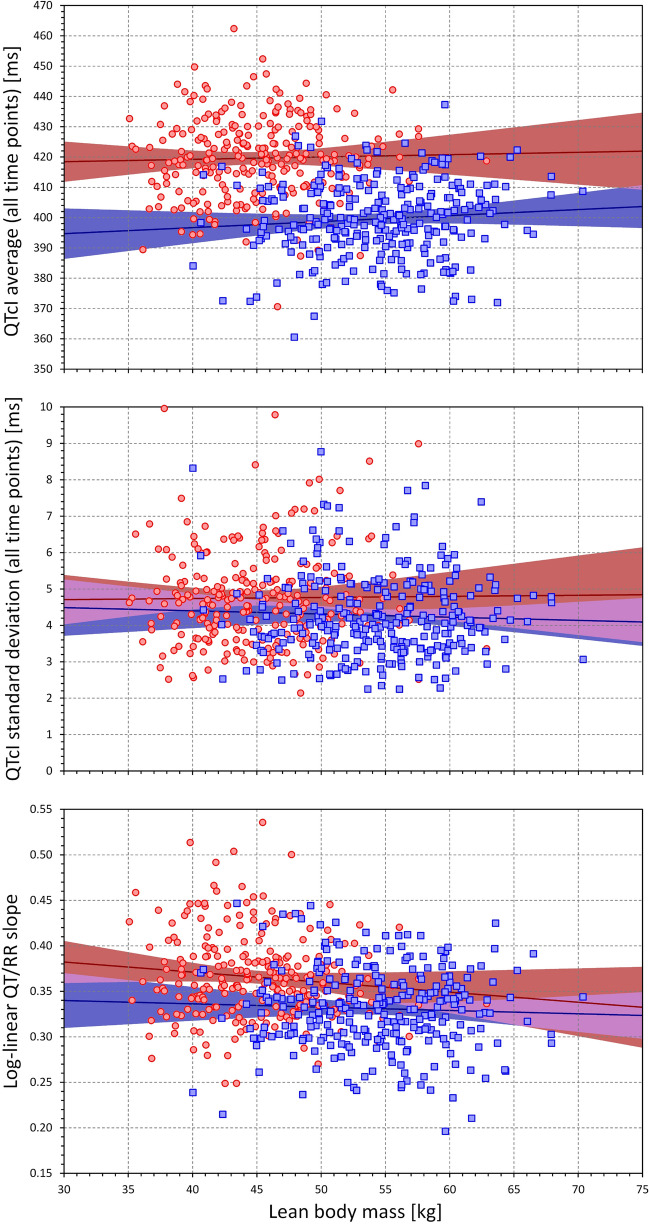
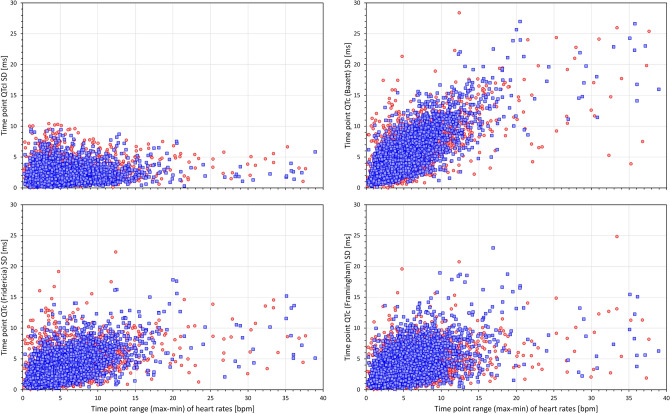
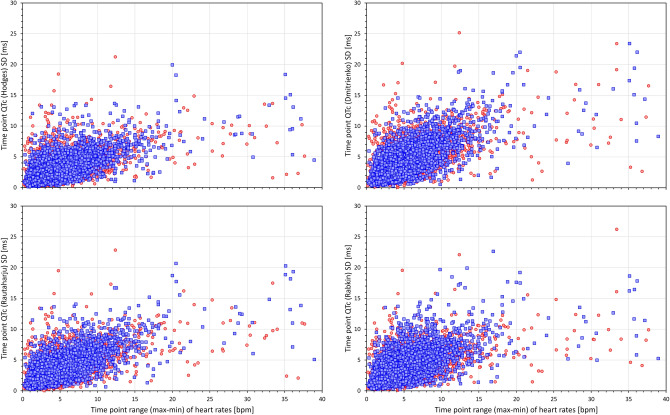
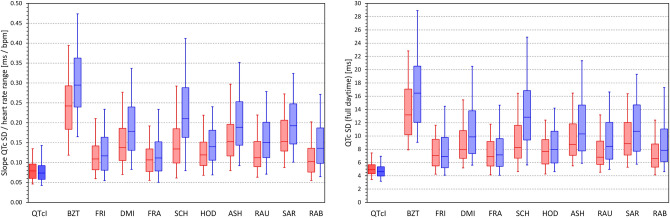
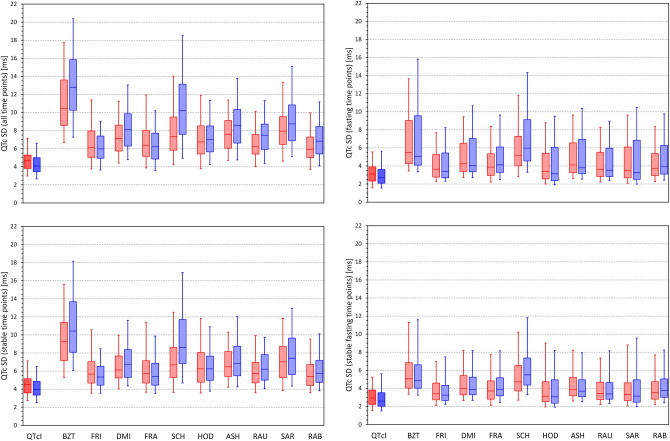
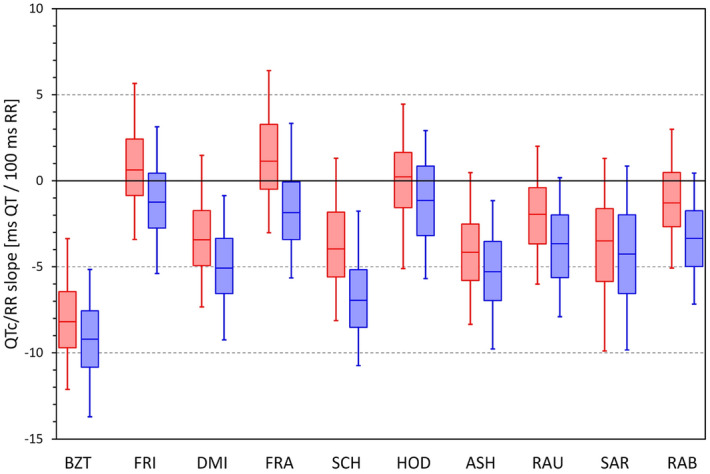
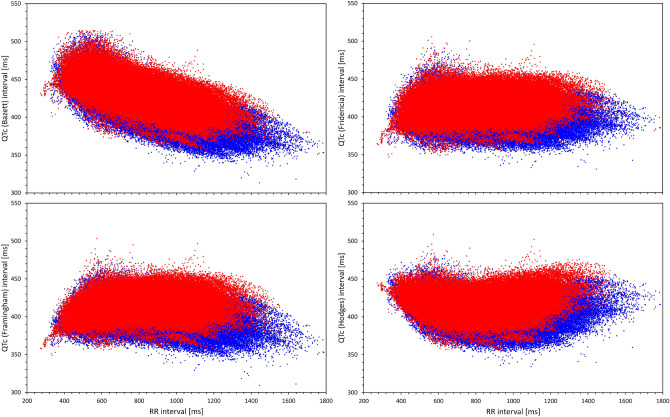
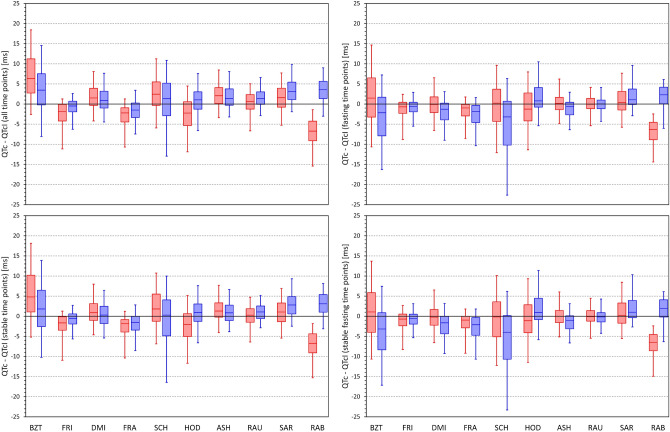
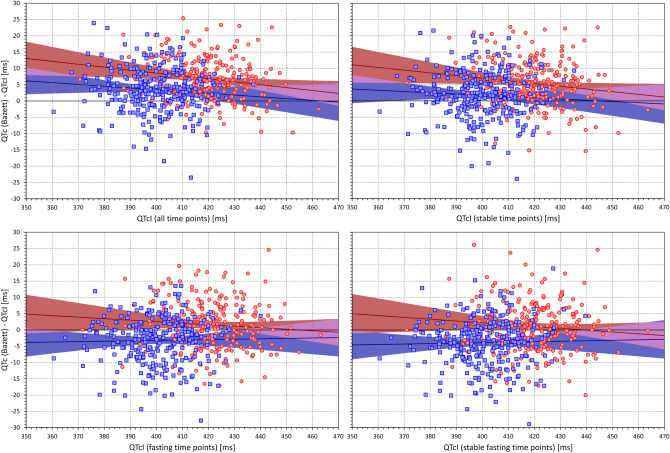
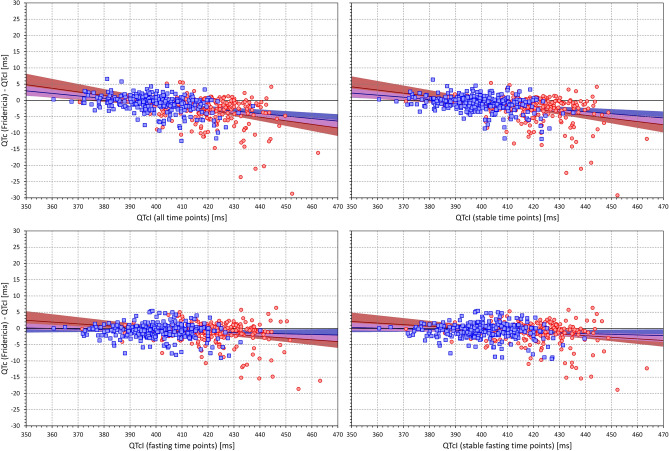
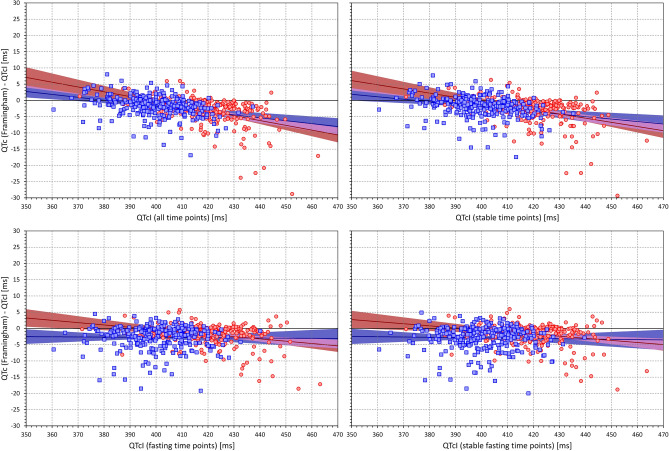
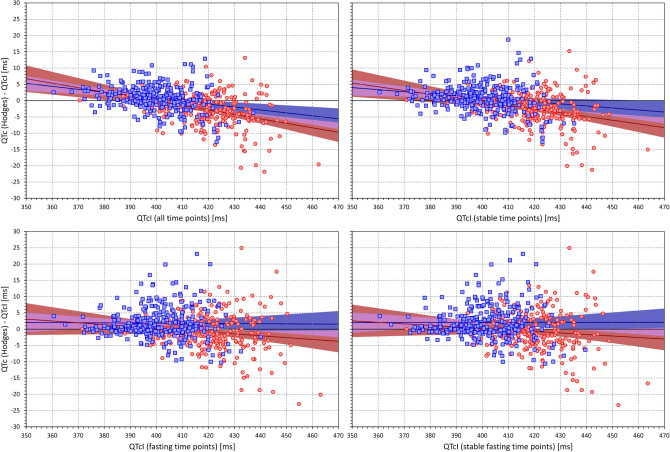
Monitoring of QTc interval is mandated in different clinical conditions. Nevertheless, intra-subject variability of QTc intervals reduces the clinical utility of QTc monitoring strategies. Since this variability is partly related to QT heart rate correction, 10 different heart rate corrections (Bazett, Fridericia, Dmitrienko, Framingham, Schlamowitz, Hodges, Ashman, Rautaharju, Sarma, and Rabkin) were applied to 452,440 ECG measurements made in 539 healthy volunteers (259 females, mean age 33.3 ± 8.4 years). For each correction formula, the short term (5-min time-points) and long-term (day-time hours) variability of rate corrected QT values (QTc) was investigated together with the comparisons of the QTc values with individually corrected QTcI values obtained by subject-specific modelling of the QT/RR relationship and hysteresis. The results showed that (a) both in terms of short-term and long-term QTc variability, Bazett correction led to QTc values that were more variable than the results of other corrections (p < 0.00001 for all), (b) the QTc variability by Fridericia and Framingham corrections were not systematically different from each other but were lower than the results of other corrections (p-value between 0.033 and < 0.00001), and (c) on average, Bazett QTc values departed from QTcI intervals more than the QTc values of other corrections. The study concludes that (a) previous suggestions that Bazett correction should no longer be used in clinical practice are fully justified, (b) replacing Bazett correction with Fridericia and/or Framingham corrections would improve clinical QTc monitoring, (c) heart rate stability is needed for valid QTc assessment, and (d) development of further QTc corrections for day-to-day use is not warranted.


Conflict of interest statement

The authors declare no competing interests.

Figures

Figure 1
Figure 1
Example of three 10-s ECGs recorded in a 30-year old male in a short succession while the subject was kept in a strict motionless position. On the baseline drug-free day, the recordings A, B, and C were recorded at 13:34:38, 13:34:58, and 13:35:28, respectively. Their 10-s heart rates were 52.7, 52.6, and 85.9 bpm, and their uncorrected QT intervals were 405, 405, and 395 ms, respectively. When individual QT/RR hysteresis profile was incorporated into the assessment, the heart rates underlying the QT interval duration were 53.6, 53.4, 58.3 bpm which led to individually corrected QTcI intervals of 391.0, 390.7, and 391.5 ms, respectively. However, when the 10-s heart rates were used to correct the QT intervals, Bazett correction led to QTc values of 379.4, 379.2, and 472.7 ms, respectively (92 ms QTc increase). Fridericia correction let to QTc values of 387.7, 387.6, 445.2 ms, respectively (58 ms QTc increase). These QTc increases were erroneous since they resulted from the disassociation of the QT interval duration from the underlying heart rate. Similar erroneous QTc increases were found with all the investigated corrections formulas (QTc increase of 74, 58, 81, 48, 74, 62, 60, and 61 ms for the Dmitrienko, Framingham, Schlamowitz, Hodges, Ashman, Rautaharju, Sarma, and Rabkin corrections, respectively).
Figure 2
Figure 2
Examples of repeated intra-subject drug-free QT measurements related to the underlying (hysteresis corrected) RR intervals. The examples in females and males are shown with red and blue symbols, respectively, ages of the subjects are shown in the individual panels. Note the substantial differences of the slopes of the patterns.
Figure 3
Figure 3
Scatter diagrams between age and mean QTcI values of all ECG measurements in all study time-points (top panel), standard deviation of QTcI values of all ECG measurements in all study time-points (middle panel), and subject-specific log-linear QT/RR slope (bottom panel). In each panel, the red circles and blue squares correspond to female and male subjects, respectively. The solid red and solid blue lines show the linear regressions between the age and the measured QT characteristics in females and males, respectively. The red shaded and blue shaded areas are the 95% confidence intervals of the regression lines; the violet areas are the overlaps between the confidence intervals of the sex-specific regressions. ms milliseconds.
Figure 4
Figure 4
Scatter diagrams between the body mass index and mean QTcI values of all ECG measurements in all study time-points (top panel), standard deviation of QTcI values of all ECG measurements in all study time-points (middle panel), and subject-specific log-linear QT/RR slope (bottom panel). The meaning of symbols and Figure layout is the same as in Fig. 3. kg kilograms, m metre, ms milliseconds.
Figure 5
Figure 5
Scatter diagrams between the lean body mass and mean QTcI values of all ECG measurements in all study time-points (top panel), standard deviation of QTcI values of all ECG measurements in all study time-points (middle panel), and subject-specific log-linear QT/RR slope (bottom panel). The meaning of symbols and Figure layout is the same as in Fig. 3. kg kilograms, ms milliseconds.
Figure 6
Figure 6
Scatter diagrams between heart rate ranges (maximum–minmum) and standard deviations of QTc values of individual study time-points. The left top panel shows the relationship for QTcI intervals, the top right, bottom left, and bottom right panels show the relationship for Bazett, Fridericia, and Framingham corrected QTc intervals, respectively. In all panels, all time-points of all study subjects are pooled together, red and blue marks show the data of female and male subjects, respectively. Outliers beyond the ranges of the axes were also present in the data. Note that pooling all time-points of all subjects together is not suitable for statistical analysis but serves visual interpretation—the stronger the relationship between the variability of the underlying heart rate and the variability of the QTc intervals within the same time-point, the greater the failure of the correction formula in eliminating the effects of heart rate on QTc values. Compare the panels with panels of Fig. 7. bpm beats per minute, max maximum, min minimum, SD standard deviation.
Figure 7
Figure 7
Scatter diagrams between heart rate ranges (max–min) and standard deviations of QTc values of individual study time-points. The left top, top right, bottom left, and bottom right panels show the relationship for Hodges, Dmitrienko, Rautaharju, and Rabkin corrected QTc intervals, respectively. In all panels, all time-points of all study subjects are pooled together, red and blue marks show the data of female and male subjects, respectively. Outliers beyond the ranges of the axes were also present in the data. The abbreviations and meaning of panels are the same as in Fig. 6. The note in the caption of Fig. 6 also applies—compare the panels with panels of Fig. 6.
Figure 8
Figure 8
The left panel shows the distribution of the intra-subject linear slopes between heart rate ranges (max–min) and standard deviations of QTc intervals calculated over the different study time-points. The right panel shows the distribution of the intra-subject standard deviations of the QTc intervals calculated over all the ECG readings within the drug-free baseline day. For each correction formula (see the abbreviations at the horizontal axes) red and blue box and whisker entries are shown corresponding to the distribution of the data in female and male subjects, respectively. Each of the box and whisker entries shows the population median (horizontal line within the box), inter-quartile range (the top and bottom of the box) and the range between the 5th and 95th percentile (the bottom and top whiskers). bmp beats per minute, ms milliseconds, SD standard deviation.
Figure 9
Figure 9
Distribution of the intra-subject standard deviations of QTc values calculated over all study time-points (top left panel), time-points with stable heart rate (bottom left panel), morning fasting time-points (top right panel), and morning fasting time-points with stable heart rate (bottom right panel). The layout of the panels and the meaning of the box and whisker graphs is the same as in Fig. 8. ms milliseconds, SD standard deviation.
Figure 10
Figure 10
Distribution of intra-subject linear slopes between QTc values and corresponding 10-s averages of RR intervals calculated over all ECG reading during the baseline drug-free day. The layout of the panel and the meaning of the box and whisker graphs is the same as in Fig. 8. ms milliseconds.
Figure 11
Figure 11
For Bazett (top left panel), Fridericia (top right panel), Framingham (bottom left panel) and Hodges (bottom right panel) correction, the Figure shows scatter diagrams of QTc values versus underlying heart rate (10-s measurement) in all study data pooled together. The data in females (in red) are shown superimposed on top of the data in males (in blue).
Figure 12
Figure 12
Distribution of the mean intra-subject differences between QTc intervals by different correction formulas and the corresponding QTcI values. The distribution of the differences is shown for calculations over all study time-points (top left panel), time-points with stable heart rate (bottom left panel), morning fasting time-points (top right panel), and morning fasting time-points with stable heart rate (bottom right panel). The layout of the panels and the meaning of the box and whisker graphs is the same as in Fig. 8. ms milliseconds.
Figure 13
Figure 13
Scatter diagrams of the mean intra-subject differences between Bazett corrected QTc intervals and corresponding QTcI intervals plotted against the intra-subject means of QTcI intervals. The diagrams are shown for data of all study time-points (top left panel), time-points with stable heart rate (top right panel), morning fasting time-points (bottom left panel), and morning fasting time-points with stable heart rate (bottom right panel). In each panel, the red circles and blue squares correspond to female and male subjects, respectively. The solid red and solid blue lines show the linear regressions between the intra-subject QTcI means and the mean intra-subject QTc – QTcI differences in females and males, respectively. The red shaded and blue shaded areas are the 95% confidence intervals of the regression lines; the violet areas are the overlaps between the confidence intervals of the sex-specific regressions. ms milliseconds.
Figure 14
Figure 14
The figure meaning and layout correspond to those of Fig. 12 but instead Bazett QTc data, Fridericia QTc data were used.
Figure 15
Figure 15
The figure meaning and layout correspond to those of Fig. 12 but instead Bazett QTc data, Framingham QTc data were used.
Figure 16
Figure 16
The figure meaning and layout correspond to those of Fig. 12 but instead Bazett QTc data, Hodges QTc data were used.

References

    1. Vandael E, Vandenberk B, Vandenberghe J, Willems R, Foulon V. Risk factors for QTc-prolongation: Systematic review of the evidence. Int. J. Clin. Pharm. 2017;39:16–25. doi: 10.1007/s11096-016-0414-2. - DOI - PubMed
    1. Drew BJ, et al. Prevention of torsade de pointes in hospital settings: A scientific statement from the American Heart Association and the American College of Cardiology Foundation. Circulation. 2010;121:1047–1060. doi: 10.1161/CIRCULATIONAHA.109.192704. - DOI - PMC - PubMed
    1. Buttà C, et al. Use of QT intervals for a more accurate diagnose of syncope and evaluation of syncope severity. Int. J. Clin. Pract. 2014;68:864–870. doi: 10.1111/ijcp.12387. - DOI - PubMed
    1. Rometo AB, Beerman L, Arora G. Electrolyte screening in the evaluation of prolonged QTc interval. Cardiol. Young. 2015;25:398–399. doi: 10.1017/S1047951114000705. - DOI - PubMed
    1. Genovesi S, et al. Electrolyte concentration during haemodialysis and QT interval prolongation in uraemic patients. Europace. 2008;10:771–777. doi: 10.1093/europace/eun028. - DOI - PubMed

Publication types