. 2021 Jul 12;11(1):14259.
doi: 10.1038/s41598-021-93843-z.

Tipping point realized in cod fishery

Affiliations

Tipping point realized in cod fishery

Christian Möllmann et al. Sci Rep. .

Abstract

Understanding tipping point dynamics in harvested ecosystems is of crucial importance for sustainable resource management because ignoring their existence imperils social-ecological systems that depend on them. Fisheries collapses provide the best known examples for realizing tipping points with catastrophic ecological, economic and social consequences. However, present-day fisheries management systems still largely ignore the potential of their resources to exhibit such abrupt changes towards irreversible low productive states. Using a combination of statistical changepoint analysis and stochastic cusp modelling, here we show that Western Baltic cod is beyond such a tipping point caused by unsustainable exploitation levels that failed to account for changing environmental conditions. Furthermore, climate change stabilizes a novel and likely irreversible low productivity state of this fish stock that is not adapted to a fast warming environment. We hence argue that ignorance of non-linear resource dynamics has caused the demise of an economically and culturally important social-ecological system which calls for better adaptation of fisheries systems to climate change.


Conflict of interest statement

The authors declare no competing interests.

Figures

Figure 1
Figure 1
The demise of the Western Baltic cod fishery and challenges to the governance system. (a) Catches divided into commercial and recreational fisheries landings as well as discards. (b) Size of the German coastal gillnetter fleet. (c) Comparison of SSB from stock assessments in years 2008–2019; years indicate assessment years; red solid horizontal line indicates present biomass reference level MSY Btrigger; red dashed horizontal line indicates biomass reference level Blim indicating impaired reproductive success. (d) Comparison of fishing mortality estimates (F) from stock assessments in years 2008–2019; years indicate assessment years; red solid horizontal line indicates present F management target FMSY; grey shaded area represents F management range; red dashed horizontal line indicates former precautionary F reference level Fpa. (e) Deviations of realized spawning stock biomass (SSB) from predictions two years before. (f) Total allowable catches (TAC) agreed by the EU council of minister. (g) Governance system performance evaluated by comparing TAC and advice. (h) Governance system performance evaluated by comparing TAC and realized landings by the fishery. Data in (a), (f), (g) and (h) from; data in c derived from the German Federal Office of Agriculture and Food (BLE), www.ble.de; for data in (c), (d), and (e) see Supplementary Methods S1.
Figure 2
Figure 2
Abrupt changes and regimes in Western Baltic cod. (a) Spawning Stock Biomass (SSB); red solid horizontal line represent the biomass reference level MSY Btrigger; red dashed horizontal lines indicates biomass reference level Blim indicating danger of collapse; points size scaled to fishing mortality. (b) Recruitment (R) to the stock, i.e. year-class strength at age 1; point size scaled to SSB. (c) Productivity of the stock, i.e. R/SSB; point size scaled to SSB. (d) Fishing mortality (F); red solid horizontal lines indicate present F management target FMSY; grey shaded area represents F management range; red dashed horizontal line indicates former precautionary F reference level Fpa; point size scaled to SSB (e) Fishing mortality relative to recruitment (F/R); point size scaled to SSB. (f) Summary of regime dynamics, point size represents mean of SSB regime periods (see Fig. 1a) with the highest value of a variable scaled to 1; grey shaded area represents recent Regime 4 (see Fig. 1a). Years in a-c indicate major changepoint years. Vertical and dashed lines indicate SSB regimes; vertical dotted lines indicate R regimes in b and R/SSB regimes in c.
Figure 3
Figure 3
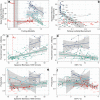
Breakpoints in Western Baltic cod stock functioning. (a) Apparent hysteresis in the relationship between spawning stock biomass (SSB) and fishing mortality (F); red vertical and horizontal lines indicate biomass reference level Blim and fishing mortality (F) reference point FMSY; vertical grey shaded area represents F management range. (b) Effect of scaled exploitation pressure, i.e. fishing mortality relative to recruitment (R, i.e. year-class strength at age 1) on SSB; horizontal line indicates biomass reference level Blim; black dashed line indicates alternative linear model (fitted to the data excluding 2007 and 2015 considered as outliers). (c) Effect of SSB on R; red vertical and horizontal lines indicate biomass reference level Blim. (d) Effect of sea surface temperature (SST) on R. (e) Effect of SSB on productivity (R/SSB). (f) Effect of SST on productivity; black dashed line indicates alternative spline model. Coloured points and lines indicate regime-dependent linear models from breakpoint analysis.
Figure 4
Figure 4
Hysteresis and stable states in Western Baltic cod. (a) Effect of scaled exploitation pressure, i.e. fishing mortality (F) relative to recruitment (R, i.e. year-class strength at age 1), and sea surface temperature (SST) on spawning stock biomass (SSB; points scaled to predictions from stochastic cusp modelling); grey shaded polygon indicates the cusp area where bistability of the system exists. (b) Time-series on observed (grey dashed line) and predicted SSB (points and black solid line) from stochastic cusp modelling; horizontal coloured bars indicate SSB regimes (see Fig. 1). In (a) and (b) red points indicate the system to be in the bistable cusp area (see polygon in a) and black points indicate a stable system, outside the cusp area.

References

    1. Heinze C, et al. The quiet crossing of ocean tipping points. Proc. Natl. Acad. Sci. 2021;118:e2008478118. doi: 10.1073/pnas.2008478118. - DOI - PMC - PubMed
    1. Dakos V, et al. Ecosystem tipping points in an evolving world. Nat. Ecol. Evol. 2019;3:355–362. doi: 10.1038/s41559-019-0797-2. - DOI - PubMed
    1. Myers R, Hutchings J, Barrowman N. Hypotheses for the decline of cod in the North Atlantic. Mar. Ecol. Prog. Ser. 1996;138:293–308. doi: 10.3354/meps138293. - DOI
    1. Sguotti C, et al. Catastrophic dynamics limit Atlantic cod recovery. Proc. R. Soc. B Biol. Sci. 2019;286:20182877. doi: 10.1098/rspb.2018.2877. - DOI - PMC - PubMed
    1. Levin PS, Möllmann C. Marine ecosystem regime shifts: Challenges and opportunities for ecosystem-based management. Philos. Trans. R. Soc. B Biol. Sci. 2015;370:20130275. doi: 10.1098/rstb.2013.0275. - DOI

Publication types