. 2021 Oct;45(10):2252-2260.
doi: 10.1038/s41366-021-00888-1. Epub 2021 Jul 12.

Cord blood metabolic signatures predictive of childhood overweight and rapid growth

Affiliations

Cord blood metabolic signatures predictive of childhood overweight and rapid growth

Evangelos Handakas et al. Int J Obes (Lond). 2021 Oct.

Abstract

Introduction: Metabolomics may identify biological pathways predisposing children to the risk of overweight and obesity. In this study, we have investigated the cord blood metabolic signatures of rapid growth in infancy and overweight in early childhood in four European birth cohorts.

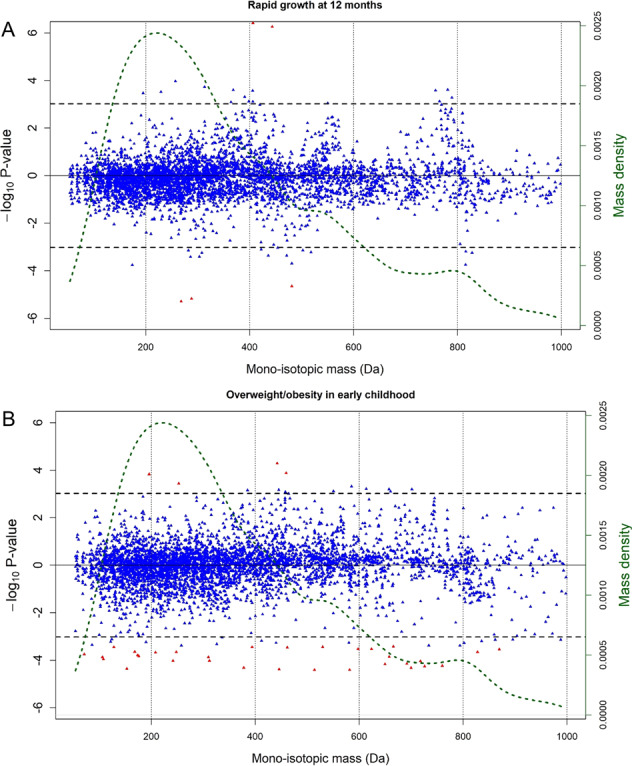
Methods: Untargeted liquid chromatography-mass spectrometry metabolomic profiles were measured in cord blood from 399 newborns from four European cohorts (ENVIRONAGE, Rhea, INMA and Piccolipiu). Rapid growth in the first year of life and overweight in childhood was defined with reference to WHO growth charts. Metabolome-wide association scans for rapid growth and overweight on over 4500 metabolic features were performed using multiple adjusted logistic mixed-effect models and controlling the false discovery rate (FDR) at 5%. In addition, we performed a look-up analysis of 43 pre-annotated metabolites, previously associated with birthweight or rapid growth.

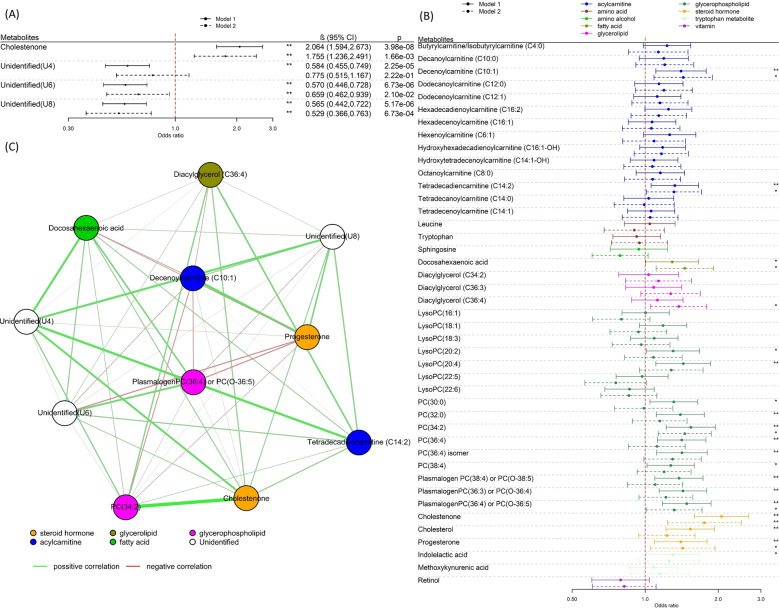
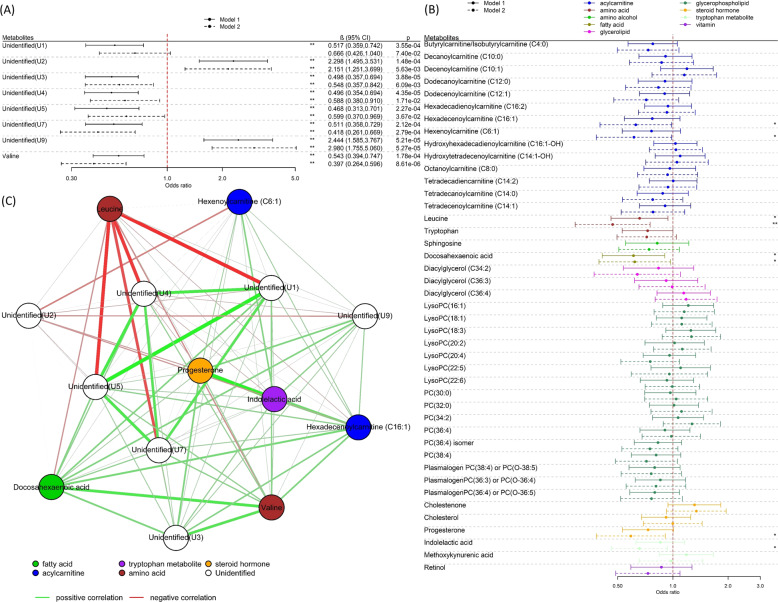
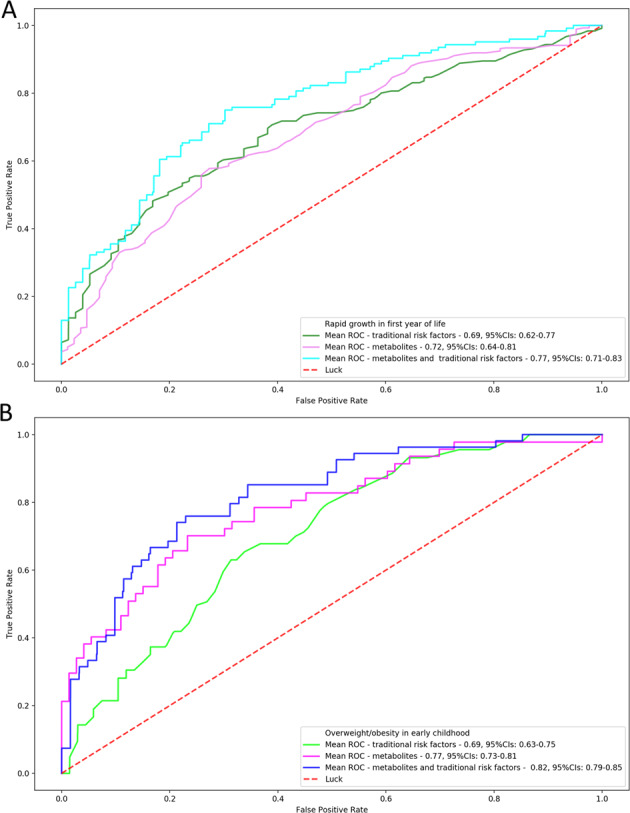
Results: In the Metabolome-Wide Association Study analysis, we identified three and eight metabolites associated with rapid growth and overweight, respectively, after FDR correction. Higher levels of cholestenone, a cholesterol derivative produced by microbial catabolism, were predictive of rapid growth (p = 1.6 × 10⁻³). Lower levels of the branched-chain amino acid (BCAA) valine (p = 8.6 × 10⁻⁶) were predictive of overweight in childhood. The area under the receiver operator curve for multivariate prediction models including these metabolites and traditional risk factors was 0.77 for rapid growth and 0.82 for overweight, compared with 0.69 and 0.69, respectively, for models using traditional risk factors alone. Among the 43 pre-annotated metabolites, seven and five metabolites were nominally associated (P < 0.05) with rapid growth and overweight, respectively. The BCAA leucine, remained associated (1.6 × 10⁻³) with overweight after FDR correction.

Conclusion: The metabolites identified here may assist in the identification of children at risk of developing obesity and improve understanding of mechanisms involved in postnatal growth. Cholestenone and BCAAs are suggestive of a role of the gut microbiome and nutrient signalling respectively in child growth trajectories.


Conflict of interest statement

The authors declare no competing interests. Where authors are identified as personnel of the International Agency for Research on Cancer/World Health Organisation, the authors alone are responsible for the views expressed in this article and they do not necessarily represent the decisions, policy or views of the International Agency for Research on Cancer/World Health Organisation.

Figures

Fig. 1
Fig. 1. Metabolome wide associations with rapid growth and overweight.
Signed Manhattan-type plot presenting the analysis of the 4714 UPLC-MS metabolic features for Model 1 for A rapid growth at twelve months of age and for B overweight in early childhood. The red dots represent the features that remain significant after applying the FDR threshold of 5%, whereas blue dots do not. The vertical axis shows the signed −log10 P value. The horizontal axis represents the monoisotopic mass (in Da). UPLC-MS-associated metabolic features are available in Table S3 and Table S6. The dotted green line represents the mass density.
Fig. 2
Fig. 2. Metabolite associations with rapid growth.
A Regression coefficients per standard deviation (95% confidence interval) between features and rapid growth at 12 months across all four cohorts (N = 391), identified in MWAS analysis. B Regression coefficients per standard deviation (95% confidence interval) between 43 pre-annotated metabolites and rapid growth at twelve months across all four cohorts (N = 391). The solids lines represent the results of Model 1 (adjusted for cohort and ethnicity) and the dotted lines the results of Model 2 (Model 1 further adjusted for maternal BMI, paternal BMI, gestational age, weight gained during pregnancy, paternal education passive and active smoking status during pregnancy, parity as well as a delivery mode). The * declares P < 0.05 while **FDR < 0.05. C Network graph (Pearson correlations) of metabolites associated with rapid growth at 12 months of age.
Fig. 3
Fig. 3. Metabolite associations with overweight.
A Regression coefficients per standard deviation (95% confidence interval) between features with overweight in early childhood (N = 272), identified in MWAS analysis. B Regression coefficients per standard deviation (95% confidence interval) between 43 pre-annotated metabolites with overweight in early childhood (N = 272). The solids lines represent the results of Model 1 (adjusted for age of child at outcome measurement, cohort and ethnicity) and the dotted lines the results of Model 2 (Model 1 further adjusted for maternal BMI, paternal BMI, gestational age, weight gained during pregnancy, paternal education passive and active smoking status during pregnancy, parity as well as delivery mode). The * declares P < 0.05 while **FDR < 0.05. C Network graph (Pearson correlations) of metabolites associated in early childhood.
Fig. 4
Fig. 4. Multivariate prediction models of rapid growth and overweight.
ROC mean value of 1000 bootstrapped model of threefolds for A rapid growth at 12 months of age after grouping the ions (nine metabolites) (population size: N = 391) and B overweight throughout early childhood (population size: N = 272).

References

    1. Abarca-Gómez L, Abdeen ZA, Hamid ZA, Abu-Rmeileh NM, Acosta-Cazares B, Acuin C, et al. Worldwide trends in body-mass index, underweight, overweight, and obesity from 1975 to 2016: a pooled analysis of 2416 population-based measurement studies in 128· 9 million children, adolescents, and adults. Lancet. 2017;390:2627–42. doi: 10.1016/S0140-6736(17)32129-3. - DOI - PMC - PubMed
    1. Segal AB, Huerta MC, Aurino E, Sassi F. The impact of childhood obesity on human capital in high‐income countries: a systematic review. Obes Rev. 2020;22:e13104. - PubMed
    1. Liu J-H, Jones SJ, Sun H, Probst JC, Merchant AT, Cavicchia P. Diet, physical activity, and sedentary behaviors as risk factors for childhood obesity: an urban and rural comparison. Child Obes. 2012;8:440–8. doi: 10.1089/chi.2011.0090. - DOI - PubMed
    1. Patrick K, Norman GJ, Calfas KJ, Sallis JF, Zabinski MF, Rupp J, et al. Diet, physical activity, and sedentary behaviors as risk factors for overweight in adolescence. Arch Pediatr Adoles Med. 2004;158:385–90. doi: 10.1001/archpedi.158.4.385. - DOI - PubMed
    1. Demetriou CA, van Veldhoven K, Relton C, Stringhini S, Kyriacou K, Vineis P. Biological embedding of early‐life exposures and disease risk in humans: a role for DNA methylation. Eur J Clin Invest. 2015;45:303–32. doi: 10.1111/eci.12406. - DOI - PubMed

Publication types