. 2021 Jul;23(7):684-691.
doi: 10.1038/s41556-021-00709-7. Epub 2021 Jul 12.

ALKBH7-mediated demethylation regulates mitochondrial polycistronic RNA processing

Affiliations

ALKBH7-mediated demethylation regulates mitochondrial polycistronic RNA processing

Li-Sheng Zhang et al. Nat Cell Biol. 2021 Jul.

Abstract

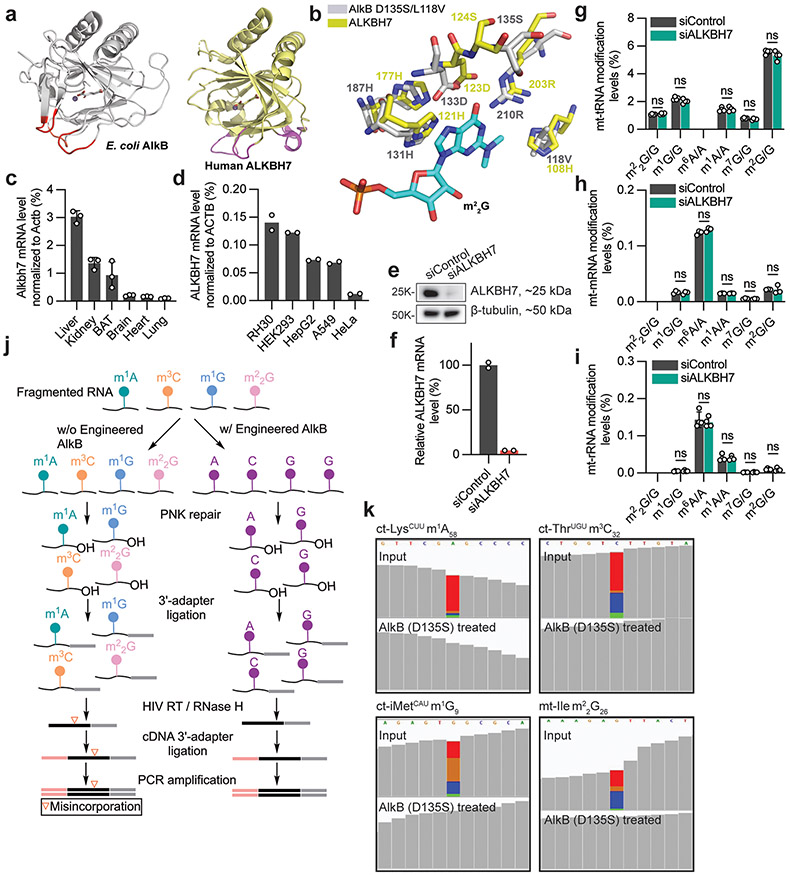
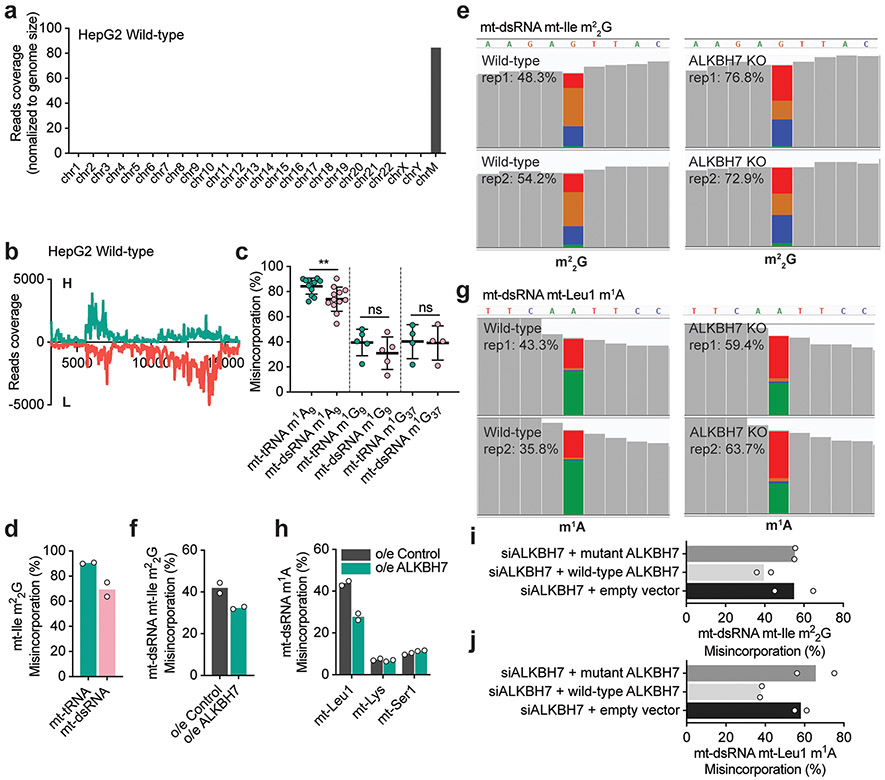
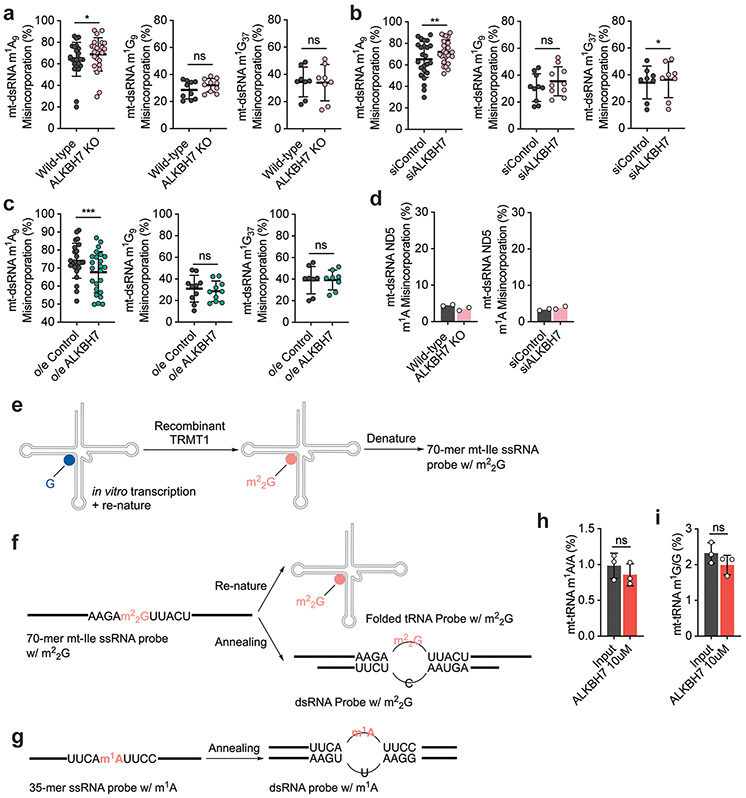
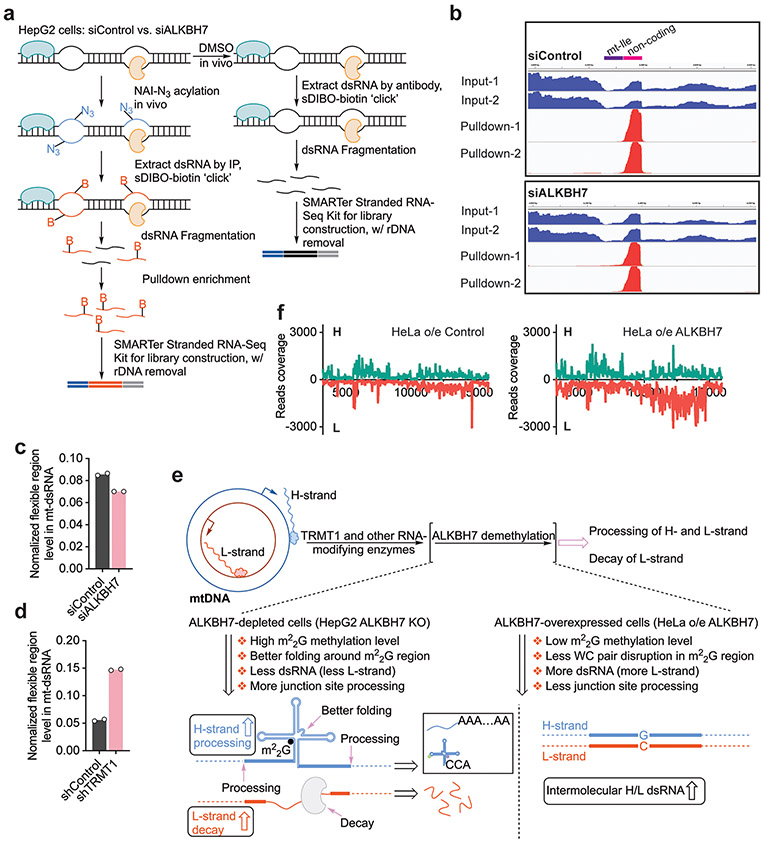
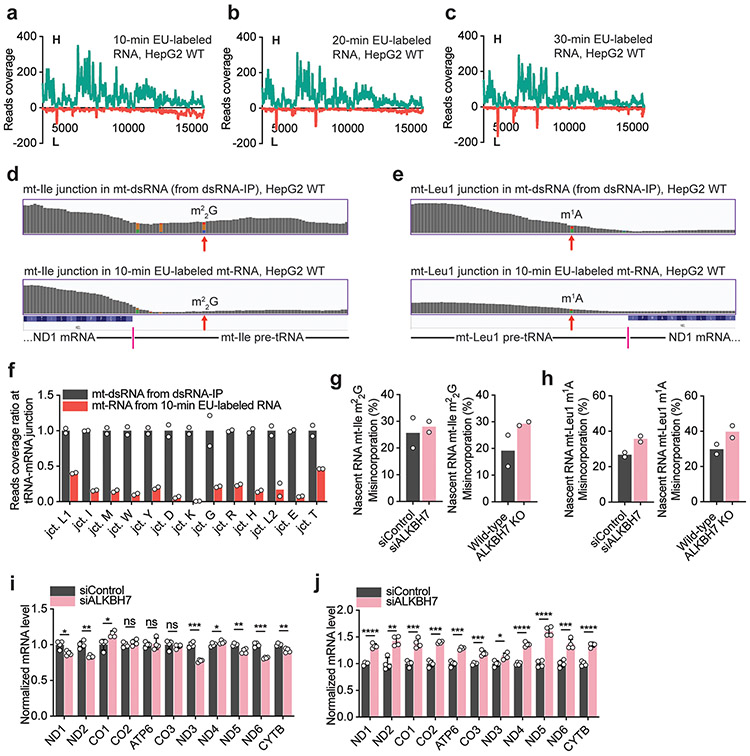
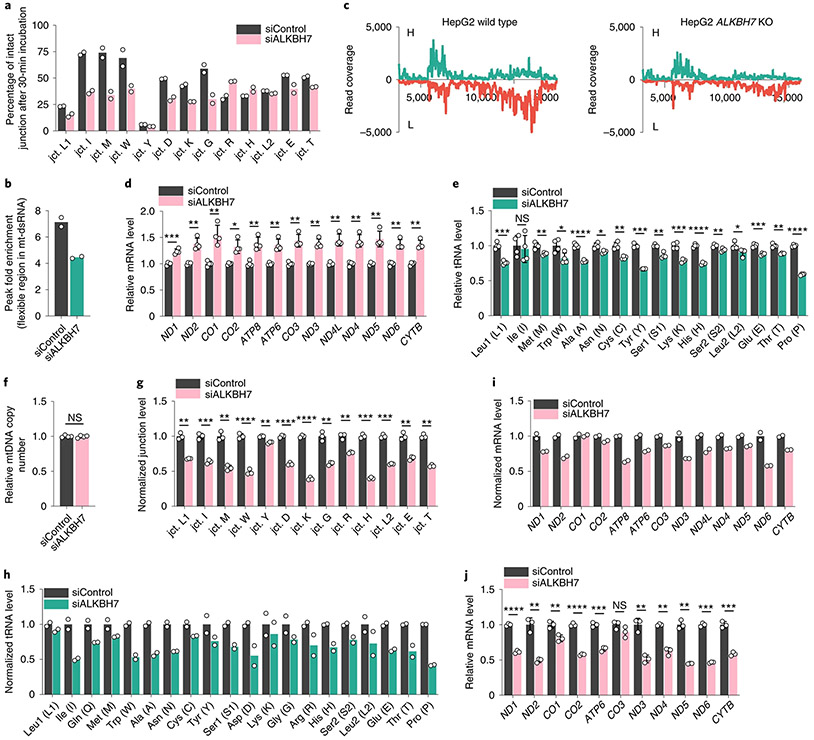
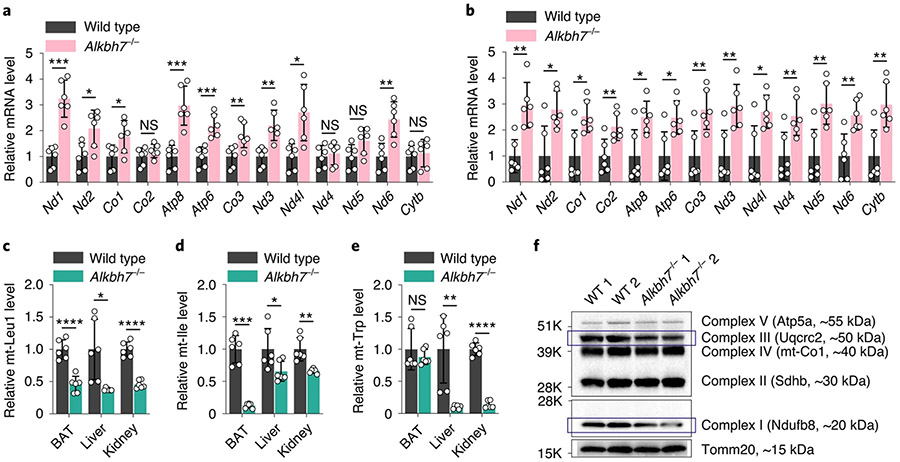
Members of the mammalian AlkB family are known to mediate nucleic acid demethylation1,2. ALKBH7, a mammalian AlkB homologue, localizes in mitochondria and affects metabolism3, but its function and mechanism of action are unknown. Here we report an approach to site-specifically detect N1-methyladenosine (m1A), N3-methylcytidine (m3C), N1-methylguanosine (m1G) and N2,N2-dimethylguanosine (m22G) modifications simultaneously within all cellular RNAs, and discovered that human ALKBH7 demethylates m22G and m1A within mitochondrial Ile and Leu1 pre-tRNA regions, respectively, in nascent polycistronic mitochondrial RNA4-6. We further show that ALKBH7 regulates the processing and structural dynamics of polycistronic mitochondrial RNAs. Depletion of ALKBH7 leads to increased polycistronic mitochondrial RNA processing, reduced steady-state mitochondria-encoded tRNA levels and protein translation, and notably decreased mitochondrial activity. Thus, we identify ALKBH7 as an RNA demethylase that controls nascent mitochondrial RNA processing and mitochondrial activity.


Figures

Extended Data Fig. 1 ∣
Extended Data Fig. 1 ∣. Human ALKBH7 effect on mt-RNA methylations by mass spec and the development of DAMM-seq to detect m1A, m3C, m1G and m22G in one sequencing run via misincorporation signature.
a, An overlay of crystal structure of E. coli AlkB and human ALKBH7 on three peripheral loops (two are identical as EcAlkB, one is the ALKBH7 specific loop). b, The unique active site of ALKBH7 resembles an engineered AlkB protein (D135S/L118V) that catalyzes demethylation of m22G. c, Alkbh7 mRNA levels (normalized to mouse Actb) in several mouse tissues. n =3 biologically independent samples; data are presented as mean values ± SD. d, ALKBH7 mRNA levels (normalized to ACTB) in several human cancer cell lines. e, ALKBH7 knockdown efficiency in HepG2 cells by protein level (compared to β-tubulin). f, ALKBH7 knockdown efficiency in HepG2 cells by mRNA level (normalized to β-actin). For d and f, n =2 biologically independent samples. g, Modification levels (m22G/G, m1G/G, m6A/A, m1A/A, m7G/G, m2G/G) by LC-MS/MS for mitochondrial tRNA in ALKBH7-depleted HepG2 cells vs. control. Unpaired, two-tailed t-test; n = 4 biologically independent samples; data are presented as mean values ± SD. h, Modification levels by LC-MS/MS for mitochondrial mRNA in ALKBH7-depleted HepG2 cells vs. control. i, Modification levels by LC-MS/MS for mitochondrial rRNA in ALKBH7-depleted HepG2 cells vs. control. For h-i, unpaired, two-tailed t-test; n = 3 biologically independent samples; data are presented as mean values ± SD. j, A flowchart of DAMM-seq library construction pipeline, detecting four types of methylated bases (m22G, m1G, m1A, m3C) by misincorporation signatures in a “one-pot” manner with or without engineered AlkB treatment. k, IGV plot for visualizing the mutation level drop down to zero after demethylase treatment in DAMM-seq.
Extended Data Fig. 2 ∣
Extended Data Fig. 2 ∣. DAMM-seq reveals methylated sites in mitochondrial tRNA, and ALKBH7 does not demethylate m22G or other methylated bases (m1A, m3C, m1G) in mature mt-tRNAs.
a, Modification levels by LC-MS/MS in cellular small RNA fraction (input vs. engineered AlkB treatment) to showcase the demethylation efficiency and selectivity in DAMM-seq. P values = 0.0027, 0.0028, 0.4531, 0.0002, 0.6009, 0.5991, 0.5351, 0.5583 for methylated bases respectively; unpaired, two-tailed t-test. n = 3, biologically independent samples. Data are presented as mean values ± SD. For b-e, RT misincorporation frequency (input vs. engineered AlkB treatment) for: b, m1A9 in 14 mitochondrial tRNAs that contain m1A9; c, m3C32 in 2 mitochondrial tRNAs that contain m3C32; d, m1G9 in 5 mitochondrial tRNAs that contain m1G9; e, m1G37 in 4 mitochondrial tRNAs that contain m1G37. For b-e, n = 2 biologically independent samples. f, An example flowchart of library construction pipeline for DAMM-seq revealing methylation fraction change of specific m1A, m3C, m1G, and m22G sites in vivo, with altered TRMT1. g, TRMT1 knockdown efficiency in HeLa cells by mRNA level (below, normalized to GAPDH. n = 2 biologically independent samples) and protein level (above, compared to GAPDH). h, Mutation levels after RT for m22G26 in mt-tRNA in TRMT1-depleted HeLa cells vs. control. i, Mutation levels after RT for m22G26 in mt-tRNA in ALKBH7-depleted HepG2 cells vs. control. j, Mutation levels after RT for m22G26 in mt-tRNA in ALKBH7-overexpressed HeLa cells vs. control. For k-o, Mutation levels after RT (in ALKBH7-depleted HepG2 cells vs. control) for k, 3 mt-tRNAs with m1A58, l, 2 mt-tRNAs with m3C32, m, 14 mt-tRNAs with m1A9, n, 5 mt-tRNAs with m1G9, o, 4 mt-tRNAs with m1G37. For p-t, Mutation levels after RT (in ALKBH7-overexpressed HeLa cells vs. control) for p, 3 mt-tRNAs with m1A58, q, 2 mt-tRNAs with m3C32, r, 14 mt-tRNAs with m1A9, s, 5 mt-tRNAs with m1G9, t, 4 mt-tRNAs with m1G37. For h-t, n =2 biologically independent samples.
Extended Data Fig. 3 ∣
Extended Data Fig. 3 ∣. ALKBH7 regulates demethylation of m22G (mt-Ile region) and m1A (mt-Leu1 region) in mitochondrial dsRNA in vivo.
a, DAMM-seq reads from IP-enriched dsRNA (HepG2 wild-type) were predominantly aligned to the mitochondrial genome (normalized to genome length). b, DAMM-seq reads coverage of IP-enriched dsRNA across the mitochondrial genome spanning entire protein coding region (~3.5–16 kb). H-strand are shown as green color and L-strand as red color (both normalized to 18S rRNA). c, A9, G9 and G37 in HeLa mature mt-tRNA compared with those in enriched mt-dsRNA. A9: **P = 0.0074; paired, two-tailed t-test; n =12 independent m1A sites. G9: P = 0.071; paired, two-tailed t-test; n =5 independent m1G sites. G37: P = 0.5571; paired, two-tailed t-test; n = 4, independent m1G sites. Each data point represents one methylation site, with the average misincorporation from 2 biologically independent samples. Data are presented as mean values ± SD. d, mt-Ile m22G in mature mt-tRNA compared with that in enriched mt-dsRNA in HeLa cells (shControl), where lentivirus infection elevates m22G methylation level in dsRNA stage. e, IGV visualization of mutation ratio at mitochondrial dsRNA m22G (mt-Ile region) in ALKBH7 knockout HepG2 cells vs. wild-type. Mutation ratio values (majorly G→T + G→C) shown in the parenthesis. f, m22G in mt-dsRNA (mt-Ile region) in ALKBH7-overexpressed HeLa cells vs. control. g, IGV visualization of mutation ratio at mitochondrial dsRNA m1A (mt-Leu1 region) in ALKBH7 knockout HepG2 cells vs. wild-type. Mutation ratio values (majorly A→T) shown in the parenthesis. h, m1A in mt-dsRNA (mt-Leu1 region) in ALKBH7-overexpressed HeLa cells vs. control. i, m22G misincorporation in mt-dsRNA (mt-Ile region) in ALKBH7-depleted HepG2 cells (siALKBH7) can be rescued with the wild-type ALKBH7 protein but not by an ALKBH7 mutant without mitochondrial targeting sequence (MTS). j, m1A misincorporation in mt-dsRNA (mt-Leu1 region) in ALKBH7-depleted HepG2 cells (siALKBH7) can be rescued with the wild-type ALKBH7 protein but not by an ALKBH7 mutant without mitochondrial targeting sequence (MTS). For d, f, and h-j, n = 2 biologically independent samples.
Extended Data Fig. 4 ∣
Extended Data Fig. 4 ∣. ALKBH7 demethylation effect on other methylations (such as m1A9, m1G9, and m1G37) within mitochondrial dsRNA is lower than that on Ile-m22G and Leu1-m1A inside cells.
a, Mutation levels for m1A9, m1G9, and m1G37 in mt-dsRNA in ALKBH7 knockout HepG2 cells vs. wild-type. m1A9: *P = 0.0398; paired, two-tailed t-test; n = 24, 12 independent m1A sites. m1G9: P = 0.0954; paired, two-tailed t-test; n = 10, 5 independent m1G sites. m1G37: P = 0.38; paired, two-tailed t-test; n = 8, 4 independent m1G sites. b, Mutation levels for m1A9, m1G9, and m1G37 in mt-dsRNA in siALKBH7 HepG2 cells vs. siControl. m1A9: **P = 0.0047; paired, two-tailed t-test; n = 24, 12 independent m1A sites. m1G9: P = 0.1462; paired, two-tailed t-test; n = 10, 5 independent m1G sites. m1G37: *P = 0.0188; paired, two-tailed t-test; n = 8, 4 independent m1G sites. c, Mutation levels for m1A9, m1G9, and m1G37 in mt-dsRNA in ALKBH7-overexpressed HeLa cells vs. control. m1A9: ***P = 0.0002; paired, two-tailed t-test; n = 24, 12 independent m1A sites. m1G9: P = 0.5666; paired, two-tailed t-test; n = 10, 5 independent m1G sites. m1G37: P = 0.4838; paired, two-tailed t-test; n = 8, 4 independent m1G sites. For a-c, each data point represents one methylation site, with the misincorporation from 2 biologically independent samples. Data are presented as mean values ± SD. d, Mutation levels for m1A in mt-ND5 region of mt-dsRNA. Left: ALKBH7 knockout HepG2 cells vs. wild-type; Right: siALKBH7 HepG2 cells vs. siControl. n = 2 biologically independent samples. e, m22G-containing ssRNA probe synthesized by recombinant TRMT1 protein. f, m22G-containing mt-Ile RNA probe in forms of folded tRNA and dsRNA. g, m1A-containing mt-Leu1 RNA probe in forms of ssRNA and dsRNA. h, Modification levels of m1A/A in purified mt-tRNA before and after treatment with recombinant human ALKBH7. P = 0.4048; unpaired, two-tailed t-test. i, Modification levels of m1G/G in purified mt-tRNA before and after treatment with recombinant human ALKBH7. P = 0.2256; unpaired, two-tailed t-test. For h-i, n =3 biologically independent samples. Data are presented as mean values ± SD.
Extended Data Fig. 5 ∣
Extended Data Fig. 5 ∣. Optimized icSHAPE detects one flexible region adjacent to mt-Ile region in mitochondrial dsRNA, in which ALKBH7 depletion and overexpression impact the mt-dsRNA level.
a, A flowchart of library construction pipeline for optimized icSHAPE designed for studying secondary structure within mitochondrial dsRNA. b, IGV visualization of icSHAPE peak region (in H-strand) adjacent to mt-Ile region in mitochondrial dsRNA. For the “pull-down” samples we fed the cells with NAI-N3 (dissolved in DMSO) and enriched NAI-N3 labeled RNAs. For the “input” samples we fed the cells with DMSO and then build the libraries without pull-down enrichment. c, The decreased mitochondrial dsRNA flexible region levels (quantified by RT-qPCR, with gene-specific primer during RT and biotin-tagged spike-in) in ALKBH7-depleted HepG2 cells vs. control. d, The increased mitochondrial dsRNA flexible region level (quantified by RT-qPCR, with gene-specific primer during RT and biotin-tagged spike-in) in TRMT1-depleted HeLa cells vs. control. For c-d, n = 2 biologically independent samples. e, A scheme showing proposed effects of m22G demethylation by ALKBH7 on mitochondrial polycistronic RNA processing. f, ALKBH7-overexpressed cells (o/e ALKBH7) display an increased dsRNA level (in particular the L-strand) compared with o/e Control (normalized to 18S rRNA).
Extended Data Fig. 6 ∣
Extended Data Fig. 6 ∣. ALKBH7-depleted cells showed altered levels of steady-state mt-RNA and decreased mitochondrial protein synthesis rate, while mitochondrial transcription was not affected.
a, Relative mRNA levels of 13 mt-mRNAs (normalized to ACTB) in ALKBH7-depleted HEK 293T cells vs. control. P values = 0.0001, 0.0002, <0.0001, <0.0001, 0.0004, <0.0001, <0.0001, <0.0001, <0.0001, <0.0001, <0.0001, <0.0001, <0.0001 for 13 mt-mRNAs, respectively; unpaired, two-tailed t-test. b, ALKBH7-overexpressed HeLa cells vs. control. P values = 0.275, 0.0941, 0.0042, 0.0075, 0.0011, 0.0008, 0.013, 0.009, 0.0124, 0.0008, 0.0209, 0.003, 0.0033 for 13 mt-mRNAs, respectively; unpaired, two-tailed t-test. c, Relative levels of 12S and 16S rRNAs (normalized to 18S rRNA) in ALKBH7-depleted HepG2 cells vs. control. P values = 0.0027 and 0.0003 for two rRNAs, respectively; unpaired, two-tailed t-test. For a-c, n=4 biologically independent samples. Data are presented as mean values ± SD. NS, P ≥ 0.05; *P < 0.05; **P < 0.01; ***P < 0.001; and ****P < 0.0001. d, The transcription rate for mt-mRNA regions with and without ALKBH7 depletion. RT-qPCR quantification was conducted on isolated EU-labeled RNA at early time points of 1-min, 2-min, 3-min and 5-min, respectively, from siALKBH7 vs. siControl. Normalized levels of mt-mRNA region are shown. e, The normalized level changes of tRNA-mRNA junctions in nascent mt-RNA with and without ALKBH7 depletion. RT-qPCR quantification was conducted on isolated EU-labeled RNA at early time points of 1-min, 2-min, 3-min and 5-min, respectively, from siALKBH7 vs. siControl. Normalized levels of junction site are shown. For d-e, n=3 biologically independent samples. Data are presented as mean values ± SD.
Extended Data Fig. 7 ∣
Extended Data Fig. 7 ∣. The faster nascent mt-RNA processing led to the decreased overall levels of nascent mt-tRNA and mt-mRNA.
For a-c, Reads coverage of 10-min, 20-min and 30-min EU-labeled nascent RNA (from HepG2 WT cells) across the mitochondrial genome spanning entire protein coding region (~3.5-16 kb, normalized to 18S rRNA). H-strand genes are shown in green color and L-strand in red color. d, Above: IGV reads coverage at the mRNA-tRNA junction of mt-ND1/mt-Ile in mt-dsRNA from dsRNA-IP; below: IGV reads coverage at this mt-ND1/mt-Ile junction in nascent mt-RNA from 10-min EU-labeling. e, Above: IGV reads coverage at the mRNA-tRNA junction of mt-Leu1/mt-ND1 in mt-dsRNA from dsRNA-IP; below: IGV reads coverage at this mt-Leu1/mt-ND1 junction in nascent mt-RNA from 10-min EU-labeling. f, Relative reads coverage comparison at each tRNA-mRNA junction in mt-dsRNA (from dsRNA-IP) vs. in nascent mt-RNA from 10-min EU labeled RNA. The tRNA-mRNA junction ratio is defined by pre-tRNA/mRNA reads coverage ratio, which was calculated by the reads sum in pre-tRNA region (~70 nt) compared to the reads sum within its adjacent mt-mRNA region (within a 200-nt window). The ratio of an unprocessed junction is normalized to 1.0. Many regions were already decayed 10 min after transcription. g, Left: m22G in 10-min EU-labeled RNA (mt-Ile region) in siALKBH7 HepG2 cells vs. siControl. Right: m22G in 10-min EU-labeled RNA (mt-Ile region) in ALKBH7 knockout HepG2 cells vs. wild-type. h, Left: m1A in 10-min EU-labeled RNA (mt-Leu1 region) in siALKBH7 HepG2 cells vs. siControl. Right: m1A in 10-min EU-labeled RNA (mt-Leu1 region) in ALKBH7 knockout HepG2 cells vs. wild-type. For f-h, n=2 biologically independent samples. i, Normalized mt-mRNA levels in 30-min EU-labeled mitochondrial nascent RNA extracted from siALKBH7 HepG2 cells vs. siControl. P values = 0.0127, 0.0049, 0.0192, 0.3494, 0.8318, 0.5296, 0.0003, 0.0807, 0.0062, 0.0004, 0.0065 for 11 mt-mRNAs, respectively; unpaired, two-tailed t-test. j, Normalized mt-mRNA levels in 60-min EU-labeled mitochondrial nascent RNA extracted from siALKBH7 HepG2 cells vs. siControl. P values = <0.0001, 0.0013, 0.0006, 0.0004, 0.0004, 0.0004, 0.0135, <0.0001, <0.0001, 0.0009, <0.0001 for 11 mt-mRNAs, respectively; unpaired, two-tailed t-test. For i-j, n = 4 biologically independent samples. NS, P ≥ 0.05; *P < 0.05; **P < 0.01; ***P < 0.001; and ****P < 0.0001.
Extended Data Fig. 8 ∣
Extended Data Fig. 8 ∣. ALKBH7 loss leads to decreased mitochondrial activity and reduced protein synthesis.
a, Decreased OCR in ALKBH7-depleted HepG2 cells (siALKBH7) vs. siControl. b, Decreased ECAR in ALKBH7-depleted HepG2 cells (siALKBH7) vs. siControl. For a-b, n = 6 biologically independent samples; data are presented as mean values ± SD. c, Western blotting shows protein levels of mitochondrial marker VDAC, SDHA, HSP60, and cellular TRMT1 in siALKBH7 vs. siControl (normalized to β-tubulin), d, The metabolic labeling assay for mitochondrial protein synthesis. Using 3-hour AHA (L-Azidohomoalanine) labeling together with emetine (cytoplasmic translation inhibitor), biotinylated-alkyne-assisted click reaction enables western blotting to reveal mitochondrial nascent protein levels in siALKBH7 vs. siControl. Reduced protein synthesis was observed with ALKBH7 depletion. For c-d, two rounds of immunoblots for biologically independent samples were performed, with similar results obtained.
Extended Data Fig. 9 ∣
Extended Data Fig. 9 ∣. Loss of ALKBH7 in mouse tissues led to altered mt-mRNA and mt-tRNA levels, with decreased FAO activity observed in the fat tissue.
a, Relative levels of 13 mt-mRNAs (normalized to Actb) in the kidney isolated from Alkbh7 knockout mice (Alkbh7−/−) vs. wild-type. P values = 0.0408, 0.018, 0.0229, 0.0618, 0.0256, 0.0428, 0.074, 0.0157, 0.0138, 0.0192, 0.0126, 0.0067, 0.0254 for 13 mt-mRNAs, respectively. b, Relative levels of 13 mt-mRNAs (normalized to Actb) in the heart isolated from Alkbh7 knockout mice (Alkbh7−/−) vs. wild-type. P values = 0.0084, 0.0026, 0.0008, 0.025, 0.0048, 0.0056, 0.0043, 0.006, 0.0046, 0.0062, 0.0004, 0.0061, 0.0004 for 13 mt-mRNAs, respectively. c, Relative levels of ten mt-tRNAs in the BAT isolated from Alkbh7 knockout mice (Alkbh7−/−) vs. wild-type. P values = <0.0001, 0.0001, 0.7191, 0.0745, 0.4192, 0.053, 0.1789, 0.0005, 0.4229, 0.4391 for ten mt-tRNAs, respectively. d, Relative levels of ten mt-tRNAs in the liver isolated from Alkbh7 knockout mice (Alkbh7−/−) vs. wild-type. P values = 0.0221, 0.0485, 0.1482, 0.0484, 0.0086, 0.5072, 0.2898, 0.1218, 0.036, 0.1803 for ten mt-tRNAs, respectively. e, Relative levels of ten mt-tRNAs in the kidney isolated from Alkbh7 knockout mice (Alkbh7−/−) vs. wild-type. P values = <0.0001, 0.0056, 0.9016, 0.0086, <0.0001, 0.455, 0.0752, 0.0029, 0.0022, 0.0012 for ten mt-tRNAs, respectively. For c-e, mouse U6 snRNA was used for normalization. For a-e, n = 6 biologically independent samples; unpaired, two-tailed t-test; data are presented as mean values ± SD. f, Western blotting of mitochondrial marker Vdac (normalized to β-tubulin) in the lysate from BAT, liver and kidney isolated from Alkbh7 knockout mice (Alkbh7−/−) vs. wild-type. Two rounds of immunoblots for biologically independent samples were performed, with similar results obtained. g-h, Mitochondrial fatty acid oxidation (FAO) assay on five mouse tissues, where the fresh tissue lysate was incubated with FAO substrate octanoyl-CoA for 60 minutes (g) and 90 minutes (h), which is further oxidized in mitochondria. For g, P values = 0.1519, 0.0196, 0.1916, 0.2827, 0.4914 for 5 tissues, respectively; for h, P values = 0.7372, 0.0068, 0.0879, 0.8232, 0.0389 for 5 tissues, respectively. For g-h, n = 8 biologically independent samples; unpaired, two-tailed t-test; data are presented as mean values ± SD. For a-e and g-h, NS P ≥ 0.05; *P < 0.05; **P < 0.01; ***P < 0.001; and ****P < 0.0001.
Fig. 1 ∣
Fig. 1 ∣. Human ALKBH7 regulates mitochondrial m22G methylation in mt-dsRNA.
ae, RT misincorporation frequency (input versus engineered AlkB treatment) at m1A in mt-tRNAs (fourteen m1A9 and three m1A58 sites; ****P < 0.0001; paired, two-tailed t-test; n = 17 independent m1A sites; a), m3C32 in mt-tRNAs and cytoplasmic (ct) tRNAs (eight m3C32 sites; ****P < 0.0001; paired, two-tailed t-test; n = 8 independent m3C sites; b), m1G in mt-tRNAs (five m1G9 and four m1G37 sites; ****P < 0.0001; paired, two-tailed t-test; n = 9 independent m1G sites; c), m1A58 in 3 mt-tRNAs that contain m1A58 (d) and G26 in 6 mt-tRNAs containing G26 (e). For d,e, n = 2 biologically independent samples. f, A9, G9 and G37 in mature mt-tRNA compared with those in enriched mt-dsRNA. A9: **P = 0.0082; paired, two-tailed t-test; n = 12 independent m1A sites. G9: P = 0.1502; paired, two-tailed t-test; n = 5 independent m1G sites. G37: P = 0.0795; paired, two-tailed t-test; n = 4 independent m1G sites. For ac and f, each data point represents one methylation site, with the average misincorporation from two biologically independent samples; data are presented as mean values ± s.d. HepG2 cells were used for af. g, mt-Ile m22G in mature mt-tRNA compared with that in enriched mt-dsRNA in HepG2 and HeLa cells. WT, wild type; o/e, overexpression. h, m22G in mt-dsRNA (mt-Ile region) in TRMT1-depleted HeLa cells versus the control. i, mt-Leu1 m1A in mature mt-tRNA compared with that in enriched mt-dsRNA in HepG2 and HeLa cells. j, m22G in mt-dsRNA (mt-Ile region) in siALKBH7 HepG2 cells versus siControl. k, m22G in mt-dsRNA (mt-Ile region) in ALKBH7-knockout HepG2 cells versus the wild type. l, m1A in mt-dsRNA (mt-Leu1 region) in siALKBH7 HepG2 cells versus siControl. m, m1A in mt-dsRNA (mt-Leu1 region) in ALKBH7-knockout HepG2 cells versus the wild type. For gm, n = 2, biologically independent samples. n, A schematic of four types of methylated bases detected within mt-dsRNA: m22G (yellow diamond), m1A (green circle for m1A58), m1A (light blue square for m1A9) and m1G (both m1G9 and m1G37, red ring). The junction sites monitored in this study are marked with blue arrows.
Fig. 2 ∣
Fig. 2 ∣. ALKBH7 catalyses m22G demethylation.
a, Modification levels of m22G/A, m2G/A and m1G/A by LC–MS/MS for an RNA probe mimicking mt-Ile after in vitro treatment with recombinant human TRMT1. b, Modification levels of m22G/A in RNA before and after treatment with recombinant human ALKBH7. Left: mt-Ile ssRNA probe; **P = 0.0061 and **P = 0.0061 for ALKBH7 5 μM and 10 μM versus input, respectively; unpaired, two-tailed t-test. Right: folded mt-Ile tRNA probe; **P = 0.0034 and **P = 0.0035 for ALKBH7 5 μM and 10 μM versus input, respectively; unpaired, two-tailed t-test. c, Modification levels of m2G/A in RNA before and after treatment with recombinant human ALKBH7. Left: mt-Ile ssRNA probe; *P = 0.0148 and ***P = 0.0004 for ALKBH7 5 μM and 10 μM versus input, respectively; unpaired, two-tailed t-test. Right: folded mt-Ile tRNA probe; **P = 0.0016 and **P = 0.0018 for ALKBH7 5 μM and 10 μM versus input, respectively; unpaired, two-tailed t-test. Most m22G modifications were converted to G. d, Modification levels of m22G/A in a dsRNA probe mimicking the mt-Ile region in mt-dsRNA before and after treatment with recombinant human ALKBH7. ***P = 0.0002 and ***P = 0.0002 for ALKBH7 5 μM and 10 μM versus input, respectively; unpaired, two-tailed t-test. e, ALKBH7 mediates RNA m22G demethylation. f, Modification levels of m1A/A in a ssRNA probe mimicking the mt-Leu1 region in mt-dsRNA before and after treatment with recombinant human ALKBH7. ***P = 0.0005 and ***P = 0.0005 for ALKBH7 5 μM and 10 μM versus input, respectively; unpaired, two-tailed t-test. g, Modification levels of m1A/A in a dsRNA probe mimicking the mt-Leu1 region in mt-dsRNA before and after treatment with recombinant human ALKBH7. ***P = 0.0005 and ***P = 0.0008 for ALKBH7 5 μM and 10 μM versus input, respectively; unpaired, two-tailed t-test. For ad,f,g, n = 3 biologically independent samples; data are presented as mean values ± s.d.
Fig. 3 ∣
Fig. 3 ∣. ALKBH7-mediated m22G demethylation affects polycistronic mt-RNA processing and alters steady-state mt-RNA levels.
a, In vitro assay to monitor tRNA/mRNA junction site processing. The percentage of intact junction site after incubation for 30 min is shown. b, Fold enrichment calculated from the enriched mt-dsRNA flexible region (icSHAPE peak region) in siALKBH7 HepG2 cells versus siControl. c, DAMM-seq read coverage of IP-enriched dsRNA across the mitochondrial genome (protein-coding region, −3.5–16 kb). The H and L strands are shown in green and red, respectively (both normalized to 18S rRNA). d, Relative mRNA levels of 13 mt-mRNAs (normalized to ACTB) in ALKBH7-depleted HepG2 cells versus the control. P = 0.0006, 0.0053, 0.0088, 0.0139, 0.0046, 0.0069, 0.0035, 0.0027, 0.003, 0.0031, 0.0074, 0.0016 and 0.0014, respectively; unpaired, two-tailed t-test. e, Relative levels of 16 mt-tRNAs (normalized to U6 small nuclear RNA (snRNA)) in ALKBH7-depleted HepG2 cells versus the control. P = 0.0003, 0.7187, 0.0069, 0.0235, <0.0001, 0.0109, 0.003, 0.0001, 0.0028, 0.0005, <0.0001, 0.0085, 0.0356, 0.0004, 0.002 and <0.0001, respectively; unpaired, two-tailed t-test. f, Relative level of mtDNA (normalized to gDNA) in siALKBH7 versus siControl. P value = 0.7822; unpaired, two-tailed t-test. g, Normalized tRNA/mRNA junction levels in 10-min EU-labelled nascent mt-RNA extracted from siALKBH7 HepG2 cells versus siControl. P = 0.006, 0.0005, 0.0011, <0.0001, 0.0014, <0.0001, <0.0001, 0.0049, 0.0064, 0.0001, 0.0005, 0.0022 and 0.002, respectively; unpaired, two-tailed t-test. h, Normalized DAMM-seq read coverage of nascent mt-tRNA in 10-min EU-labelled mt-RNA extracted from siALKBH7 HepG2 cells versus siControl. i, Normalized DAMM-seq read coverage of nascent mt-mRNA in 10-min EU-labelled mt-RNA extracted from siALKBH7 HepG2 cells versus siControl. j, Relative mt-mRNA levels in 10-min EU-labelled nascent mt-RNA extracted from siALKBH7 HepG2 cells versus siControl. P = <0.0001, 0.0076, 0.0081, <0.0001, 0.0002, 0.136, 0.0032, 0.0041, 0.0039, 0.0001 and 0.0006, respectively; unpaired, two-tailed t-test. For a,b,h,i, n = 2 biologically independent samples. For df, n = 4 biologically independent samples; data are presented as mean values ± s.d. For g,j, n = 3 biologically independent samples; data are presented as mean values ± s.d. For dg and j, NS, P ≥ 0.05; *P < 0.05; **P < 0.01; ***P < 0.001; and ****P < 0.0001.
Fig. 4 ∣
Fig. 4 ∣. ALKBH7 loss leads to reduced protein translation and decreased mitochondrial activity.
a, A metabolic phenotype plot of oxygen consumption rate (OCR) versus extracellular acidification rate (ECAR). ALKBH7 knockdown decreases mitochondrial activity under both baseline and stress conditions. n = 6 biologically independent samples; data are presented as mean values ± s.d. b, Western blotting showed that ALKBH7 knockdown markedly decreases OXPHOS complex IV assembly by affecting mt-CO1 protein levels (normalized to β-actin). c, Western blotting showed that ALKBH7 depletion leads to a notable decrease in the level of most mt-proteins (normalized to β-tubulin). For b,c, two rounds of immunoblots for biologically independent samples were performed, with similar results obtained. d, A model scheme for the effects of ALKBH7 on mt-RNA processing.
Fig. 5 ∣
Fig. 5 ∣. Depletion of ALKBH7 in mouse tissues led to altered levels of mature mt-mRNAs and tRNAs.
a, Relative mRNA levels of 13 mt-mRNAs (normalized to mouse Actb) in BAT isolated from Alkbh7-knockout mice (Alkbh7−/−) versus wild-type mice. P = 0.0002, 0.0137, 0.0373, 0.2364, 0.0005, 0.0005, 0.0097, 0.0024, 0.0102, 0.6519, 0.0567, 0.0024 and 0.6445, respectively; unpaired, two-tailed t-test. b, Relative mRNA levels of 13 mt-mRNAs (normalized to mouse Actb) in liver isolated from Alkbh7-knockout mice (Alkbh7−/−) versus wild-type mice. P = 0.0016, 0.0116, 0.0123, 0.0085, 0.0141, 0.0108, 0.0059, 0.0045, 0.0143, 0.0099, 0.0037, 0.0047 and 0.0046, respectively; unpaired, two-tailed t-test. c, Relative tRNA levels of mt-Leu1 (normalized to mouse U6 snRNA) in BAT, liver and kidney isolated from Alkbh7-knockout mice (Alkbh7−/− versus wild-type mice. P = <0.0001, 0.0221 and <0.0001, respectively; unpaired, two-tailed t-test. d, Relative tRNA levels of mt-Ile (normalized to mouse U6 snRNA) in BAT, liver and kidney isolated from Alkbh7-knockout mice (Alkbh7−/− versus wild-type mice. P = 0.0001, 0.0485 and 0.0056, respectively; unpaired, two-tailed t-test. e, Relative tRNA levels of mt-Trp (normalized to mouse U6 snRNA) in BAT, liver and kidney isolated from Alkbh7-knockout mice (Alkbh7−/−) versus wild-type mice. P = 0.4192, 0.0086 and <0.0001, respectively; unpaired, two-tailed t-test. For ae, n = 6 biologically independent samples; data are presented as mean values ± s.d. NS, P ≥ 0.05; *P < 0.05; **P <0.01; ***P < 0.001; and ****P < 0.0001. f, Western blotting showed that Alkbh7 knockout led to decreased levels of OXPHOS complex I and III in BAT (normalized to Tomm20). Two rounds of immunoblots for biologically independent samples were performed, with similar results obtained.

References

    1. Jia G et al. N6-Methyladenosine in nuclear RNA is a major substrate of the obesity-associated FTO. Nat. Chem. Biol 7, 885–887 (2011). - PMC - PubMed
    1. Zheng G et al. ALKBH5 is a mammalian RNA demethylase that impacts RNA metabolism and mouse fertility. Mol. Cell 49, 18–29 (2013). - PMC - PubMed
    1. Solberg A et al. Deletion of mouse Alkbh7 leads to obesity. J. Mol. Cell Biol 5, 194–203 (2013). - PubMed
    1. Suzuki T et al. A complete landscape of post-transcriptional modifications in mammalian mitochondrial tRNAs. Nucleic Acids Res. 42, 7346–7357 (2014). - PMC - PubMed
    1. Barchiesi A et al. Transcription, processing, and decay of mitochondrial RNA in health and disease. Int. J. Mol. Sci 20, 2221 (2019). - PMC - PubMed

Publication types

MeSH terms