. 2021 Jul;23(7):704-717.
doi: 10.1038/s41556-021-00707-9. Epub 2021 Jul 12.

Chemotherapy-induced transposable elements activate MDA5 to enhance haematopoietic regeneration

Affiliations

Chemotherapy-induced transposable elements activate MDA5 to enhance haematopoietic regeneration

Thomas Clapes et al. Nat Cell Biol. 2021 Jul.

Erratum in

Abstract

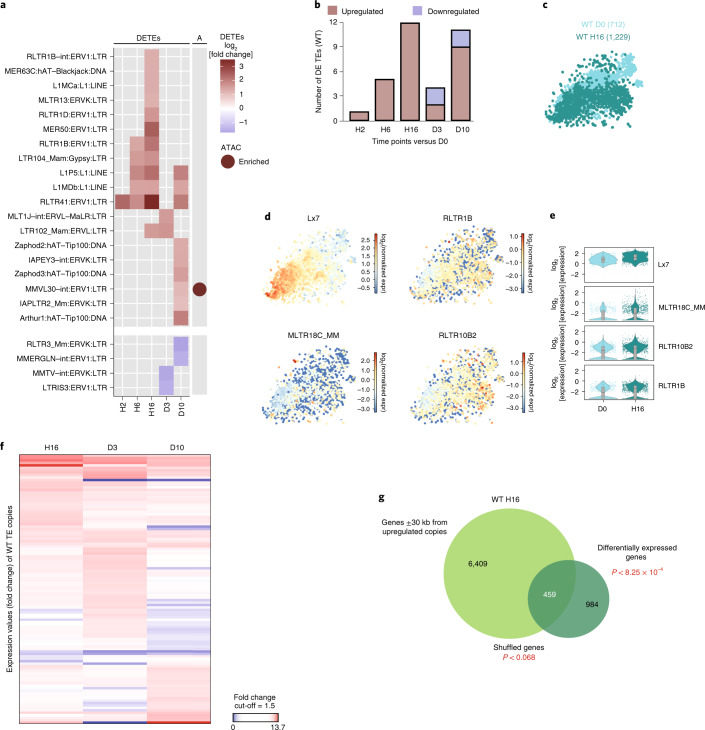
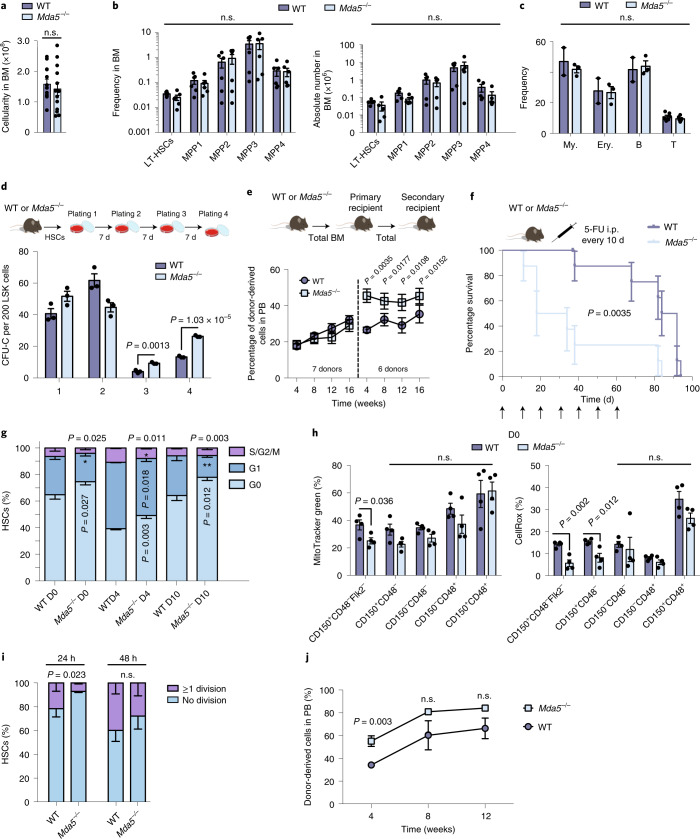
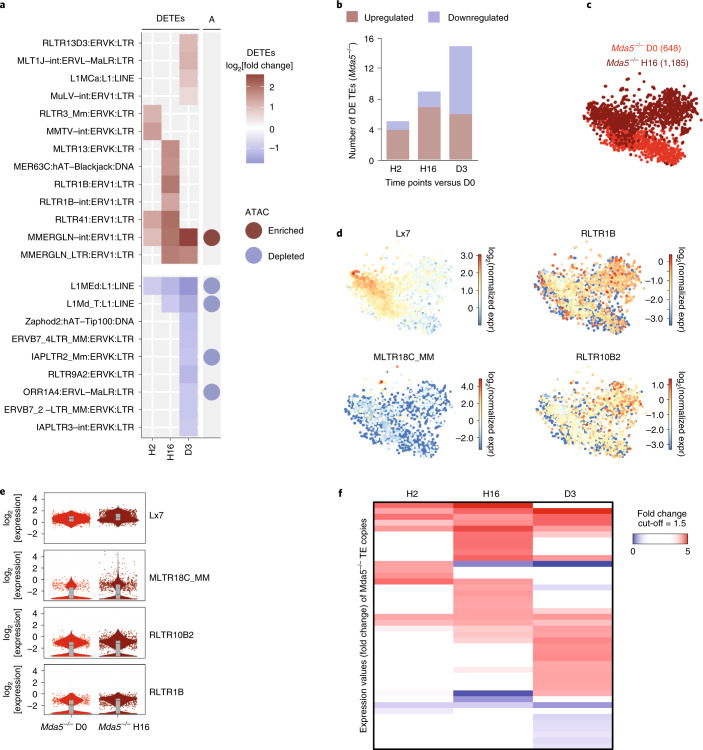
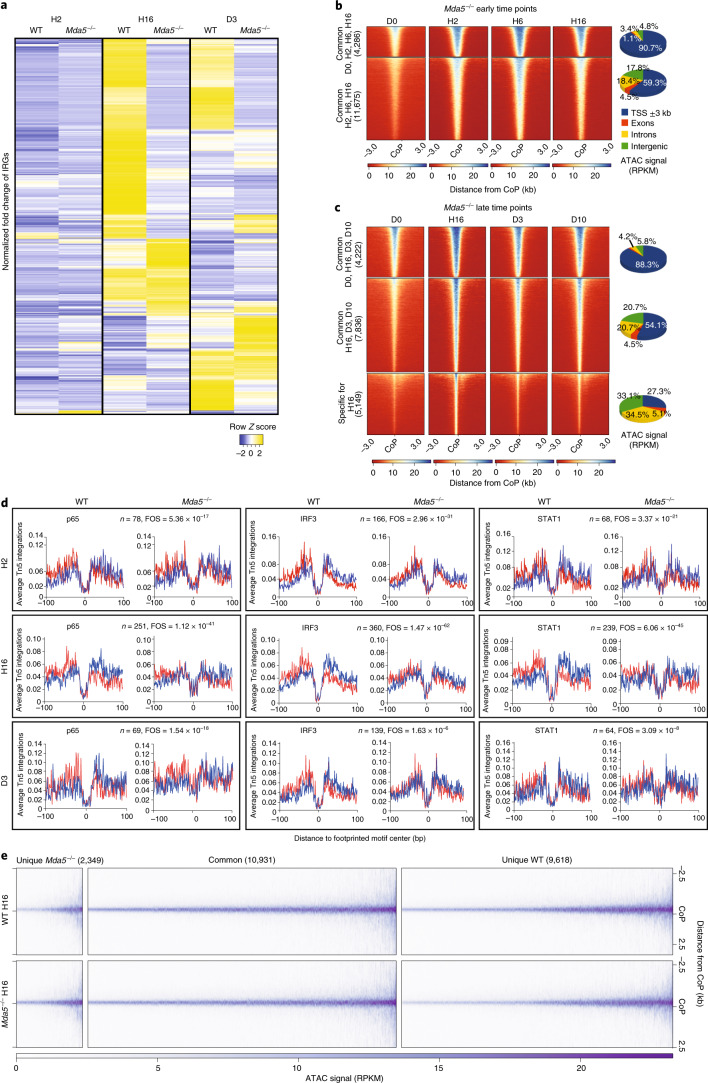
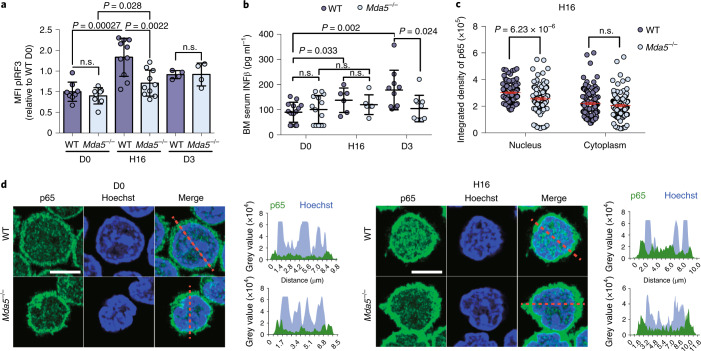
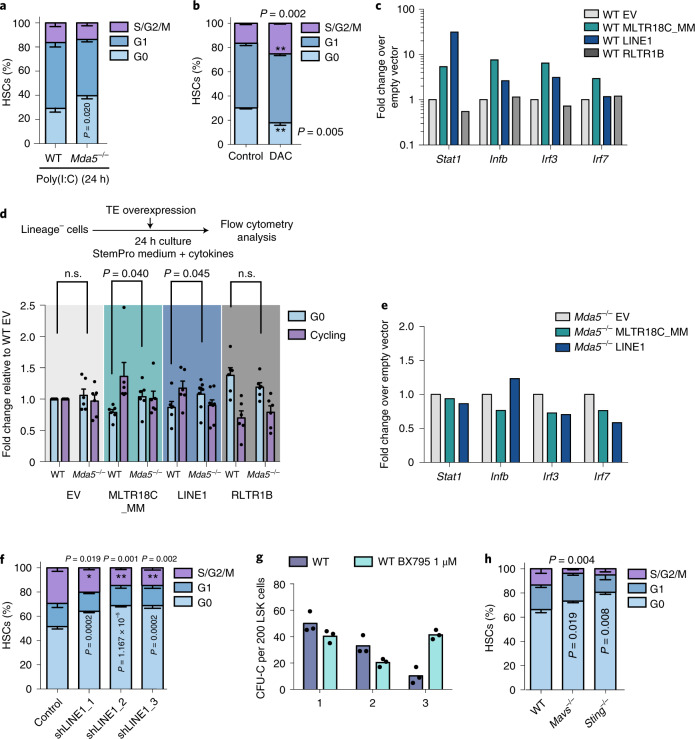
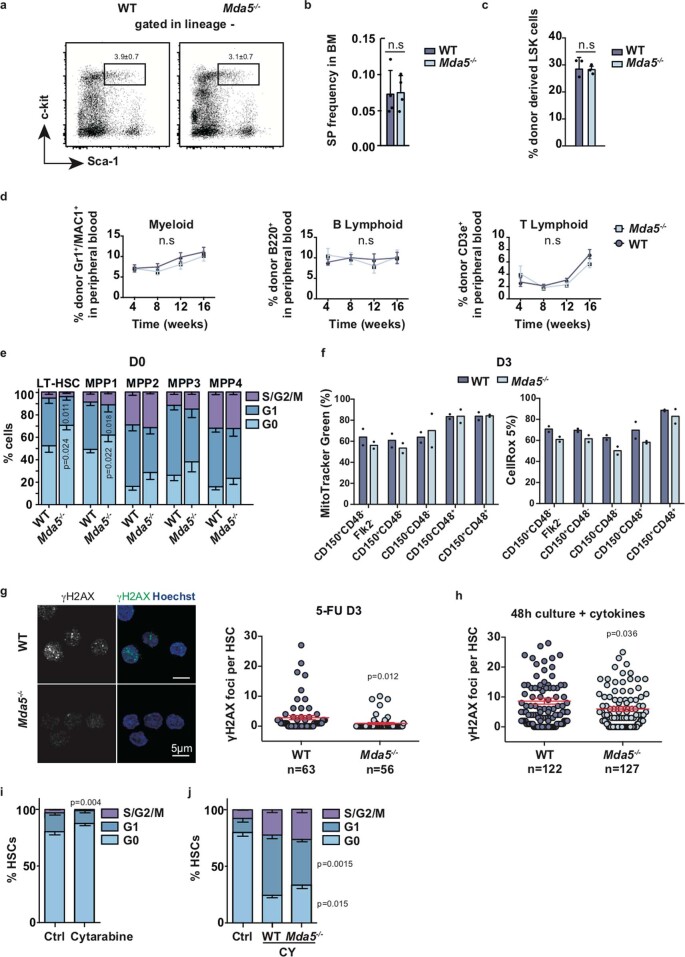
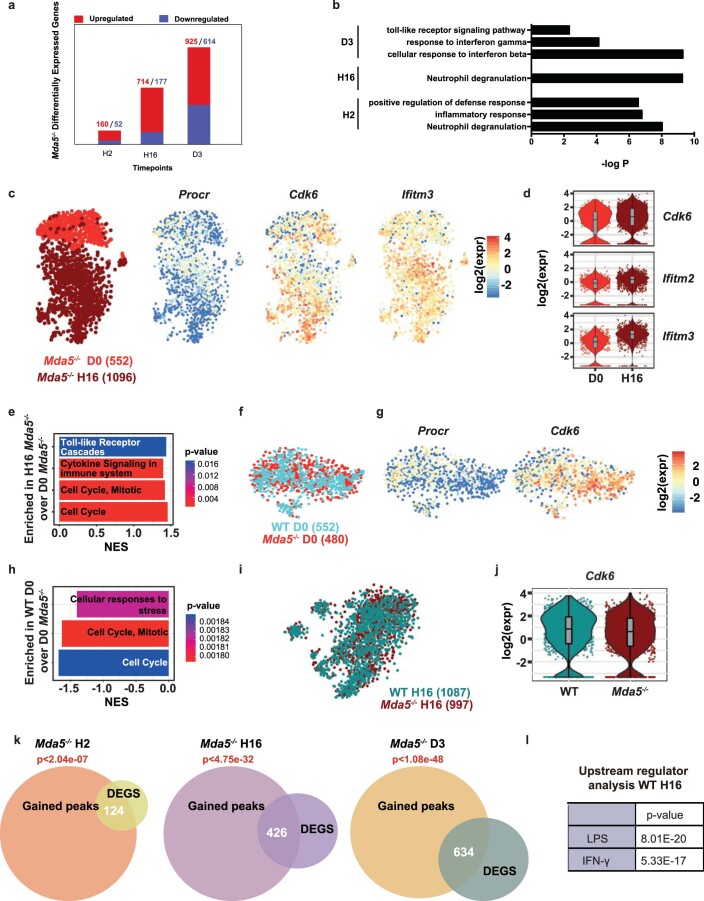
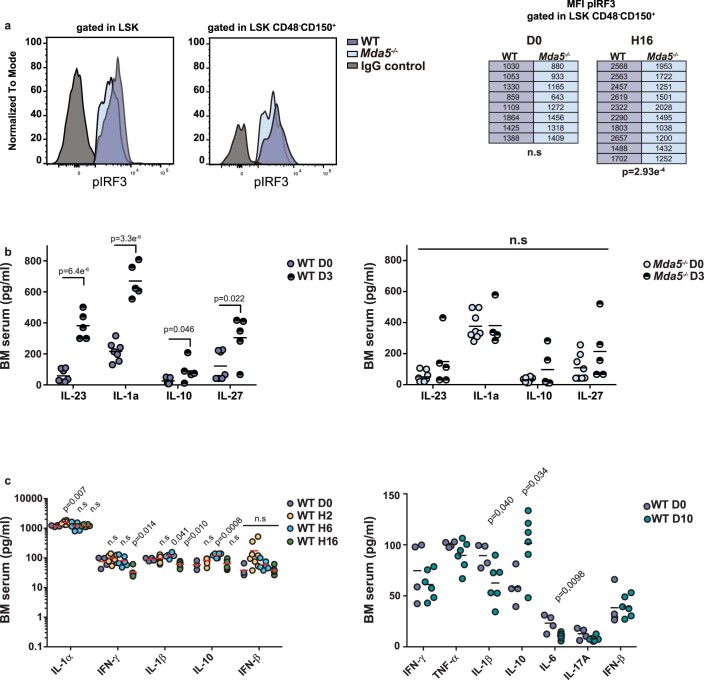
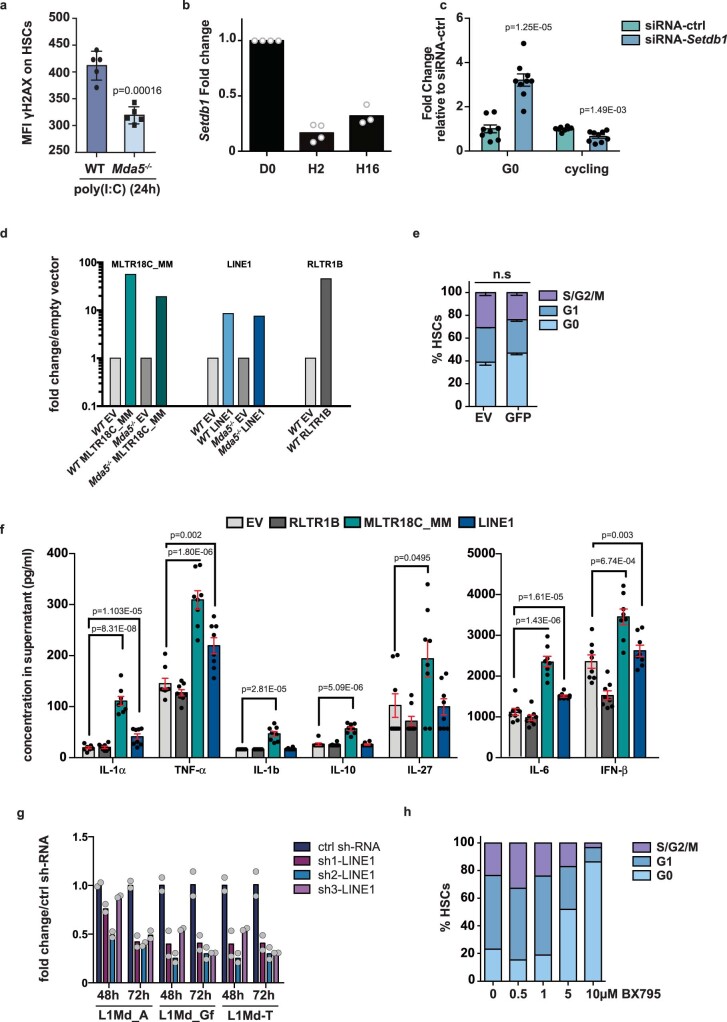
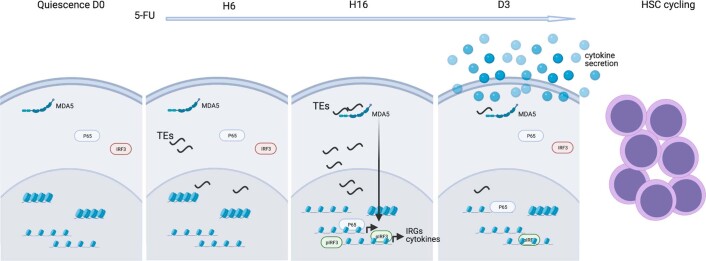
Haematopoietic stem cells (HSCs) are normally quiescent, but have evolved mechanisms to respond to stress. Here, we evaluate haematopoietic regeneration induced by chemotherapy. We detect robust chromatin reorganization followed by increased transcription of transposable elements (TEs) during early recovery. TE transcripts bind to and activate the innate immune receptor melanoma differentiation-associated protein 5 (MDA5) that generates an inflammatory response that is necessary for HSCs to exit quiescence. HSCs that lack MDA5 exhibit an impaired inflammatory response after chemotherapy and retain their quiescence, with consequent better long-term repopulation capacity. We show that the overexpression of ERV and LINE superfamily TE copies in wild-type HSCs, but not in Mda5-/- HSCs, results in their cycling. By contrast, after knockdown of LINE1 family copies, HSCs retain their quiescence. Our results show that TE transcripts act as ligands that activate MDA5 during haematopoietic regeneration, thereby enabling HSCs to mount an inflammatory response necessary for their exit from quiescence.


Conflict of interest statement

The authors declare no competing interests.

Figures

Fig. 1
Fig. 1. 5-FU treatment results in the upregulation of inflammatory signalling in HSCs.
a, The number of differentially expressed genes at different time points after 5-FU treatment in WT HSCs (LSK/SLAM). n = 2 (H2, H6 and D3) and n = 3 (D0, H16 and D10) biologically independent samples. Fold change cut-off = 1.5. Padj < 0.05. b, Heat map of the normalized fold change in the union of IRGs upregulated in WT HSCs at the indicated time points compared to D0. Fold change cut-off = 1.5. Padj < 0.05 in at least one time point. c, t-Distributed stochastic neighbour embedding (t-SNE) representation showing sorted WT HSCs at D0 in cyan and at H16 in green (the number of sequenced cells is shown in parentheses). d, GSEA of differentially expressed genes among D0 and H16 WT HSCs from c. NES, normalized enrichment score. e, The log2-transformed fold change in expression of the indicated genes at D0 or H16 in WT HSCs from c. The boxes show the interquartile range, the whiskers show the minimum and maximum values, and the horizontal line shows the median value. Each dot represents a single cell and the shape of the plot represents probability density. n = 480 (WT D0) and n = 997 (H16) cells. One independent experiment per time point. Padj < 0.05. f, t-SNE representation showing the expression of differentially expressed genes among H16 and D0 in WT HSCs. The colour scale represents the log2-transformed normalized transcript counts. g,h, Heat maps (left) of the differentially accessible regions in WT HSCs at the indicated early (g) and late (h) time points ±3 kb from the centre of the peak (CoP). Right, the genomic location distribution of the accessible regions. i, Average normalized Tn5 insertion profiles around footprinted motifs (p65, IRF3, STAT1) in merged ATAC peaks at the indicated time points after 5-FU treatment in WT HSCs. Footprint numbers (n) are indicated at the top. Footprint occupancy scores (FOS) indicate the significance versus D0. Insertions on the sense and antisense DNA strands are indicated in red and blue, respectively.
Fig. 2
Fig. 2. Rapid TE upregulation in HSCs after 5-FU treatment.
a, Heat map of the log2-transformed fold change of differentially expressed TE families (DETEs) detected in WT HSCs at the indicated time points after 5-FU treatment. TE families that have a significantly enriched ATAC-seq peak nearby (±1 kb) are highlighted in the right column (A). b, The number of upregulated or downregulated TE families at the indicated time points after 5-FU treatment. c, t-SNE representation of sorted WT HSCs (LSK/SLAM) at D0 (green) and H16 (dark green) (the number of sequenced cells is shown in parentheses). d, t-SNE representation showing the expression of differentially expressed TE families between H16 and D0 in WT HSCs. The colour scale represents the log2-transformed normalized transcript counts. e, The log2-transformed fold change in expression of the TE families in d at D0 or H16 in WT HSCs from c. The box shows the interquartile range, the whiskers show the minimum and maximum values, and the horizontal line shows the median value. Each dot represents a single cell and the shape of the plot represents probability density. n = 712 (WT D0) and n = 1,229 (H16) cells. One independent experiment per time point. Padj < 0.05. f, Heat map of the expression values (fold change) of TE copies in WT HSCs at the indicated time points compared to D0. Fold change cut-off = 1.5. Padj < 0.05. g, The overlap between genes in proximity (±30 kb from TSS of the genes) to upregulated TE copies in WT HSCs and deregulated genes at H16 (P < 8.25 × 10−4). The P value of the control overlap after gene shuffling is also shown (P < 0.068).
Fig. 3
Fig. 3. MDA5 is required for HSC activation.
a, The BM cellularity of WT or Mda5−/− mice. n = 13 biologically independent samples. Data are mean + s.d. Statistical analysis was performed using two-tailed t-tests. b, The frequency (left) and the absolute numbers (right) of LT-HSCs, and MPPs from BM of WT or Mda5−/− mice. n = 6 (BM frequency) and n = 5 (absolute numbers) biologically independent samples. Data are mean + s.d. Statistical analysis was performed using two-tailed t-tests. c, The frequency of myeloid (My; CD11+Gr1+), erythroid (Ery; Ter119+), B cells (B220+) in the BM and T cells (CD3+) in the thymus. For myeloid, erythroid and B cells, n = 2 (WT) and n = 3 (Mda5−/−); and, for T cells, n = 6 biologically independent samples. Data are mean + s.d. Statistical analysis was performed using two-tailed t-tests. d, Serial CFU-C assay of BM HSCs from WT or Mda5−/− mice scored every 7 d. n = 3 biologically independent samples. Data are mean ± s.d. Statistical analysis was performed using two-tailed t-tests. e, The percentage of donor-derived cells in peripheral blood (PB) of primary and secondary recipients in weeks after injection. The dotted line separates the primary from secondary transplantation. n = 30 (primary) and n = 15 (secondary) biologically independent samples, with n = 4 and n = 3 independent experiments, respectively. Data are mean ± s.e.m. Statistical analysis was performed using two-tailed t-tests. f, Kaplan–Meier survival curve of WT or Mda5−/− mice after 5-FU injections every 10 d. n = 8 mice. Statistical analysis was performed using the log-rank (Mantel–Cox) test. g, Cell cycle status of WT or Mda5−/− HSCs after 5-FU treatment. For WT, n = 8 (D0), n = 5 (D4) and n = 4 (D10); and, for Mda5−/−, n = 9 (D0), n = 5 (D4) n = 6 (D10) biologically independent samples. Data are mean ± s.d. Statistical analysis was performed using two-tailed t-tests. h, The frequency of cells with detectable mitochondrial mass (left) and ROS (right) at D0. n = 4 biologically independent samples. Data are mean + s.d. Statistical analysis was performed using two-tailed t-tests. i, The percentage of HSCs (LSK/SLAM, Flk2+) that had undergone at least one division or no division after 24 h or 48 h. n = 3 biologically independent samples. Data are mean ± s.d. Statistical analysis was performed using two-tailed t-tests. j, The percentage of donor-derived cells in the peripheral blood of primary recipients transplanted with either WT or Mda5−/− HSCs cultured for 48 h. n = 5 biologically independent samples. Data are mean ± s.e.m. Statistical analysis was performed using two-tailed t-tests. n.s., not significant. Source data
Fig. 4
Fig. 4. TE upregulation in Mda5−/− HSCs after chemotherapy.
a, Heat map of the log2-transformed fold change of all differentially expressed TE families detected in Mda5−/− HSCs at the indicated time points after 5-FU treatment. TE families that had a significantly enriched or depleted ATAC-seq peak nearby (±1 kb) are highlighted in the right column (A). b, The number of upregulated or downregulated TE families in Mda5−/− HSCs at the indicated time points after 5-FU treatment. c, t-SNE representation of sorted Mda5−/− HSCs (LSK/SLAM) at D0 (red) and H16 (dark red) (the number of sequenced cells is indicated in parentheses). d, t-SNE representation showing the expression of differentially expressed TE families between H16 and D0 in Mda5−/− HSCs. The colour scale represents the log2-transformed normalized transcript counts. e, The log2-transformed fold change in expression of the TE families shown in d at D0 or H16 in Mda5−/− HSCs from c. The box shows the interquartile range, the whiskers show the minimum and maximum values, and the horizontal line shows the median value. Each dot represents a single cell and the shape of the plot represents probability density. n = 648 (D0) and n = 1,185 (H16) Mda5−/− cells. One independent experiment per time point. Padj < 0.05. f, Heat map of the expression values (fold change) of TE copies in Mda5−/− HSCs at the indicated time points compared to D0. Fold change cut-off = 1.5. Padj < 0.05.
Fig. 5
Fig. 5. Impaired inflammatory signalling in Mda5−/− HSCs.
a, Heat map of the normalized fold change in the union of IRGs upregulated in control WT or Mda5−/− HSCs at the H2, H16 or D3 time points compared to D0. Fold change cut-off = 1.5. Padj < 0.05, at least at one time point. b,c, Heat map (left) of the common and differentially accessible regions in Mda5−/− HSCs at D0, H2, H6 and H16 (b) or at D0, H16, D3 and D10 (c) ±3 kb from the centre of the peak. Right, the genomic location distribution of the accessible regions in each cluster of the heat map. d, Average normalized Tn5 insertion profiles around footprinted motifs (p65, IRF3, STAT1) in merged ATAC peaks at the indicated time points after 5-FU treatment in WT or Mda5−/− HSCs. Footprint numbers (n) are indicated at the top. Footprint occupancy scores indicate significance versus D0. Insertions on the forward and reverse DNA strands are indicated in red and blue, respectively. e, Heat map of common and differentially accessible regions in WT and Mda5−/− HSCs at H16.
Fig. 6
Fig. 6. 5-FU-induced inflammation is MDA5-dependent.
a, Relative changes in median fluorescence intensity (MFI) of phosphorylated IRF3 (pIRF3) in WT or Mda5−/− HSCs at D0, H16 or D3 after 5-FU treatment, normalized to the WT D0. n = 8 biologically independent samples in n = 3 independent experiments (D0), n = 10 biologically independent samples in n = 3 independent experiments (H16) and n = 4 biologically independent samples in one experiment (D3). Each dot represents one mouse. Data are mean ± s.d. Statistical analysis was performed using two-tailed t-tests; n.s. not significant. b, The amount of IFNβ (pg ml−1) measured in the BM serum of WT or Mda5−/− mice at D0, H16 or D3 after 5-FU treatment. Each dot represents one mouse. n = 14 (D0), n = 6 (H16), n = 10 (D3) biologically independent samples in n = 2 (D0 and D3) and n = 1 (H16) independent experiments. Data are mean ± s.d. Statistical analysis was performed using two-tailed t-tests; n.s., not significant. c, The integrated density of the NF-κB subunit p65 in the cytoplasm and the nucleus of WT or Mda5−/− HSCs at H16 after 5-FU treatment. n = 129 (WT) and n = 132 (Mda5−/−) HSCs examined in n = 2 independent experiments. Statistical analysis was performed using two-tailed t-tests; n.s., not significant. d, Immunostaining for NF-κB subunit p65 in WT or Mda5−/− HSCs at D0 and H16 after 5-FU treatment. n = 2 independent experiments. Scale bar, 5 μm. The histograms on the right represent the grey value intensity of both p65 (green) and Hoechst (blue) as indicated in the figure by the red dashed line. Source data
Fig. 7
Fig. 7. Intrinsic role of Mda5 in HSCs.
a, Serial CFU-C assays in WT HSCs transfected with a control or an Mda5 short interfering RNA (siRNA) pool. Colony counts were scored every 7 d. n = 12 technical replicates from n = 4 biologically independent experiments. Statistical analysis was performed using two-tailed t-tests. b, qPCR analysis of Mda5 expression in WT HSCs transfected with a control or an Mda5 siRNA pool. n = 4 biologically independent samples. c, Cell cycle analysis of HSCs transfected with a control (n = 4 biologically independent samples) or an Mda5 siRNA pool (n = 7 biologically independent samples). Data are mean ± s.d. Statistical analysis was performed using two-tailed t-tests. d, The percentage of donor-derived cells in the peripheral blood of WT or Mda5−/− primary recipients (week 4: n = 12 (WT) and n = 14 (Mda5−/−); and weeks 8, 12 and 16: n = 13 (WT and Mda5−/−) biologically independent samples) and secondary recipients (n = 8 (WT) and n = 7 (Mda5−/−) biologically independent samples). The dotted line separates the primary from secondary transplantation. Data are mean ± s.e.m. Statistical analysis was performed using two-tailed t-tests. e, Kaplan–Meier survival curve of WT or Mda5−/− primary recipient mice after 5-FU injections every 10 d, 16 weeks after intravenous injection of total BM cells from WT mice. n = 8 mice. Statistical analysis was performed using the log-rank (Mantel–Cox) test; n.s., not significant. f, The cell cycle status of HSCs in chimaeras injected with the indicated ratios of WT and Mda5−/− BM. Left, WT HSCs gated on CD45.1+CD45.2+ (CD45.1.2) cells. Right, Mda5−/− HSCs gated on CD45.2+ cells, and the BM composition is indicated below. The groups were injected with 5-FU 4 d before the analysis. Data are mean ± s.d. No 5-FU: n = 4; with 5-FU: n = 6 (15:85), n = 5 (50:50), n = 9 (85:15) biologically independent samples in n = 2 independent experiments. Statistical analysis was performed using two-tailed t-tests. g, Heat map of the normalized fold change in the union of IRGs that are upregulated in WT HSCs and in WT myeloid (Myelo.) cells or Mda5−/− HSCs and Mda5−/− myeloid cells at H16 after 5-FU treatment compared with D0. Fold change cut-off = 1.5. Padj < 0.05. Source data
Fig. 8
Fig. 8. TE overexpression leads to HSC activation and knockdown leads to quiescence.
a, Cell cycle analysis of WT or Mda5−/− HSCs 24 h after poly(I:C) injection. n = 4 biologically independent samples. Data are mean ± s.d. Statistical analysis was performed using two-tailed t-tests. b, Cell cycle analysis of WT HSCs 72 h after decitabine (DAC) treatment or without DAC (control). n = 3 biologically independent samples. Data are mean ± s.d. Statistical analysis was performed using two-tailed t-tests. c, qPCR analysis of IRGs in WT HSCs transfected with an EV or different TE copies (both strands) as indicated. n = 2 biologically independent samples and experiments. d, The fold change relative to WT transfected with an EV of WT or Mda5−/− HSCs in G0 or cycling after transfection with EV or the indicated TE copies (both strands). n = 6 biologically independent samples and experiments. Data are mean ± s.d. Statistical analysis was performed using two-tailed t-tests; n.s., not significant. e, qPCR analysis of IRGs in Mda5−/− HSCs transfected with an EV or the indicated TE copies (both strands). n = 2 biologically independent samples and experiments. f, Cell cycle analysis of WT HSCs after transfection with control shRNA or knockdown of LINE1 with three different specific shRNAs. n = 3 biologically independent experiments with n = 2 replicates each. Statistical analysis was performed using two-tailed t-tests. Data are mean ± s.d. g, Serial CFU-C assay of BM HSCs from WT mice cultured for 48 h in the absence (WT) or presence of 1 μM TBK1 inhibitor (WT BX795). Colony counts were scored every 7 d. Representative of n = 2 independent experiments (n = 3 technical replicates). h, Cell cycle status of WT (n = 5 biologically independent samples) or Mavs−/− (n = 11 biologically independent samples) or Sting−/− (n = 3 biologically independent samples) HSCs determined by flow cytometry with Ki67 and Hoechst staining. n = 2 independent experiments. Data are mean ± s.d. Statistical analysis was performed using two-tailed t-tests. Source data
Extended Data Fig. 1
Extended Data Fig. 1. HSC isolation after chemotherapy.
a, Schematic of the experimental strategy followed for the RNA-seq and ATAC-seq experiments on WT HSCs. b, Gating strategies for sorting HSCs from the BM of D0 or 5-FU-injected (H2, H6, H16, D3, D10) mice (15 biologically independent samples- representative plots are shown). c, Comparison of our sorting strategy (LSK/SLAM) to the HSCs sorted using EPCR/SLAM (EPCR+CD48CD1450+) markers. The EPCR/SLAM HSCs are then projected on the LSK/SLAM gating strategy (red color) and the percentage of EPCR/SLAM HSCs that are included in the LSK/SLAM gate is indicated (2 biologically independent samples- representative plots are shown). d, Comparison of the number of cells in the LSK/SLAM gate that are not EPCR/SLAM at D0 and H16 (2 biologically independent samples- representative plots are shown). e, Gene ontology analysis of the genes upregulated at H2, H16 and D10 after 5-FU injection compared to D0 in WT HSCs. X-axis depicts -logP. f, Venn diagrams depicting the overlap of differentially expressed genes (DEGs) in WT HSCs with genes assigned to newly accessible regions-gained ATAC peaks at the indicated time points compared to D0 (-100/+25 kb from TSS, p-values represent hypergeometric test). g, Gene ontology analysis of deregulated genes that also exhibit changes in chromatin accessibility at the indicated time points. X-axis depicts -logP.
Extended Data Fig. 2
Extended Data Fig. 2. TEs bind to MDA5 upon stress in human and mouse cells.
a, Bar graphs depicting the mean counts of LINE, SINE, LTR and DNA transposon (DNA) RNA (fold change >1.5 and p-value < 0.05) bound to MDA5 or GFP after irradiation or decitabine treatment (sense DNA strand-upper panel, antisense DNA strand-lower panel) (n = 2 biologically independent population samples, 2 independent experiments). b, Bar graphs depicting the mean counts of LINE, SINE, LTR and DNA transposon (DNA) RNA (fold change >1.5 and p-value < 0.05) bound to MDA5 after irradiation or decitabine treatment or to MDA5 without treatment (sense DNA strand-upper panel, antisense DNA strand-lower panel) (n = 2 biologically independent population samples, 2 independent experiments). c, Representative track that shows binding of L1M4c to GFP after irradiation or decitabine treatment and to MDA5 without treatment or after irradiation or decitabine treatment. Y-axis represents RPKM. Crosslinking events are also shown. d-e qPCR experiments after FLASH depicting binding of TEs to GFP or MDA5 after irradiation or decitabine treatment (d) or to MDA5 without treatment or after irradiation or decitabine treatment (e) (n = 2 biologically independent samples and experiments). f, qPCR experiment after FLASH from mouse OP9 cells depicting binding of LINE1 elements to GFP or MDA5 without treatment or after irradiation (n = 2 biologically independent samples and experiments). Source data
Extended Data Fig. 3
Extended Data Fig. 3. MDA5 is required for HSC activation.
a, Representative profile comparing Sca-1 expression on the lineage negative fraction of the BM of WT or Mda5-/- mice (3 biologically independent samples, one representative plot is shown). b, Side population (SP) frequency in the BM of WT or Mda5-/- mice (n = 4 biologically independent samples, mean+s.d, two-tailed t-test, n.s. non-significant). c, Homing assay: percentage of donor derived LSK cells in the BM of WT recipients (n = 3 biologically independent samples) 16hrs after injection of BM cells from WT or Mda5-/- mice (mean + s.d., two-tailed t-test, n.s. non-significant). d, Percentage of donor derived myeloid, B or T lymphoid cells in the peripheral blood of recipients injected with BM cells isolated from WT (n = 30 biologically independent samples) or Mda5-/- mice (n = 27 biologically independent samples). Time (weeks) denotes the time after intravenous injection (mean ± s.d, two-tailed t-test, n.s. non-significant). e, Cell cycle analysis of HSCs and MPPs as indicated (n = 7 biologically independent samples, mean-s.d., two-tailed t-test). f, Bar graphs depicting the frequency of cells with detectable mitochondrial mass measured by MitoTracker Green (left panel) and reactive oxygen species (ROS) production (right panel) at D3 after 5-FU injection (n = 2 biologically independent samples and experiments). g, Images of γH2AX foci positive HSCs from WT or Mda5-/- mice (left) and quantification of γH2AX foci per nuclei at D3 after 5-FU injection (mean ± s.e.m., two-tailed t-test, n = 64-WT and 56-Mda5-/- cells examined in 2 independent experiments). h, Dot plot representing quantification of γH2AX foci per WT or Mda5-/- HSCs nuclei quantified with Imaris software 9.2 after culturing cells for 48 h (n = 121-WT and n = 127-Mda5-/- cells examined in 2 independent experiments, mean±s.e.m., two-tailed t-test, *P = 0.036). i, Cell cycle analysis of WT HSCs after cytarabine treatment (n = 4 biologically independent samples and experiments, mean-s.d., two-tailed t-test). j, Cell cycle analysis of WT and Mda5-/- HSCs after cyclophosphamide (n = 7 biologically independent samples and experiments, mean-s.d., two-tailed t-test). Source data
Extended Data Fig. 4
Extended Data Fig. 4. 5-FU treatment in Mda5-/- HSCs.
a, Bar graphs depicting the number of differentially expressed genes at different time points after 5-FU treatment in Mda5-/-HSCs (H2, H16: n = 2 and D0, D3: n = 3 biologically independent samples, fold change cut-off 1.5, Padj < 0.05). b, Gene ontology of upregulated genes at indicated time points versus D0. c, t-SNE representation of Mda5-/- HSCs at D0 (red) and H16 (dark red) (left) (number of sequenced cells in parentheses). t-SNE representation of DEGs between H16 and D0 in Mda5-/- HSCs. Color scale: log2 of normalized transcript counts (right) d, Violin plots depicting log2 fold change expression at D0 or H16 in Mda5-/- HSCs. Box: interquartile range, whiskers: minimum and maximum values, horizontal line: median. Each dot represents a single cell; the plot shape declares probability density (n = 552 Mda5-/- D0 and n = 1096 H16 cells, one independent experiment per time point, Padj < 0.05). e, Gene set enrichment analysis in Mda5-/- HSCs from c between D0 and H16 f, t-SNE representation of WT (blue) and Mda5-/- HSCs (red) at D0 (number of sequenced cells in parentheses). g, t-SNE representation of DEGs between H16 and D0 in WT and Mda5-/- HSCs. Color scale: log2 of normalized transcript counts. h, Gene set enrichment analysis between WT and Mda5-/- HSCs at D0. i, t-SNE representation of WT (green) and Mda5-/- HSCs (red) at H16 (number of sequenced cells in parentheses). j, Violin plots depicting log2 expression of Cdk6 at H16 in WT and Mda5-/- HSCs. Box: interquartile range, whiskers: minimum and maximum values, horizontal line: median. Each dot represents a single cell; the plot shape declares probability density (n = 1087 WT H16 and n = 997 Mda5-/- H16 cells, one independent experiment per time point, Padj < 0.05). k, Venn diagrams depicting the overlap of differentially expressed genes (DEGs) with genes gaining accessibility (-100/+25 kb from TSS) (p-values: hypergeometric test). l, Table of upstream regulators for WT unique accessible regions assigned to proximal genes (+/-25kB) at H16.
Extended Data Fig. 5
Extended Data Fig. 5. 5-FU treatment induces inflammation.
a, Representative plot depicting phospho-IRF3 staining in WT and Mda5-/- HSCs gated in LSK cells or HSCs (left panels). Tables depicting the mean fluorescence intensity (MFI) of pIRF3 in WT and Mda5-/- HSCs at the indicated time points (right panels) (two-tailed t-test, P values are indicated below). b, Measurement of secreted cytokines in WT (left) or Mda5-/- (right) BM at D0 and D3 (n = 7 D0 and n = 5 D3 for WT and n = 8 D0 and n = 5 D3 for Mda5-/- biologically independent samples, 2 independent experiments, two-tailed t-test, n.s: not significant, horizontal line: mean). c, Measurement of secreted cytokines in WT bone marrow at D0 (n = 4), H2 (n = 8), H6 (n = 6) and H16 (n = 6) (left) or D0 (n = 4) and D10 (n = 6) (right) (all biologically independent samples, 2 independent experiments two-tailed t-test, n.s: not significant, horizontal line: mean). Source data
Extended Data Fig. 6
Extended Data Fig. 6. TE expression affects HSC cell cycle.
a, Bar chart depicting the median fluorescence intensity (MFI) of γH2AX signal of WT or Mda5-/- HSCs 24 h after poly(I:C) injection (n = 5 biologically independent samples, mean±s.d., two-tailed t-test). b, RT-qPCR analysis of WT HSCs at D0, H2 and H16 after 5-FU injection for Setdb1 (n = 4 biologically independent samples for D0 and H2, n = 3 for H16 biologically independent samples in two independent experiments). c, Cell cycle analysis of WT HSCs after transfection of control or Setdb1 siRNA (n = 8 biologically independent samples for control siRNA and n = 9 for si-Setdb1 in two independent experiments, two-tailed t-test, mean + /-s.d). d, qRT-PCR analysis of HSCs 20 h after transfection with empty vector (EV), or both strands of the indicated TE copies in WT or Mda5-/- HSCs (n = 2 biologically independent samples). e, Cell cycle analysis of WT HSCs transfected with empty vector (EV) or the vector expressing GFP (n = 2 for EV and n = 3 for GFP biologically independent samples, two-tailed t-test, mean-s.d, n.s. non-significant). f, Measurement of secreted cytokines in supernatant of WT HSCs transfected as indicated (n = 8 biologically independent samples, 2 independent experiments, mean ± s.e.m, two-tailed t-test) g, qRT-PCR analysis of LSK cells 48 h or 72 h after knock-down of LINE1 families (n = 2 biologically independent samples). h, Cell cycle analysis of WT HSCs 48 hours after culture in presence of the indicated concentration of TBK1 inhibitor (BX795) (n = 2 biologically independent samples). Source data
Extended Data Fig. 7
Extended Data Fig. 7. Effect of the TE-MDA5-Inflammation axis on HSC activation.
Schematic showing that chromatin rearrangement occurs after chemotherapy concomitant to activation of TEs that are transcribed (H6-H16). TE transcripts bind to MDA5 to induce phosphorylation and thus activation of IRF3 and translocation of p65 to the nucleus (H16). This leads to activation of interferon responsive genes (H16) and secretion of proinflammatory cytokines (D3) followed by HSC cycling. Created with BioRender.com.

References

    1. Trumpp A, Essers M, Wilson A. Awakening dormant haematopoietic stem cells. Nat. Rev. Immunol. 2010;10:201–209. - PubMed
    1. Mendelson A, Frenette PS. Hematopoietic stem cell niche maintenance during homeostasis and regeneration. Nat. Med. 2014;20:833–846. - PMC - PubMed
    1. He S, Nakada D, Morrison SJ. Mechanisms of stem cell self-renewal. Annu. Rev. Cell Dev. Biol. 2009;25:377–406. - PubMed
    1. Baldridge MT, King KY, Boles NC, Weksberg DC, Goodell MA. Quiescent haematopoietic stem cells are activated by IFN-γ in response to chronic infection. Nature. 2010;465:793–797. - PMC - PubMed
    1. Essers MA, et al. IFNα activates dormant haematopoietic stem cells in vivo. Nature. 2009;458:904–908. - PubMed

Publication types

MeSH terms