. 2021 Nov 16;30(23):2332-2346.
doi: 10.1093/hmg/ddab188.

Excess membrane binding of monomeric alpha-, beta- and gamma-synuclein is invariably associated with inclusion formation and toxicity

Affiliations

Excess membrane binding of monomeric alpha-, beta- and gamma-synuclein is invariably associated with inclusion formation and toxicity

Tae-Eun Kim et al. Hum Mol Genet. .

Abstract

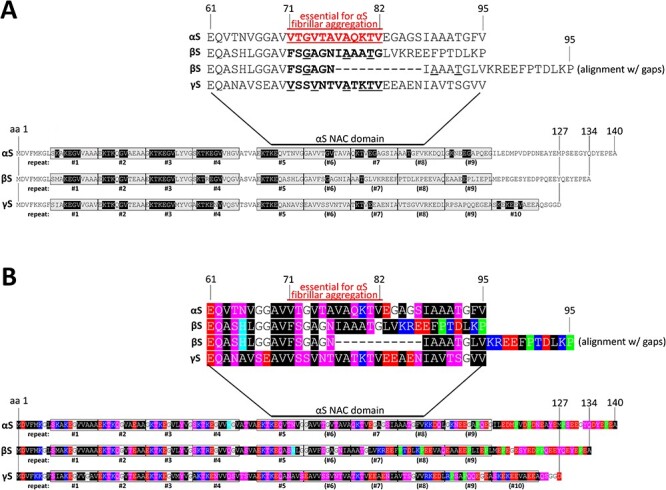
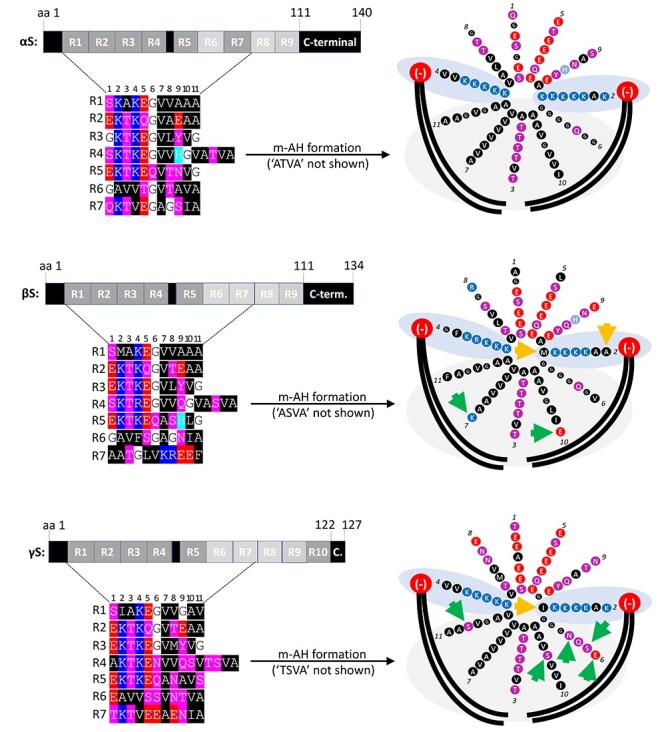
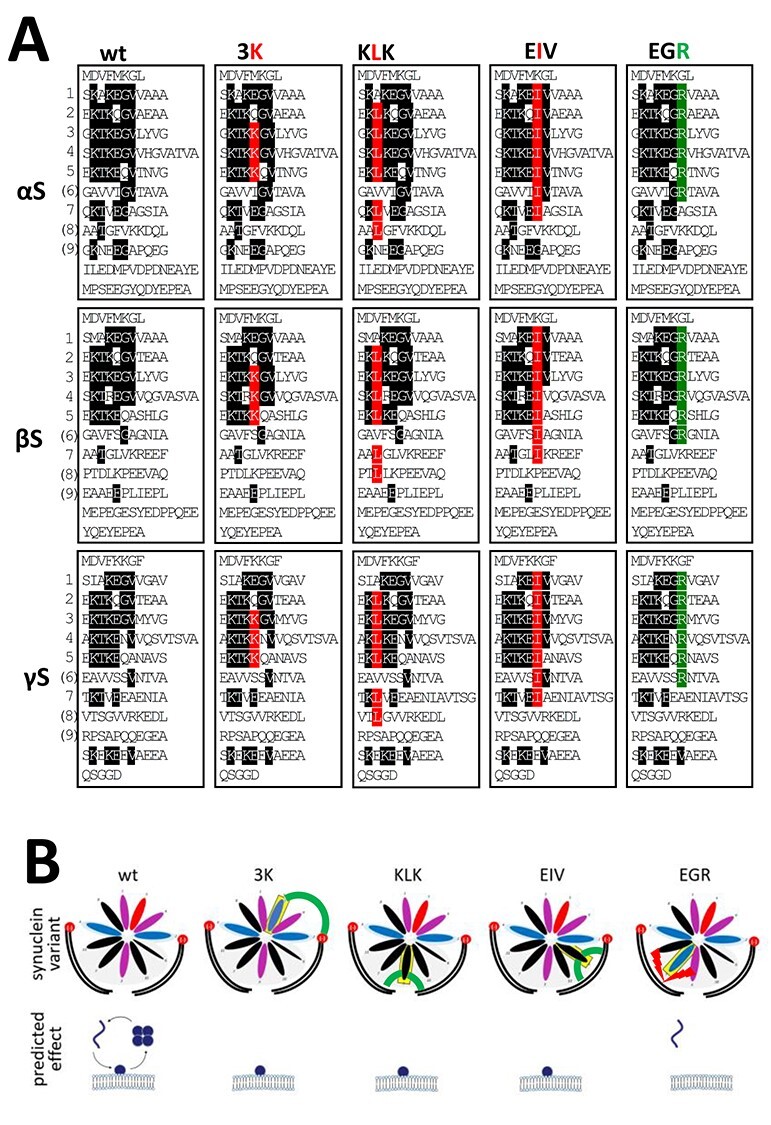
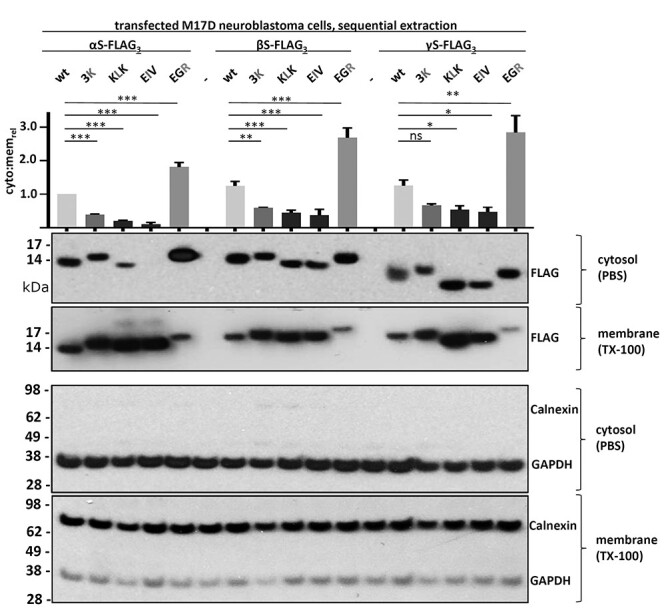
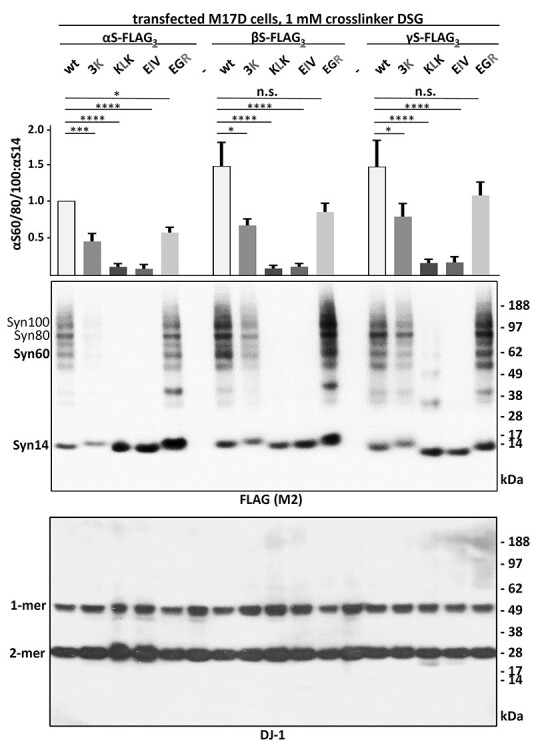
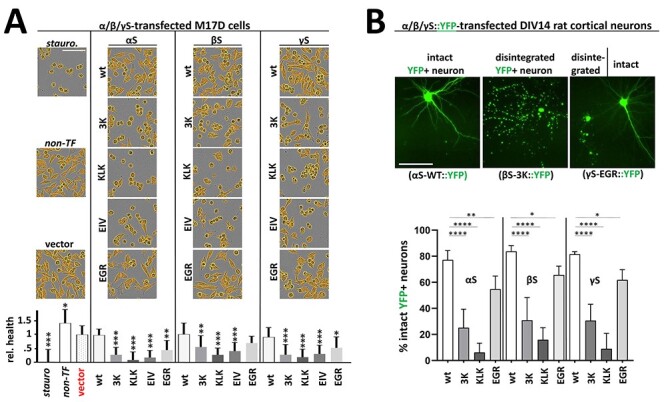
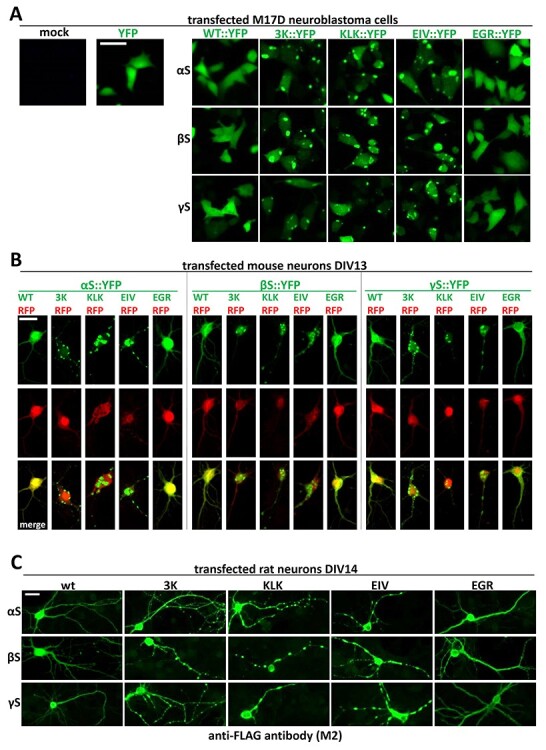
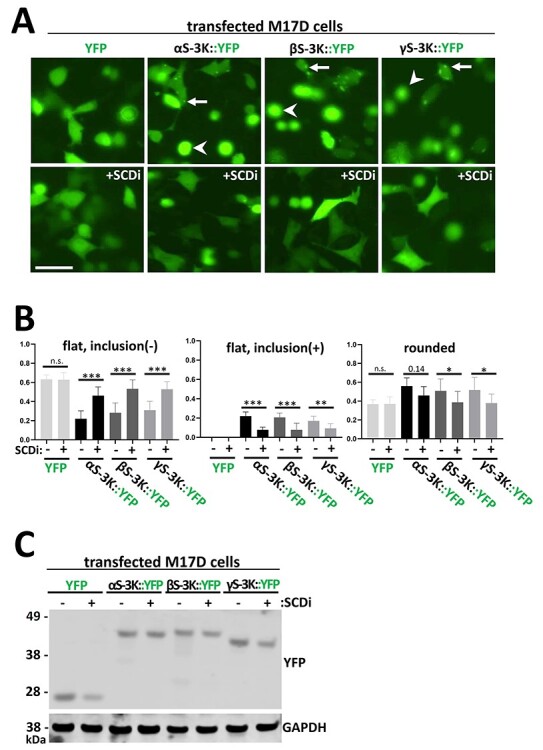
α-Synuclein (αS) has been well-documented to play a role in human synucleinopathies such as Parkinson's disease (PD) and dementia with Lewy bodies (DLB). First, the lesions found in PD/DLB brains-Lewy bodies and Lewy neurites-are rich in aggregated αS. Second, genetic evidence links missense mutations and increased αS expression to familial forms of PD/DLB. Third, toxicity and cellular stress can be caused by αS under certain experimental conditions. In contrast, the homologs β-synuclein (βS) and γ-synuclein (γS) are not typically found in Lewy bodies/neurites, have not been clearly linked to brain diseases and have been largely non-toxic in experimental settings. In αS, the so-called non-amyloid-β component of plaques (NAC) domain, constituting amino acids 61-95, has been identified to be critical for aggregation in vitro. This domain is partially absent in βS and only incompletely conserved in γS, which could explain why both homologs do not cause disease. However, αS in vitro aggregation and cellular toxicity have not been firmly linked experimentally, and it has been proposed that excess αS membrane binding is sufficient to induce neurotoxicity. Indeed, recent characterizations of Lewy bodies have highlighted the accumulation of lipids and membranous organelles, raising the possibility that βS and γS could also become neurotoxic if they were more prone to membrane/lipid binding. Here, we increased βS and γS membrane affinity by strategic point mutations and demonstrate that these proteins behave like membrane-associated monomers, are cytotoxic and form round cytoplasmic inclusions that can be prevented by inhibiting stearoyl-CoA desaturase.


Figures

Figure 1
Figure 1
(A) Schematic of aligned αS, βS and γS amino acid sequences. Bottom, amino acids were aligned from N-terminus to C-terminus and demarcated with the up to 10 repeat motifs. Amino acids highlighted in black are conserved with regard to the KTKEGV core repeat motif. Top, close-up of the region that is called ‘NAC domain’ for αS, with a special emphasis of amino acids 71–82 that had been reported to be essential for αS aggregation. βS is characterized by a deletion relative to αS and γS in this region, and we are displaying both an alignment with and without a gap. (B) Schematic of aligned αS, βS and γS aligned by repeat motif, color-coded. Analogous to (A) but color-coded: blue indicates basic (light blue: histidine); red: acidic, purple: polar uncharged and black: non-polar, green: proline residues.
Figure 2
Figure 2
Left, schematic of αS, βS and γS aligned by the first seven repeat motifs. αS, βS and γS are depicted as a series of seven repeats R1–R7, and amino acids are color-coded. Blue indicates basic (light blue: histidine); red: acidic, purple: polar uncharged and black: non-polar residues. Right, αS membrane-induced amphipathic helix (m-AH) formation (αS, βS and γS helical wheels embedded in membrane lipids). The formation of 3–11 helices (3 turns per 11 amino acids) at membranes is driven by hydrophobic non-polar amino acids in αS that interact with fatty acid tails of membrane lipids (large black curved lines) and by positively charged lysine (K) residues that interact with negatively charged lipid head groups of membrane lipids (large red circles). Arrows indicate amino acid substitutions relative to αS that are expected to lower membrane binding by either reducing electrostatic (yellow) or hydrophobic interactions (green).
Figure 3
Figure 3
(A) Schematic of wt and strategic missense mutations of αS, βS and γS. Sequences are aligned by their KTKEGV repeat motifs. Amino acids that fully conform to the KTKEGV repeat are highlighted in black. Amino acids in red are the strategic missense mutations that disrupt equilibria toward membrane-bound monomers. Amino acids in green are missense mutations that are expected to disrupt equilibria toward cytosolic monomers. (B) Schematic of predicted changes in equilibria. Among cytosolic monomer, cytosolic multimer and membrane-bound monomer for all synuclein species, 3K, KLK and EIV are expected to strongly reduce cytosolic species levels (K interacts with phospholipid head, L and I interact with lipid tails), whereas EGR is predicted to remain largely cytosolic (R repels αS from membrane lipid tails).
Figure 4
Figure 4
WB of sequential protein extraction and quantification. All human synuclein homologs, wt and the indicated variants were transiently transfected in M17D neuroblastoma cells. Cytosolic (PBS-soluble) and membrane proteins (TX-100-soluble) were separated by sequential extraction. Synucleins were detected using anti-FLAG (first and second WB rows, respectively). Controls for cytosolic and membrane fractions were GAPDH and Calnexin, respectively. WB is representative of N = 3 independent transfections on different days. Cytosol:membrane ratios were quantitated relative to αS wt, which was set to 1. We determined for each variant if cytosol:membrane ratios were significantly different versus the respective wt. Graph shows mean data for N = 3 independent experiments and standard errror of means (SEM). One-way analysis of variance (ANOVA) analysis, Tukey’s multiple comparisons test. *P < 0.05; **P < 0.01; ***P < 0.001; ns, non-significant.
Figure 5
Figure 5
WB and quantitation of αS60/80/100:αS14 ratios. Synuclein homologs and variants were transfected in M17D cells. Anti-FLAG WB after intact cell crosslinking (top). Blotting for DJ-1 served as a control (bottom). The ratios of Syn60/80/100 and Syn14 were normalized to αS wt and quantitated relative to each respective wt. Graph shows mean data for N = 3 independent experiments performed on different days in duplicates (n = 6) and SEM. One-way ANOVA analysis, Tukey’s multiple comparisons test. *P < 0.05; ***P < 0.01; ****P < 0.001; n.s., non-significant.
Figure 6
Figure 6
(A) Live-cell imaging of M17D cell confluence. M17D cells transfected with FLAG3-tagged wt, 3K, KLK, EIV or EGR variants for all human synuclein homologs. Staurosporine-treated (a strong toxin, positive control, set to 0 viability), non-transfected and vector-transfected cultures (both negative controls) are shown in the left column. Images were taken 48 h post-transfection by IncuCyte live-cell imaging. Cells were identified and their confluence quantified by using a custom IncuCyte algorithm that identifies areas occupied by cells (displayed in orange). Images are representative of N = 4 independent experiments performed in quadruplicates (n = 16). Graph shows mean data and standard deviation. All statistics relative to vector only (red). One-way ANOVA analysis, Tukey’s multiple comparisons test. *P < 0.05; **P < 0.01; ***P < 0.001. Scale bar, 50 µm. (B) Assessing neuron integrity upon transfection of YFP-tagged synuclein variants. YFP-tagged wt, 3K, KLK or EGR variants for all human synuclein homologs were transfected into DIV14 rat cortical neurons. Transfection efficiency <5% allowed for assessing integrity of single transfected neurons 96 h post-transfection. After image acquisition and blinding, cells were categorized into ‘intact’ and ‘disintegrated’ and the relative percentage of intact neurons was calculated (N = 3 independent experiments, n = 2 transfected wells per experiment and variant, 36 fields per well). Graph shows mean data and standard deviation. All statistics relative to the respective wt variant. One-way ANOVA analyses, Tukey’s multiple comparisons test. *P < 0.05; **P < 0.01; ****P < 0.0001. Scale bar, 50 µm.
Figure 7
Figure 7
Fluorescence microscopy images of cells transfected with wt and variants of synuclein homologs. (A) M17D cells were transfected with YFP-tagged wt, 3K and KLK variants for all homologs. YFP was also transfected as a control. Images were taken 48 h post-transfection. Scale bar, 25 µm. (B) DIV 13 primary mouse neurons were co-transfected with YFP-tagged variants for all homologs and RFP as a control. Images were taken 48 h post-transfection. Scale bar, 20 µm. (C) DIV 14 rat neurons were transfected with YFP-tagged variants for all homologs. Images were taken 48 h post-transfection. All images are representative of N = 3 independent experiments done on different days. Scale bar, 20 µm.
Figure 8
Figure 8
Pretreating M17D cells with SCD inhibitor rescues cellular inclusion formation and toxicity. (A) IncuCyte live-cell images of M17D cells transfected with either YFP alone, YFP-tagged αS-3K, βS-3K or γS-3K after 48 h. Another set of M17D transfectants was pretreated with SCD inhibitor (SCDi) MF-438 (10 μM) and was also imaged. Arrows point at inclusions, arrowheads point at rounded cells. Scale bar, 20 µm. (B) Quantification of the number of cells without inclusions (left graph), with inclusions (middle graph) and rounded (right graph) 48 h post-transfection and with/without 24 h pretreatment of SCD inhibitor (y-axis: fraction). Graph shows mean data for N = 3 independent experiments (n = 8 each) and SEM. One-way ANOVA analysis (comparisons as indicated), Tukey’s multiple comparisons test. *P < 0.05; **P < 0.01; ***P < 0.001; n.s., non-significant. (C) WB of M17D cells transfected with either YFP alone, YFP-tagged αS-3K, βS-3K or γS-3K with/without pretreatment of SCD inhibitor. WB represents three independent experiments.

References

    1. Spillantini, M.G., Schmidt, M.L., Lee, V.M., Trojanowski, J.Q., Jakes, R. and Goedert, M. (1997) Alpha-synuclein in Lewy bodies. Nature, 388, 839–840. - PubMed
    1. Lavedan, C., Buchholtz, S., Auburger, G., Albin, R.L., Athanassiadou, A., Blancato, J., Burguera, J.A., Ferrell, R.E., Kostic, V., Leroy, E. et al. (1998) Absence of mutation in the beta- and gamma-synuclein genes in familial autosomal dominant Parkinson’s disease. DNA Res. Int. J. Rapid Publ. Rep. Genes Genomes, 5, 401–402. - PubMed
    1. Lincoln, S., Crook, R., Chartier-Harlin, M.C., Gwinn-Hardy, K., Baker, M., Mouroux, V., Richard, F., Becquet, E., Amouyel, P., Destée, A., Hardy, J., Farrera, M. (1999) No pathogenic mutations in the beta-synuclein gene in Parkinson’s disease. Neurosci. Lett., 269, 107–109. - PubMed
    1. Baba, M., Nakajo, S., Tu, P.H., Tomita, T., Nakaya, K., Lee, V.M., Trojanowski, J.Q. and Iwatsubo, T. (1998) Aggregation of alpha-synuclein in Lewy bodies of sporadic Parkinson’s disease and dementia with Lewy bodies. Am. J. Pathol., 152, 879–884. - PMC - PubMed
    1. Galvin, J.E., Giasson, B., Hurtig, H.I., Lee, V.M. and Trojanowski, J.Q. (2000) Neurodegeneration with brain iron accumulation, type 1 is characterized by alpha-, beta-, and gamma-synuclein neuropathology. Am. J. Pathol., 157, 361–368. - PMC - PubMed

Publication types

MeSH terms