Review
. 2022 Apr 1;102(2):653-688.
doi: 10.1152/physrev.00042.2020. Epub 2021 Jul 13.

Microcircuits for spatial coding in the medial entorhinal cortex

Affiliations
Review

Microcircuits for spatial coding in the medial entorhinal cortex

John J Tukker et al. Physiol Rev. .

Abstract

The hippocampal formation is critically involved in learning and memory and contains a large proportion of neurons encoding aspects of the organism's spatial surroundings. In the medial entorhinal cortex (MEC), this includes grid cells with their distinctive hexagonal firing fields as well as a host of other functionally defined cell types including head direction cells, speed cells, border cells, and object-vector cells. Such spatial coding emerges from the processing of external inputs by local microcircuits. However, it remains unclear exactly how local microcircuits and their dynamics within the MEC contribute to spatial discharge patterns. In this review we focus on recent investigations of intrinsic MEC connectivity, which have started to describe and quantify both excitatory and inhibitory wiring in the superficial layers of the MEC. Although the picture is far from complete, it appears that these layers contain robust recurrent connectivity that could sustain the attractor dynamics posited to underlie grid pattern formation. These findings pave the way to a deeper understanding of the mechanisms underlying spatial navigation and memory.

Keywords: connectivity; entorhinal cortex; grid cells; microcircuits; navigation.


Conflict of interest statement

No conflicts of interest, financial or otherwise, are declared by the authors.

Figures

None
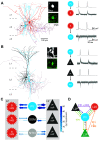
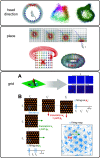
Graphical abstract
FIGURE 1.
FIGURE 1.
Medial entorhinal cortex (MEC) anatomy and extrinsic connections. A: mouse head (top left) showing the location of the MEC (green) at the posterior edge of the cortex and a sagittal view of the rat brain (bottom left) showing the MEC and main connected structures including the lateral entorhinal cortex (LEC, gray), hippocampus (yellow), and presubiculum (PrS) and parasubiculum (PaS) (both blue). Dashed line depicts the horizontal plane for the brain section on right, which also shows layer (L)2, L3, and L5 in the MEC. DG, dentate gyrus; Sub, subiculum. B: main inputs to and outputs from principal cells in the MEC, including stellate (S, red) and pyramidal (P, gray) cells in L2 and pyramidal cells in L3 (green) and L5 (gray). Arrows depict main known excitatory connections. Note the strong output from stellate cells in L2 and pyramidal cells in L3 to the hippocampus (yellow), which provides the main input to L5 pyramidal cells. Inputs to the superficial MEC are mostly from the PrS and PaS. cMEC, contralateral MEC; MS, medial septum; further colors and abbreviations as in A. Data summarized are from Refs. , , –, , –87). Bottom left and right images in A adapted from Moser et al. (53) with permission from Nature Reviews Neuroscience.
FIGURE 2.
FIGURE 2.
Spatial-coding cells in the superficial medial entorhinal cortex (MEC). A: the firing map of a grid cell (left; gray lines, rat trajectory; black dots, location at which recorded cell fired a spike). The grid pattern can be more clearly seen in the rate map (center; in this panel and all subsequent similar panels, blue colors represent low firing rates, red high). In the three main layers [layers 2 (L2), 3 (L3), 5 (L5)] of MEC containing principal cells, a large percentage of all recorded neurons consists of grid cells (right). B: extracellular recordings are performed with tetrodes in the MEC (green) as a rat explores a circumscribed area (blue square). Spike times (Spikes) for single isolated units are isolated from the recorded voltage traces (Voltage), which can also be filtered to identify theta oscillations of the local field potential (LFP-theta). Video tracking of the rat’s trajectory (gray curve) is combined with the recorded spike times (black dots) to form a firing map (as in A). C: the population of grid cells in MEC forms modules displaying discrete values of grid spacing (left) and orientation (right). Leftmost graph shows grid spacing of single grid cells (black dots) with 3 example firing maps on the left and the probability density plotted on the right (black). Note that the modules have a dorsoventral organization, with only 1 module being recorded dorsally in this example and 4 ventrally. Rightmost graph shows probability density (bottom) of grid orientation for another example recording, with firing maps from 3 example grid cells (top) showing the different orientations with the highest probability (red dashed lines). D: head direction cell (HD) with firing rate shown in a polar plot as a function of the rat’s head direction (left; maximum rate 6 Hz), recorded while the rat oriented its head in all directions over the course of a session (center). Percentage of recorded cells with HD tuning (right) was smallest in L2. E: firing rate of 4 example speed cells as a function of the animal’s speed (left) shows both linear and saturating tuning curves. The correlation between speed and firing rate (right) is low for most spatially modulated cells (HD, grid, border), suggesting that speed cells (speed) are mostly a separate class of cells. F: border cell rate map shows preferential firing at 1 border of the arena (left) and additional firing when an extra wall is introduced (right; added border) parallel to the preferred border. G: object-vector (OV) cell with very low firing rate in absence of an object (left) fires at a specific distance and angle from an introduced object (center and right), independent of the precise location of the object. H: conjunctive grid-by-head direction (grid × HD) cell rate map (left), firing rate as a function of HD (center), and percentages of cells in layers of MEC (right). I: percentages of all recorded cells in L2, L3, and L5 classified as grid (G), head direction (HD), speed (S), border (B), or conjunctive cells (HD + G, HD + S, HD + B). Note that about half of all cells could not be classified (light gray slice in pie charts); for clarity, only percentages >5% are labeled. OV cells are not included but would account for an additional 15% in superficial layers; their presence in deep layers is not known. J: functional cell types cluster in terms of HD and spatial information. Note also presence of conjunctive cells. A, left and center, adapted from Hafting et al. (93) with permission from Nature. A, D, and H, right, adapted from Boccara et al. (155) with permission from Nature Neuroscience. Traces in B adapted from Hafting et al. (185) with permission from Nature. The brain in B and all panels in C are adapted from Stensola et al. (136) with permission from Nature. D and H, left and center, adapted from Sargolini et al. (153) with permission from Science. E, I, and J adapted from Kropff et al. (135) with permission from Nature. F reprinted from Solstad et al. (186) with permission from Science. G reprinted with permission from Høydal et al. (187) with permission from Nature.
FIGURE 3.
FIGURE 3.
Anatomically, electrophysiologically, and molecularly defined cell types within superficial layers of the medial entorhinal cortex (MEC). A: reconstructed somata and dendrites (top) and voltage traces (bottom; overlaid responses to current injection steps) for the main excitatory cell types: L2S, layer 2 (L2) stellate cell; L2P, L2 pyramidal cell; L3P, layer 3 (L3) pyramidal cell. Note the presence of a sag potential at hyperpolarized voltages for the L2S cell. B: schematic representation of axonal projections for 4 interneuron classes in the superficial MEC, classified via clustering based on intrinsic electrophysiological and axonal projection data from glutamate decarboxylase 2 (GAD2)+ neurons. Note that apart from the fast-firing group (2nd panel), cell classes identified in this study only partially coincide with common genetic markers (shown below each panel). CCK, cholecystokinin; CR, calretinin; PV, parvalbumin; SOM, somatostatin; 5HT3aR, serotonin receptor type 3a. C: hierarchical clustering based on 9 electrophysiological parameters suggests that 8 cell types based on anatomical and genetic criteria (listed top right) can be grouped (groups shown with arrows at bottom; based on a cutoff linkage distance shown as a dashed line) into 2 principal cell types (P for L2P and L3P, S for L2S) and 5 interneuron types, which we named PV, SOM1, SOM2, 5HT3a-1, and 5HT3a-2. Linkage distance is a measure of similarity between cells, which are shown as colored numbers at bottom (cells linked at a smaller linkage distance are more similar). Note that the groups only partially coincide with the anatomical/genetic types [listed at top, number of recorded cells in parentheses; RCan2, cells in a regulator of calcineurin 2 mouse line used here to identify PV+ fast-spiking (FS) interneurons; SOM, subpopulation of SOM+ cells from GIN mouse line; NPY-NGF, cells anatomically identified as neurogliaform (NGF) cells in a neuropeptide Y mouse line; NPY Non-NGF, cells anatomically identified as non-NGF cells in a neuropeptide Y mouse line; VIP, cells in vasointestinal protein mouse line; P, pyramidal cells; L2S were identified by soma size and shape]. B adapted from Martínez et al. (232) with permission from eNeuro. C adapted from Ferrante et al. (233) with permission from Cerebral Cortex.
FIGURE 4.
FIGURE 4.
Superficial medial entorhinal cortex (MEC) excitatory microcircuits. A: example of 8 simultaneously recorded cells, showing a connection between a presynaptic layer 2 pyramidal (L2P) cell expressing the L2P marker calbindin (inset, P) and a postsynaptic layer 2 stellate (L2S) cell expressing reelin (inset, S). Columns depict responses of all possible postsynaptic cells to stimulation of 1 cell (stimulation shown along the diagonal). Only 1 cell (the L2S cell in row 1) showed a response in this case (red trace on top, magnification). B: example of 6 simultaneously recorded cells, showing a connection between a presynaptic layer 3 pyramidal (L3P) cell and a postsynaptic L2S cell. C: hierarchical classification of principal cells in layer 2; for the 2 main classes, characteristic voltage traces in response to current injection are shown at bottom. D: summary of excitatory microcircuits. Blue arrows depict connectivity as % of postsynaptic cells showing a response to induced presynaptic spikes. Percentages are from Winterer et al. (52). *Earlier studies reported 0% based on a smaller sample (47) or a different definition of L2P cells (50). †Earlier studies reported 0% (47, 48, 50). ‡An earlier study reported 9% between L3Ps (44). See also TABLE 1. A and B adapted from Winterer et al. (52) with permission from Cell Reports. C adapted from Grosser et al. (292) with permission from eNeuro.
FIGURE 5.
FIGURE 5.
Superficial medial entorhinal cortex (MEC) inhibitory microcircuits. A: example paired recording from a layer 2 stellate (L2S) cell (red) and a fast-spiking basket cell (blue soma and dendrites, purple axon) expressing parvalbumin (inset, PV). Traces on right show that stimulation of the PV cell (row 1) induced a hyperpolarizing current in the L2S cell (row 2) and L2S cell stimulation (row 3) induced a depolarizing current in the PV cell (row 4). B: example paired recording from a layer 2 pyramidal (L2P) cell (gray) and a PV cell (same colors as above). Note again connectivity in both directions. Scales as in A. C: summary of inhibitory microcircuits for layer 2 principal cells. Blue arrows depict connectivity as % of postsynaptic cells showing a response to induced presynaptic spikes. Dashed lines represent 0% connectivity. PV cell connectivity with L2S and L2P cells is from Grosser et al. (292). All other data are from Fuchs et al. (50), who defined two additional types of layer 2 principal cells (intP, intermediate pyramidal cells; intS, intermediate stellate cells) and recorded from all 3 main classes of interneurons (SOM, somatostatin-expressing interneurons; 5HT3, serotonin receptor type 3a-expressing interneurons). Note that because of the difference in classification of layer 2 principal cells, it is not possible to directly compare the results from these 2 studies. D: motifs involving PV interneurons. Three motifs with feedforward inhibition (FFI) are apparent: 1) from L2P to L2S, accompanied by feedforward excitation (FFI + FFE; purple); 2) from L2P to layer 3 pyramidal cell (L3P), not accompanied by excitation in either direction (FFI; light green); 3) from L2S to L3P, accompanied by feedback excitation (FFI + FBE; orange). In addition, 2 feedback inhibitory motifs can be discerned: 1 among L2S cells and 1 among L2P cells (both dark green); note that these feedback inhibitory motifs are both accompanied by sparser (1.7–6%) feedback excitation among the principal cells (FIGURE 4). Further motifs are likely to emerge, for instance if L3P cells provide input to PV interneurons, which has not been demonstrated directly (‘?’). A and B adapted from Grosser et al. (292) with permission from eNeuro.
FIGURE 6.
FIGURE 6.
Superficial–deep microcircuits. A: example experiment showing glutamate uncaging in deep layers [left; dots indicate stimulation sites in medial entorhinal cortex (MEC) slices, symbols indicate intracellularly recorded cell in layer 2 (L2)] eliciting smaller average (avg) responses in a L2 stellate (L2S) cell (top, red) compared to a L2 pyramidal (L2P) cell (bottom, black). Population data (right) showing that L2P cells receive a greater percentage of input from deep cells than L2S cells. B: based on GFP-tagged synaptophysin, boutons from L2S cells (in Sim1-Cre mice) and L2P cells (in Wfs1-Cre mice) were detected, with a high density in most deep MEC layers for L2S cells (left) but virtually no synaptic boutons in these layers for L2P cells (right). C: example responses (left) from 4 cells recorded in different layers of the MEC to optogenetic stimulation (blue bar) of L2S cells (in Sim1-Cre mice). Note that only the L5b cell showed a membrane potential response. Morphologies and responses to current injection are also shown for all 4 example cells. Population data for all cells recorded in different layers are summarized on right, with L2 data coming from L2P cells only. Note that the height of the bars is proportional to the numbers of cells recorded. D: summary of the excitatory connectivity between deep layer and superficial layer principal cells. Note that we only indicate qualitative differences in the connections here and leave out connectivity within layers and amongst superficial layers (see FIGURE 4). A adapted from Beed et al. (45) with permission from Neuron. B and C adapted from Sürmeli et al. (49) with permission from Neuron.
FIGURE A1.
FIGURE A1.
Continuous-attractor network (CAN) models of head direction (HD), place, and grid cell function. Head direction: A classic ring attractor network (left) in which neurons (circles) are connected (red, gray) such that only 1 bump of activity is active at a time (represented by warmer colors of circles), encoding the animal’s head direction. Note that additional mechanisms that are required to shift the activity appropriately when the head moves are not shown here. Activity of HD cells in the brain was recently shown (–180) to indeed have a ring structure (center; colors represent different preferred head directions). This structure is very similar (right) during REM sleep (green) and awake (black) states (179). Place: A bump of activity in a 2-dimensional (2-D) sheet of hippocampal place cells can follow the animal’s position in space (top). To avoid discontinuity at the edge of the sheet, cells can be connected (bottom left; red arrows depict connections for 2 example cells) such that the CAN forms a torus (bottom right) (71). Grid: A: a specific connectivity profile (top left, in this case a combination of local excitation and surround inhibition) for neurons arranged on a 2-D sheet can lead to the emergence of a gridlike pattern of activity bumps (top right). Note that the connectivity profile shown is merely 1 example; different combinations of local and global excitation and inhibition can lead to a similar pattern. B: because the different states represented by the sheet are all connected on a 2-D manifold, the sheet can be easily shifted around from 1 state to another. Translation v follows the velocity of the animal’s locomotion, shown here for 2 example paths (p1, p2), each at 3 consecutive time points (t1, t2, t3 and t1′, t2′, t3′, respectively). The effect of these translations on neuronal firing is illustrated for 1 example neuron ni, both in the temporal (blue traces, top right and bottom left) and spatial (bottom right) domain. Note that in this example v1 is larger than v2, leading to a longer path for p1 than p2 (dashed arrows) in a shorter time (t1t3 are closer together than t1′–t3′). In reality, the animal’s movement will contain a wide range of directions and speeds, but as long as the translations of the activity sheet closely mirror these, the pattern of firing for any single neuron will remain stable. Head direction left panel, all Place panels, and Grid panel a from McNaughton et al. (71) with permission from Nature Reviews Neuroscience. Head direction center panel from Rybakken et al. (180) with permission from Neural Computation. Head direction right panel from Chaudhuri et al. (179) with permission from Nature Neuroscience. Grid panel B inspired by Couey et al. (47) and Bonnevie et al. (148).

References

    1. Doeller CF, Barry C, Burgess N. Evidence for grid cells in a human memory network. Nature 463: 657–661, 2010. doi: 10.1038/nature08704. - DOI - PMC - PubMed
    1. Chadwick MJ, Jolly AE, Amos DP, Hassabis D, Spiers HJ. A goal direction signal in the human entorhinal/subicular region. Curr Biol 25: 87–92, 2015. doi: 10.1016/j.cub.2014.11.001. - DOI - PMC - PubMed
    1. Shine JP, Valdés-Herrera JP, Tempelmann C, Wolbers T. Evidence for allocentric boundary and goal direction information in the human entorhinal cortex and subiculum. Nat Commun 10: 4004, 2019. doi: 10.1038/s41467-019-11802-9. - DOI - PMC - PubMed
    1. Jacobs J, Kahana MJ, Ekstrom AD, Mollison MV, Fried I. A sense of direction in human entorhinal cortex. Proc Natl Acad Sci USA 107: 6487–6492, 2010. doi: 10.1073/pnas.0911213107. - DOI - PMC - PubMed
    1. Nau M, Navarro Schröder T, Frey M, Doeller CF. Behavior-dependent directional tuning in the human visual-navigation network. Nat Commun 11: 3247, 2020. doi: 10.1038/s41467-020-17000-2. - DOI - PMC - PubMed

Publication types

LinkOut - more resources