Meta-Analysis
. 2021 Jul 13;326(2):154-164.
doi: 10.1001/jama.2021.7374.

Use of Medications for Treatment of Opioid Use Disorder Among US Medicaid Enrollees in 11 States, 2014-2018

Collaborators, Affiliations
Meta-Analysis

Use of Medications for Treatment of Opioid Use Disorder Among US Medicaid Enrollees in 11 States, 2014-2018

Medicaid Outcomes Distributed Research Network (MODRN) et al. JAMA. .

Abstract

Importance: There is limited information about trends in the treatment of opioid use disorder (OUD) among Medicaid enrollees.

Objective: To examine the use of medications for OUD and potential indicators of quality of care in multiple states.

Design, setting, and participants: Exploratory serial cross-sectional study of 1 024 301 Medicaid enrollees in 11 states aged 12 through 64 years (not eligible for Medicare) with International Classification of Diseases, Ninth Revision (ICD-9 or ICD-10) codes for OUD from 2014 through 2018. Each state used generalized estimating equations to estimate associations between enrollee characteristics and outcome measure prevalence, subsequently pooled to generate global estimates using random effects meta-analyses.

Exposures: Calendar year, demographic characteristics, eligibility groups, and comorbidities.

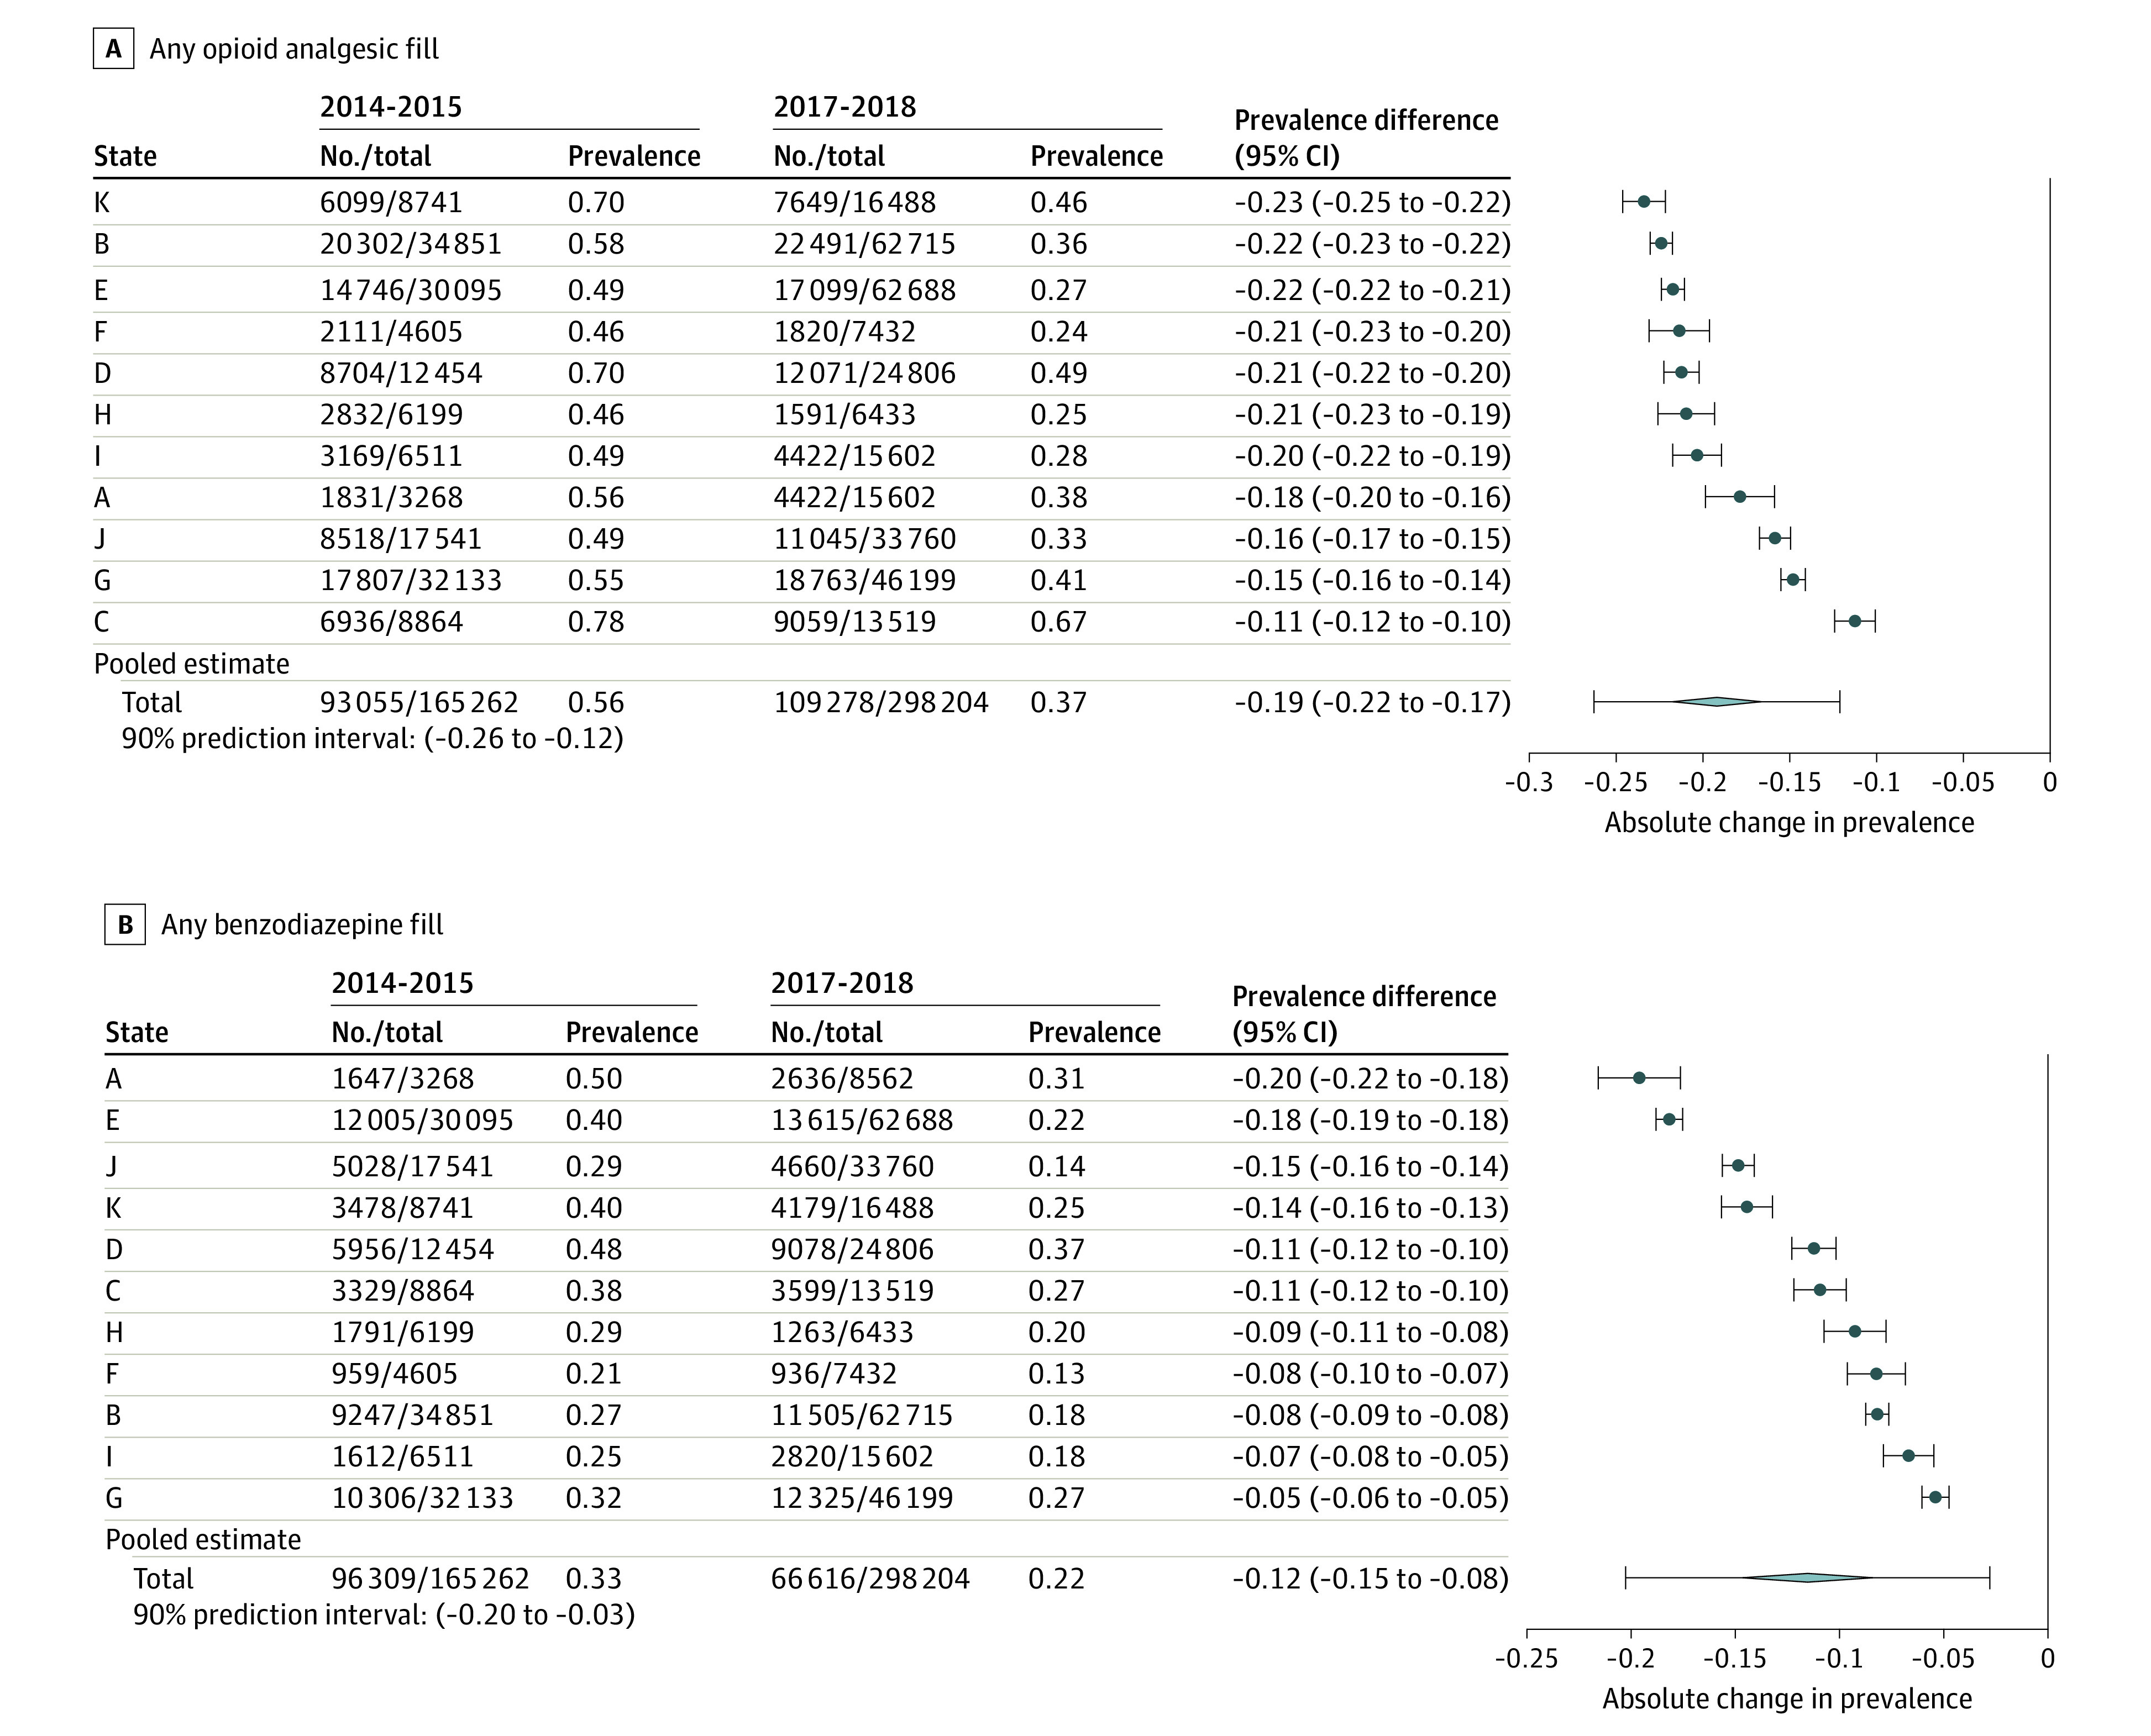
Main outcomes and measures: Use of medications for OUD (buprenorphine, methadone, or naltrexone); potential indicators of good quality (OUD medication continuity for 180 days, behavioral health counseling, urine drug tests); potential indicators of poor quality (prescribing of opioid analgesics and benzodiazepines).

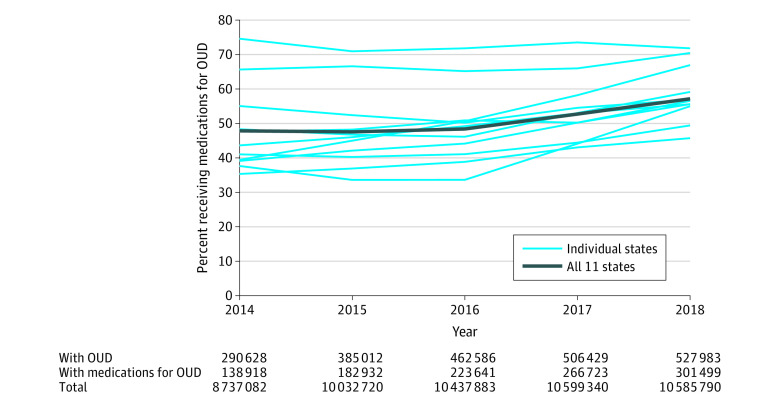
Results: In 2018, 41.7% of Medicaid enrollees with OUD were aged 21 through 34 years, 51.2% were female, 76.1% were non-Hispanic White, 50.7% were eligible through Medicaid expansion, and 50.6% had other substance use disorders. Prevalence of OUD increased in these 11 states from 3.3% (290 628 of 8 737 082) in 2014 to 5.0% (527 983 of 10 585 790) in 2018. The pooled prevalence of enrollees with OUD receiving medication treatment increased from 47.8% in 2014 (range across states, 35.3% to 74.5%) to 57.1% in 2018 (range, 45.7% to 71.7%). The overall prevalence of enrollees receiving 180 days of continuous medications for OUD did not significantly change from the 2014-2015 to 2017-2018 periods (-0.01 prevalence difference, 95% CI, -0.03 to 0.02) with state variability in trend (90% prediction interval, -0.08 to 0.06). Non-Hispanic Black enrollees had lower OUD medication use than White enrollees (prevalence ratio [PR], 0.72; 95% CI, 0.64 to 0.81; P < .001; 90% prediction interval, 0.52 to 1.00). Pregnant women had higher use of OUD medications (PR, 1.18; 95% CI, 1.11-1.25; P < .001; 90% prediction interval, 1.01-1.38) and medication continuity (PR, 1.14; 95% CI, 1.10-1.17, P < .001; 90% prediction interval, 1.06-1.22) than did other eligibility groups.

Conclusions and relevance: Among US Medicaid enrollees in 11 states, the prevalence of medication use for treatment of opioid use disorder increased from 2014 through 2018. The pattern in other states requires further research.


Conflict of interest statement

Conflict of Interest Disclosures: Dr Ahrens reported receiving support from the Maine Department of Health cooperative agreement. Dr Chang reported receiving grants from National Institutes of Health (NIH). Dr Cunningham reported receiving support from the Virginia Department of Medical Assistance contract to evaluate Addiction and Recovery Treatment Services program. Dr Mauk reported receiving grants from the NIH and support from the Ohio Department of Medicaid. Ms McDuffie reported receiving grants from the Delaware Division of Medicaid and Medical Assistance. Dr Gordon reported receiving institutional support from grants CIN 13-414 from the Department of Veterans Affairs' Informatics, Decision-Enhancement, and Analytic Sciences (IDEAS) Center of Innovation, and 1UG1DA049444-01 from the National Institute on Drug Abuse; serving on the board of directors (not compensated) for the American Society of Addiction Medicine (ASAM), the Association for Multidisciplinary Education and Research in Substance Use and Addiction (AMERSA), and the International Society of Addiction Journal Editors (ISAJE); and receiving royalties from the medical online reference, UpToDate. No other disclosures were reported.

Figures

Figure 1.
Figure 1.. Unadjusted Percent of Enrollees Diagnosed With Opioid Use Disorder (OUD) Who Received Any Medications for OUD, 2014-2018
States included are Delaware, Kentucky, Maine, Maryland, Michigan, North Carolina, Ohio, Pennsylvania, Virginia, West Virginia, and Wisconsin. Medications for OUD are defined as using pharmacy and medical claims for US Food and Drug Administration–approved medications for OUD including buprenorphine, methadone, and naltrexone. The denominator includes full-benefit Medicaid enrollees aged 12 through 64 years diagnosed with OUD in the calendar year. Unadjusted state-level trends in medications for OUD shown separately. Combined prevalence of medications for OUD were obtained by summing the numerators and denominators across 11 states.
Figure 2.
Figure 2.. Unadjusted Changes in Potential Indicators of Good Quality of Care for Enrollees Receiving Medications for Opioid Use Disorder (OUD), 2014-2015 to 2017-2018
See figure 1 for included states. Denominators for all measures include enrollees diagnosed with OUD who initiated medications for OUD (with buprenorphine, methadone, or naltrexone) who had at least 6 months of continuous enrollment in Medicaid after their index claim for medications for OUD. Two-year timeframes shown for all measures. State-level prevalence (data points) and prevalence differences are displayed (error bars). Random effects meta-analyses were used to estimate global prevalence differences for each measure across the 11 states, along with 95% CIs (diamond) and 90% prediction intervals (error bars). Prediction intervals denote the range within which prevalence differences would fall for 90% of US states were a different set of states to be drawn. Prediction intervals estimate the between-state variability of the true prevalence differences of state populations.
Figure 3.
Figure 3.. Unadjusted Changes in Potential Indicators of Poor Quality of Care for Enrollees Receiving Medications for Opioid Use Disorder (OUD), 2014-2015 to 2017-2018
See Figure 1 for included states. Denominators for all measures include enrollees diagnosed with OUD who initiated medications for OUD (with buprenorphine, methadone, or naltrexone) who had at least 6 months of continuous enrollment in Medicaid after their index claim for medications for OUD. Two-year timeframes shown for all measures. State-level prevalence (data points) and prevalence differences (error bars) are displayed. Random effects meta-analyses were used to estimate global prevalence differences for each measure across the 11 states, along with 95% CIs (diamond) and 90% prediction intervals (error bars). Prediction intervals denote the range within which prevalence differences would fall for 90% of US states were a different set of states to be drawn. Prediction intervals estimate the between-state variability of the true prevalence differences of state populations.
Figure 4.
Figure 4.. Random Effects Meta-analysis Estimates for Receiving Any Medications for OUD Adjusted for Enrollee Characteristics
See Figure 1 legend for included states. Numbers correspond to person-year observations in each subgroup. Adjusted prevalence ratios (log scale) were estimated from random effects meta-analysis. Data points and error bars represent the global prevalence ratios and 95% CIs of the global prevalence ratios across states. The lightly shaded bars represent 90% prediction intervals, which denote the range within which prevalence ratios would fall for 90% of states were a different set of states to be drawn. The prediction intervals estimate the between-state variability of the true prevalence ratios of the state populations. aOther includes Native Hawaiian, Pacific Islander, American Indian, Alaska Native, and Asian. bExpansion adults are enrollees newly eligible under the Affordable Care Act in a Medicaid expansion adopted in 2014 and 2015.
Figure 5.
Figure 5.. Random Effects Meta-analysis Estimates for Continuity of Medications for OUD for 180 Days Adjusted for Enrollee Characteristics
See Figure 1 legend for the included states. Numbers correspond to person-period observations, where a period can be up to 2 years long, in each subgroup. Adjusted prevalence ratios (log scale) were estimated from random effects meta-analysis. Data markers and error bars represent the global prevalence ratios and 95% CIs of the global prevalence ratios across states. The lightly shaded bars correspond to the 90% prediction intervals that denote the range within which prevalence ratios would fall for 90% of states were a different set of states to be drawn. The prediction intervals estimate the between-state variability of the true prevalence ratios of the state populations. aOther includes Native Hawaiian, Pacific Islander, American Indian, Alaska Native, and Asian. bExpansion adults are enrollees newly eligible under the Affordable Care Act in a Medicaid expansion adopted in 2014 and 2015.

References

    1. Larochelle MR, Bernson D, Land T, et al. . Medication for opioid use disorder after nonfatal opioid overdose and association with mortality: a cohort study. Ann Intern Med. 2018;169(3):137-145. doi:10.7326/M17-3107 - DOI - PMC - PubMed
    1. Kaiser Family Foundation . Medicaid’s role in addressing the opioid epidemic. Published 2018. Accessed May 14, 2018. https://www.kff.org/infographic/medicaids-role-in-addressing-opioid-epid...
    1. McCarty D, Gu Y, McIlveen JW, Lind BK. Medicaid expansion and treatment for opioid use disorders in Oregon: an interrupted time-series analysis. Addict Sci Clin Pract. 2019;14(1):31. doi:10.1186/s13722-019-0160-6 - DOI - PMC - PubMed
    1. Report to Congress: utilization management of medication-assisted treatment in Medicaid. Medicaid and CHIP Payment and Access Commission. October 2019. Accessed June 13, 2021. https://www.macpac.gov/publication/report-to-congress-utilization-manage...
    1. Barnes AJ, Cunningham PJ, Saxe-Walker L, et al. . Hospital use declines after implementation of Virginia Medicaid’s addiction and recovery treatment services. Health Aff (Millwood). 2020;39(2):238-246. doi:10.1377/hlthaff.2019.00525 - DOI - PubMed

Publication types

MeSH terms