. 2021 Aug 3;13(8):evab166.
doi: 10.1093/gbe/evab166.

The Evolutionary Origins of Extreme Halophilic Archaeal Lineages

Affiliations

The Evolutionary Origins of Extreme Halophilic Archaeal Lineages

Yutian Feng et al. Genome Biol Evol. .

Abstract

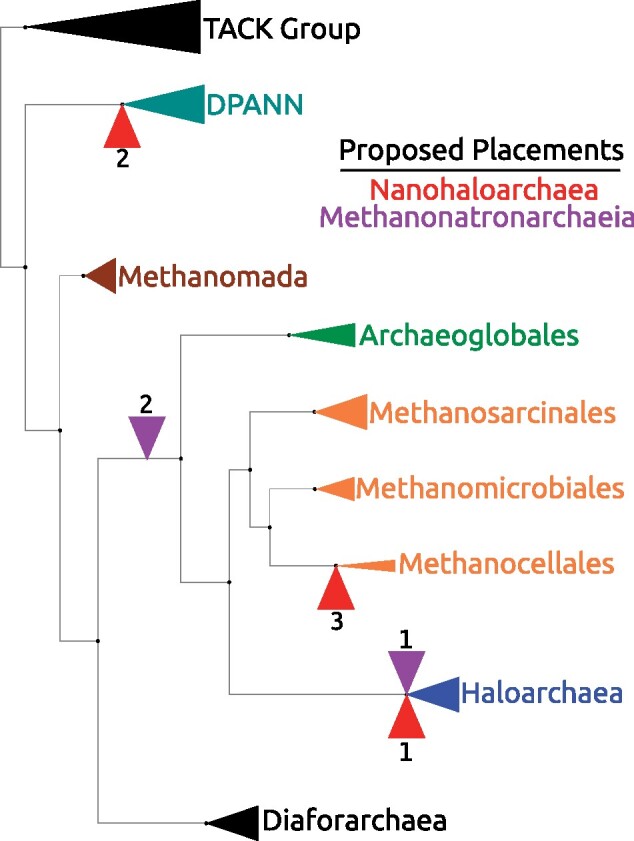
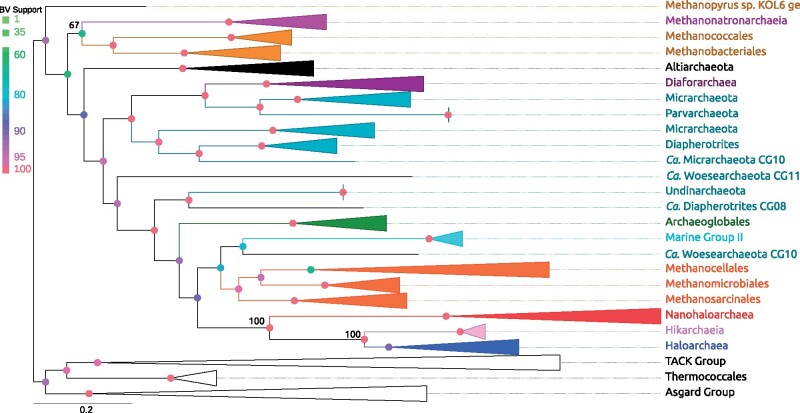
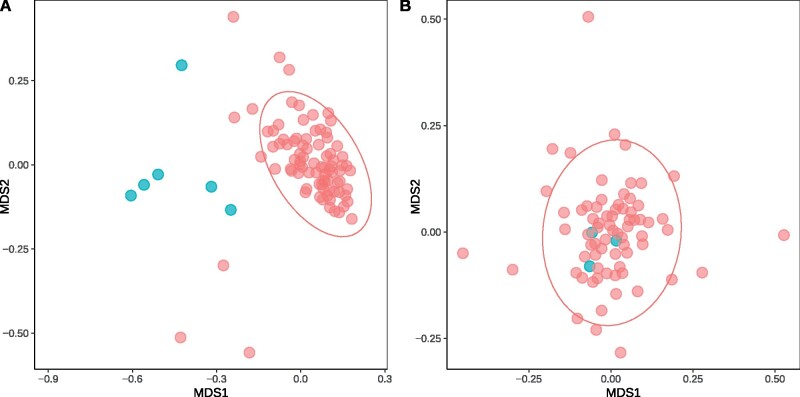
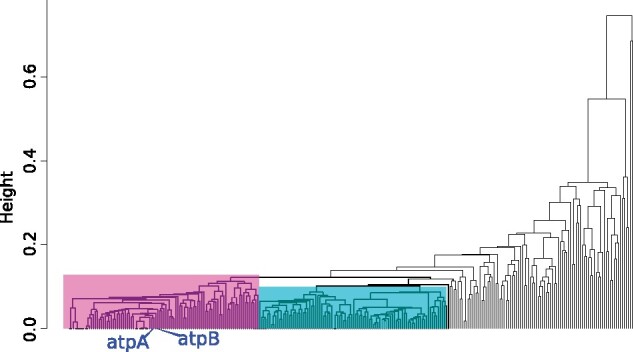
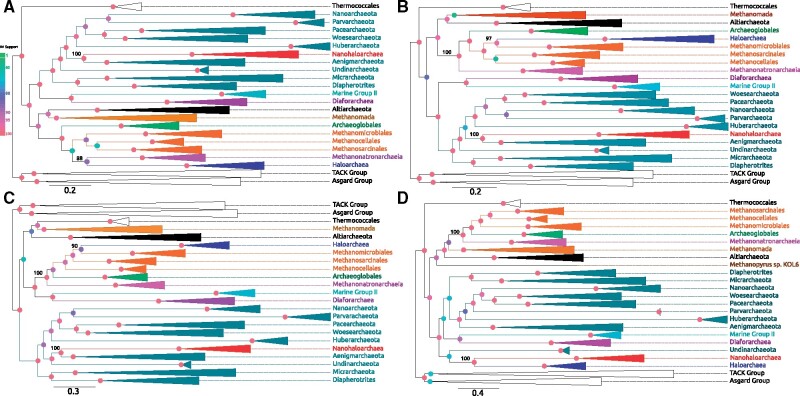
Interest and controversy surrounding the evolutionary origins of extremely halophilic Archaea has increased in recent years, due to the discovery and characterization of the Nanohaloarchaea and the Methanonatronarchaeia. Initial attempts in explaining the evolutionary placement of the two new lineages in relation to the classical Halobacteria (also referred to as Haloarchaea) resulted in hypotheses that imply the new groups share a common ancestor with the Haloarchaea. However, more recent analyses have led to a shift: the Nanohaloarchaea have been largely accepted as being a member of the DPANN superphylum, outside of the euryarchaeota; whereas the Methanonatronarchaeia have been placed near the base of the Methanotecta (composed of the class II methanogens, the Halobacteriales, and Archaeoglobales). These opposing hypotheses have far-reaching implications on the concepts of convergent evolution (distantly related groups evolve similar strategies for survival), genome reduction, and gene transfer. In this work, we attempt to resolve these conflicts with phylogenetic and phylogenomic data. We provide a robust taxonomic sampling of Archaeal genomes that spans the Asgardarchaea, TACK Group, euryarchaeota, and the DPANN superphylum. In addition, we assembled draft genomes from seven new representatives of the Nanohaloarchaea from distinct geographic locations. Phylogenies derived from these data imply that the highly conserved ATP synthase catalytic/noncatalytic subunits of Nanohaloarchaea share a sisterhood relationship with the Haloarchaea. We also employ a novel gene family distance clustering strategy which shows this sisterhood relationship is not likely the result of a recent gene transfer. In addition, we present and evaluate data that argue for and against the monophyly of the DPANN superphylum, in particular, the inclusion of the Nanohaloarchaea in DPANN.

Keywords: Methanonatronarchaeia; Nanohaloarchaea; gene concordance; metagenomic-assembled genome (MAG); single amplified genome (SAG).


Figures

Fig. 1.
Fig. 1.
Summary of proposed placements of halophilic lineages mapped on an Archaeal reference tree. This reference tree mostly depicts the positions of various euryarchaea. Individual taxa have been collapsed into higher taxonomic groups. The red (R) indicators represent the different placements proposed for the Nanohaloarchaea, whereas the purple (P) indicators are used for the Methanonatronarchaeia. Sources for each placement: R1 (Narasingarao et al. 2012), R2 (Andrade et al. 2015), R3 (Aouad et al. 2018); P1 (Sorokin et al. 2017) and P2 (Aouad et al. 2019).
Fig. 2.
Fig. 2.
Maximum-likelihood phylogeny calculated from AtpAB proteins. The depicted tree contains most features of the other calculated ATP synthase phylogenies. Several taxa were collapsed into higher taxonomic ranks. Important taxa including the halophilic lineages and DPANN (teal) sequences have been colored; Nanohaloarchaea (red), Haloarchaea (blue), Methanonatronarchaeia (purple), Methanomada (brown), Methanotecta methanogens (orange), and the Hikarchaeia (magenta). The tree is drawn as rooted by the TACK Group but should be considered as unrooted. This tree was calculated using the LG+C60 model.
Fig. 3.
Fig. 3.
nMDS plots of the gene families in the Thaumarchaeota and Nanohaloarchaea. Shows the ordination of various gene families (from the Archaea 122 marker set) in the Thaumarchaeota and Nanohaloarchaea. A categorical Mantel test with two defined categories, ATPase genes (colored in blue) and non-ATPase genes (colored in red), was used to determine significance with the 95% confidence ellipse. (A) The gene families in the Thaumarchaeota, the ATPase genes clearly fall outside of the 95% confidence ellipse, with a P = 0.001. (B) The gene families in the Nanohaloarchaea, where the ATPase genes clearly fall inside the ellipse, with a P = 0.182.
Fig. 4.
Fig. 4.
Clustering diagram of 282 gene families that form the core to the Nanohaloarchaea, clustered by the pairwise correlation between distance matrices calculated for individual gene families. Families clustered together share similar (although not identical) evolutionary trajectories as assessed by their distance matrices calculated using maximum-likelihood models (see Materials and Methods). Gene families enclosed by the rectangles share broadly similar evolutionary trajectories (with the same members of their cluster), and likely not have been transferred between divergent lineages, whereas gene families on deep, long branches likely have an unconventional evolutionary trajectory. Subdivisions of the Large Core supermatrix were defined using the clusters (rectangles) in the dendrogram, called the Left (gene families enclosed by the purple rectangle), Right (blue rectangle), and Center (a combination of Left and Right clusters). The blue tip labels indicates where the AtpAB genes fall in the clusters.
Fig. 5.
Fig. 5.
Maximum-likelihood phylogenies of Archaeal Large Core genome supermatrices. All phylogenies were calculated with the LG + C60 mixture model. (A) Maximum-likelihood phylogeny calculated using all 282 gene families. (B) Phylogeny calculated using the Center supermatrix. (C) Phylogeny calculated using the Left supermatrix (95 gene families). (D) Phylogeny calculated using the Right supermatrix (94 gene families). Colored node circles indicate bootstrap support value magnitude.

References

    1. Adam PS, Borrel G, Brochier-Armanet C, Gribaldo S.. 2017. The growing tree of Archaea: new perspectives on their diversity, evolution and ecology. ISME J. 11(11):2407–2425. - PMC - PubMed
    1. Andrade K, et al.2015. Metagenomic and lipid analyses reveal a diel cycle in a hypersaline microbial ecosystem. ISME J. 9(12):2697–2711. - PMC - PubMed
    1. Ané C, Larget B, Baum DA, Smith SD, Rokas A.. 2007. Bayesian estimation of concordance among gene trees. Mol Biol Evol. 24(7):1575. - PubMed
    1. Aouad M, Borrel G, Brochier-Armanet C, Gribaldo S.. 2019. Evolutionary placement of Methanonatronarchaeia. Nat Microbiol. 4(4):558–559. - PubMed
    1. Aouad M, et al.2018. Extreme halophilic archaea derive from two distinct methanogen Class II lineages. Mol Phylogenet Evol. 127:46–54. - PubMed

Publication types