. 2021 Jul 13;16(7):e0254384.
doi: 10.1371/journal.pone.0254384. eCollection 2021.

Characterization of real-world networks through quantum potentials

Affiliations

Characterization of real-world networks through quantum potentials

Nicola Amoroso et al. PLoS One. .

Abstract

Network connectivity has been thoroughly investigated in several domains, including physics, neuroscience, and social sciences. This work tackles the possibility of characterizing the topological properties of real-world networks from a quantum-inspired perspective. Starting from the normalized Laplacian of a network, we use a well-defined procedure, based on the dressing transformations, to derive a 1-dimensional Schrödinger-like equation characterized by the same eigenvalues. We investigate the shape and properties of the potential appearing in this equation in simulated small-world and scale-free network ensembles, using measures of fractality. Besides, we employ the proposed framework to compare real-world networks with the Erdős-Rényi, Watts-Strogatz and Barabási-Albert benchmark models. Reconstructed potentials allow to assess to which extent real-world networks approach these models, providing further insight on their formation mechanisms and connectivity properties.


Conflict of interest statement

The authors have declared that no competing interests exist.

Figures

Fig 1
Fig 1. Evaluation of the similarity between a real-world network and different ensembles of artificial networks.
The similarity is measured as the average root-mean-square error (RMSE) of the real network potential with respect to the potentials associated with the networks of each ensemble. Moreover, we compare these results with the RMSE between the real network potential and the ensemble median potentials.
Fig 2
Fig 2. WS models with N = 500 nodes and the related reconstructed potentials.
The figure shows how topological variability (upper panel), induced in a WS model with c = 4 by changing the rewiring probability, is captured by the reconstructed potentials (lower panel). Potentials (red) are superimposed to the network spectrum (pale blue). Notice that the potentials are even by construction.
Fig 3
Fig 3. WS ensemble potential at different (c, prew) parameter configurations.
Ensemble potentials Vm computed over 100 WS networks with N = 500 nodes and rewiring probabilities prew = 0.1 (left) and 0.9 (right). To facilitate comparison with the analogous ensemble potentials in the ER network model [31], plots are labeled using the equivalent connection probability p, related with the average degree c as p = c/(N −1).
Fig 4
Fig 4. HFD of WS ensemble potentials.
Higuchi fractal dimension (HFD) of the ensemble potential Vm over 100 graphs with N = 500 nodes and average degree c, resulting from a WS model with rewiring probability prew = 0.1 (left) and 0.9 (right), as a function of the equivalent connection probability p = c/(N − 1).
Fig 5
Fig 5. WS and ER ensemble potentials.
Direct comparison of ensemble potentials Vm reconstructed from 100 realizations of WS and ER networks with the same average degree c. Remarkable discrepancies between the two models emerge at intermediate values of c, provided that the rewiring probability of the WS construction is sufficiently small.
Fig 6
Fig 6. BA models with N = 500 nodes and the related reconstructed potentials.
The figure shows in the upper panel three examples of BA networks (m = 1, 10, 400) while in the lower panel the reconstructed potentials (red) are superimposed to the corresponding graph spectrum (green).
Fig 7
Fig 7. BA ensemble potential for different m values.
Ensemble potentials Vm computed over 100 BA networks with N = 500 nodes and m connections made by each new node to the existing ones in the graph construction procedure. The figure shows how potentials vary according to the parameter m ranging from 1 to 400, with the left (right) panel reporting the cases of smaller (larger) m.
Fig 8
Fig 8. HFD of BA ensemble potentials.
Higuchi fractal dimension (HFD) of the ensemble potential Vm over 100 graphs with N = 500 nodes, resulting from a BA model, as a function of the parameter m.
Fig 9
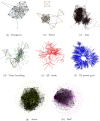
Fig 9. Real-world network graphs.
Graph representation of the real-world networks reported in Table 1.
Fig 10
Fig 10. Real-world network spectral distributions.
Distributions of graph eigenvalues, shifted to the interval [−2,0], related to the real-world networks reported in Table 1.
Fig 11
Fig 11. Real-world network potentials.
Potentials reconstructed from the graph spectra of the real-world networks reported in Table 1, paired according to their domain.

References

    1. Newman ME. The structure and function of complex networks. SIAM review. 2003;45(2):167–256. doi: 10.1137/S003614450342480 - DOI
    1. Barabási AL, Pósfai M. Network science. Cambridge University Press; 2016. Available from: http://barabasi.com/networksciencebook/.
    1. Palla G, Derényi I, Farkas I, Vicsek T. Uncovering the overlapping community structure of complex networks in nature and society. Nature. 2005;435(7043):814–818. doi: 10.1038/nature03607 - DOI - PubMed
    1. Albert R, Barabási AL. Statistical mechanics of complex networks. Reviews of Modern Physics. 2002;74(1):47. doi: 10.1103/RevModPhys.74.47 - DOI
    1. Goh KI, Cusick ME, Valle D, Childs B, Vidal M, Barabási AL. The human disease network. Proceedings of the National Academy of Sciences. 2007;104(21):8685–8690. doi: 10.1073/pnas.0701361104 - DOI - PMC - PubMed