. 2021 Sep 21;144(12):961-982.
doi: 10.1161/CIRCULATIONAHA.120.046464. Epub 2021 Jul 13.

Hyperglycemia Induces Trained Immunity in Macrophages and Their Precursors and Promotes Atherosclerosis

Affiliations

Hyperglycemia Induces Trained Immunity in Macrophages and Their Precursors and Promotes Atherosclerosis

Laurienne Edgar et al. Circulation. .

Abstract

Background: Cardiovascular risk in diabetes remains elevated despite glucose-lowering therapies. We hypothesized that hyperglycemia induces trained immunity in macrophages, promoting persistent proatherogenic characteristics.

Methods: Bone marrow-derived macrophages from control mice and mice with diabetes were grown in physiological glucose (5 mmol/L) and subjected to RNA sequencing (n=6), assay for transposase accessible chromatin sequencing (n=6), and chromatin immunoprecipitation sequencing (n=6) for determination of hyperglycemia-induced trained immunity. Bone marrow transplantation from mice with (n=9) or without (n=6) diabetes into (normoglycemic) Ldlr-/- mice was used to assess its functional significance in vivo. Evidence of hyperglycemia-induced trained immunity was sought in human peripheral blood mononuclear cells from patients with diabetes (n=8) compared with control subjects (n=16) and in human atherosclerotic plaque macrophages excised by laser capture microdissection.

Results: In macrophages, high extracellular glucose promoted proinflammatory gene expression and proatherogenic functional characteristics through glycolysis-dependent mechanisms. Bone marrow-derived macrophages from diabetic mice retained these characteristics, even when cultured in physiological glucose, indicating hyperglycemia-induced trained immunity. Bone marrow transplantation from diabetic mice into (normoglycemic) Ldlr-/- mice increased aortic root atherosclerosis, confirming a disease-relevant and persistent form of trained innate immunity. Integrated assay for transposase accessible chromatin, chromatin immunoprecipitation, and RNA sequencing analyses of hematopoietic stem cells and bone marrow-derived macrophages revealed a proinflammatory priming effect in diabetes. The pattern of open chromatin implicated transcription factor Runt-related transcription factor 1 (Runx1). Similarly, transcriptomes of atherosclerotic plaque macrophages and peripheral leukocytes in patients with type 2 diabetes were enriched for Runx1 targets, consistent with a potential role in human disease. Pharmacological inhibition of Runx1 in vitro inhibited the trained phenotype.

Conclusions: Hyperglycemia-induced trained immunity may explain why targeting elevated glucose is ineffective in reducing macrovascular risk in diabetes and suggests new targets for disease prevention and therapy.

Keywords: diabetes mellitus; epigenetics; glucose; inflammation; macrophages.


Figures
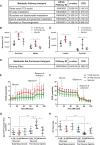
Figure 1.
Figure 1.
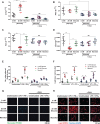
High glucose alters cellular metabolism. A, Metabolic pathway analysis. Individual measurements for (B) succinate, malate, (C) lactate and pyruvate and (D) metabolite set enrichment analysis (Metaboanalyst) for human monocyte cell lysate metabolomics samples (n=5). Extracellular flux analysis on mouse bone marrow–derived macrophages (Seahorse bioanalyzer; n=6 individual animals) measured (E) extracellular acidification rate (ECAR) and (F) oxygen consumption rate (OCR) in response to various extracellular glucose, osmotic control (mannitol), and metabolic inhibitor injections. High glucose (G) increased glycolytic ATP (glycoATP) production and (H) decreased ATP rate index (mitochondrial ATP production rate/glycoATP production rate), indicating a shift to a more glycolytic phenotype. Data analyzed by (B and C) 2-way ANOVA or (E–H) 1-way ANOVA plus Bonferroni post hoc test. All data shown are mean±SD. AU indicates arbitrary units; FDR, false discovery rate; and TCA, tricarboxylic acid. *P<0.05; **P<0.01; ***P<0.001.
Figure 2.
Figure 2.
High glucose alters macrophage gene expression and function. M1 (lipopolysaccharide [LPS]+interferon-γ [IFN-γ] stimulated) bone marrow–derived macrophage (BMDM) (A) Il-6 and (B) iNos gene expression in the presence or absence of dichloroacetate (DCA). M2 (interleukin-4 stimulated) BMDM (C) Ym1 and (D) Fizz1 gene expression. A through D, Quantitative polymerase chain reaction data are normalized to B2m expression; n=7 to 10. E, Image quantification of mouse monocyte adhesion to endothelial cells (n=5). F, Image quantification of acetylated low-density lipoprotein uptake by BMDMs, normalized by cell number per image. Representative (G) static adhesion images of fluorescently PKH67-labeled mouse monocytes to endothelial cells and (H) Oil Red O (ORO)– and DAPI-stained foam cell images. All data (A–H) are shown as mean±SD; (A–D) 1-way ANOVA or (E and F) 2-way ANOVA with Bonferroni post hoc analysis. Each point represents an individual animal (average of 4 images for static adhesion and foam cell formation). AU indicates arbitrary units; NS, nonsignificant. *P<0.05; **P<0.01; ***P<0.001.
Figure 3.
Figure 3.
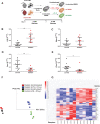
Bone marrow (BM)–derived macrophages (BMDMs) from diabetic mice manifest hyperglycemic memory in gene expression. A, Schematic of diabetic and control BMDM protocol (n=10–12). M1 gene expression analysis of (B) Il-6 (P<0.0001) and (C) iNos. M2 (D) Ym1 (P=0.0003) and (E) Fizz1 (P=0.0326) gene expression. B through E, All quantitative polymerase chain reaction data are normalized to B2m expression, analyzed by the unpaired t test. F, Principal component (PC) analysis of all control and diabetic BMDM RNA sequencing (RNA-seq) transcript reads (n=6); percent indicates sample variability. G, Unsupervised hierarchical clustering shows marked segregation of 39 previously identified M1 and M2 macrophage marker genes in lipopolysaccharide (LPS)+interferon-γ (IFN-γ)–stimulated BMDMs from diabetic or control origin (RNA-seq analysis). IL indicates interleukin.
Figure 4.
Figure 4.
Bone marrow–derived macrophages (BMDMs) from diabetic mice display altered functions despite glucose normalization. BMDMs from diabetic mice were differentiated in 5 mmol/L (n=5–8). A, Image quantification of BMDM adhesion to endothelial cells (n=8). B, Image quantification of acetylated low-density lipoprotein uptake by BMDMs, normalized by cell number per image. Representative (C) static adhesion images of fluorescently (PKH67) labeled BMDMs to endothelial cells and (D) Oil Red O (ORO)– and DAPI-stained foam cell images. All data are shown as mean±SD, and each point represents an individual animal (average of 4 images for static adhesion and foam cell formation). Data analyzed by 2-way ANOVA with Bonferroni post hoc test. IFN-γ indicates interferon-γ; and LPS, lipopolysaccharide. *P<0.05; **P<0.01; ***P<0.001.
Figure 5.
Figure 5.
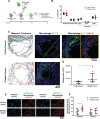
Diabetic bone marrow (BM) drives atherosclerosis despite prolonged glucose normalization. A, Schematic of BM transplantation experiment. B, Flow cytometric analysis of peripheral leukocyte populations in mice after 12 weeks of bone marrow transplantation. C, Representative aortic root images from Ldlr−/− mice that had received either diabetic donor or control donor CD68-GFP BM. Masson Trichrome stained (left) and immunofluorescence stained for BM transplant–derived macrophages (green indicates green fluorescent protein [GFP]) or all macrophages (red indicates galectin-3 [GAL3]). Image quantification of (D) plaque volume (P=0.036). Data shown as mean±SD, analyzed by 1-way ANOVA with Bonferroni post hoc test (B), or median±interquartile range, analyzed by Mann-Whitney U test (D); control n=6, diabetic n=9. E, Representative aortic root images from Ldlr−/− mice that had received either diabetic or control BM transplantation. F, Quantification of the percentage of nuclei stained positive for H3K4me3 or H3K27ac within the GAL3 macrophage positive region. Each data point represents an individual animal (average, 6 sections; n= 7 to 10). Shown as mean±SD. One-way ANOVA analysis. BMDM indicates BM-derived macrophages; HSC, hematopoietic stem cell; IFN-γ, interferon-γ; and LPS, lipopolysaccharide. *P<0.05.
Figure 6.
Figure 6.
Diabetes alters levels of H3K4me3 and H3K27ac and chromatin accessibility. MA plot of all assay for transposase accessible chromatin sequencing chromatin reads in (A) unstimulated or (B) stimulated bone marrow–derived macrophages (BMDMs), where peaks with differential accessibility (false discovery rate <0.05, fold change >1.5) are highlighted in pink (1047 unstimulated, 40 stimulated, n=6). C, Variable regions of H3K4me3 and H3K27ac quantified by chromatin immunoprecipitation sequencing in hematopoietic stem cells (HSCs) and BMDMs from control versus diabetic mice (n=6 per group). D, Histogram of the average coverage of H3K27ac and K3K4me3 in HSCs, unstimulated BMDMs, and proinflammatory stimulated BMDMs (lipopolysaccharide [LPS]+interferon-γ [IFN-γ]) at transcription start sites±1 kb of protein-coding genes proximate to regions of increased accessibility in unstimulated BMDMs (vs controls; n = 405) and compared with background levels in nonselected regions.
Figure 7.
Figure 7.
Chromatin modifications in diabetic mice. A, Comparison (log2 fold change [FC], diabetes vs control) of assay for transposase accessible chromatin sequencing (ATAC-seq) peaks and the mRNA level of the proximate genes from unstimulated bone marrow–derived macrophages (BMDMs). An adjusted false discovery rate cutoff of P<0.05 was applied to ATAC-seq regions and RNA sequencing (RNA-seq) genes. B, Integrative Genome Browser track plots for Il-6) and Hk1 showing ATAC-seq, H3K4me3 chromatin immunoprecipitation sequencing (ChIP-seq), and H3K27ac ChIP-seq reads from representative samples of hematopoietic stem cells (HSCs), unstimulated BMDMs and proinflammatory stimulated BMDMs (lipopolysaccharide [LPS]+interferon-γ [IFN-γ]) from control and diabetic mice. Regions at transcription start sites±1 kb containing peaks are highlighted by black boxes.
Figure 8.
Figure 8.
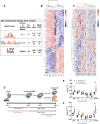
Role for RUNX1 hyperglycemia-induced trained immunity. Top 3 transcription factor motifs identified in assay for transposase accessible chromatin sequencing (ATAC-seq) peaks differentially enriched (A) unstimulated diabetic HSC (n=3) compared with unstimulated control hematopoietic stem cells (HSCs; n=4). Unsupervised hierarchical clustering of differentially expressed genes from RNA sequencing (RNA-seq) analysis of (B) diabetic (n=6) or control (n=6) bone marrow (BM)–derived macrophages (BMDMs) stimulated with lipopolysaccharide (LPS)+interferon-γ (IFN-γ). Unsupervised hierarchical clustering of differentially expressed genes from (C) diabetic (n=8) or control (n=16) laser capture microdissected human carotid plaque macrophage samples. B and C, Runt-related transcription factor 1 (Runx1) target genes (RUNX1) (P<0.05 stringency) are highlighted in red to the left of the heat map. Wild-type (WT) BM was differentiated into BMDMs in physiological (5 mmol/L) or high (20 mmol/L) glucose, rested for 2 days in 5 mmol/L glucose, and then stimulated in 5 mmol/L glucose±varying concentrations of Ro5-3335, (D) as illustrated. M1 gene expression of (E) Il-6 and (F) Il-1β assessed by quantitative polymerase chain reaction; data normalized to B2m expression. Data displayed as mean±SD, 2-way ANOVA with Bonferroni post hoc. Sample n=5 individual animals. FC indicates fold change. *P<0.05; ***P<0.001.

Comment in

References

    1. American Diabetes Association. Cardiovascular disease and risk management. Diabetes Care. 2015; 38:S49–S57. doi: 10.2337/dc15-S011 - PubMed
    1. Nathan DM, Cleary PA, Backlund JY, Genuth SM, Lachin JM, Orchard TJ, Raskin P, Zinman B. Diabetes Control and Complications Trial/Epidemiology of Diabetes Interventions and Complications (DCCT/EDIC) Study Research Group. Intensive diabetes treatment and cardiovascular disease in patients with type 1 diabetes. N Engl J Med. 2005; 353:2643–2653. doi: 10.1056/NEJMoa052187 - PMC - PubMed
    1. Nathan DM, Genuth S, Lachin J, Cleary P, Crofford O, Davis M, Rand L, Siebert C. Diabetes Control and Complications Trial Research Group. The effect of intensive treatment of diabetes on the development and progression of long-term complications in insulin-dependent diabetes mellitus. N Engl J Med. 1993; 329:977–986. doi: 10.1056/NEJM199309303291401 - PubMed
    1. Gerstein HC, Miller ME, Genuth S, Ismail-Beigi F, Buse JB, Goff DC, Jr, Probstfield JL, Cushman WC, Ginsberg HN, Bigger JT, et al. . ACCORD. Long-term effects of intensive glucose lowering on cardiovascular outcomes. N Engl J Med. 2011; 364:818–828. doi: 10.1056/NEJMoa1006524 - PMC - PubMed
    1. Zinman B, Wanner C, Lachin JM, Fitchett D, Bluhmki E, Hantel S, Mattheus M, Devins T, Johansen OE, Woerle HJ, et al. . EMPA-REG OUTCOME Investigators. Empagliflozin, cardiovascular outcomes, and mortality in type 2 diabetes. N Engl J Med. 2015; 373:2117–2128. doi: 10.1056/NEJMoa1504720 - PubMed

Publication types