

Dynamics of the complex food environment underlying dietary intake in low-income groups: a systems map of associations extracted from a systematic umbrella literature review
- PMID: 34256794
- PMCID: PMC8276221
- DOI: 10.1186/s12966-021-01164-1
Dynamics of the complex food environment underlying dietary intake in low-income groups: a systems map of associations extracted from a systematic umbrella literature review
Abstract
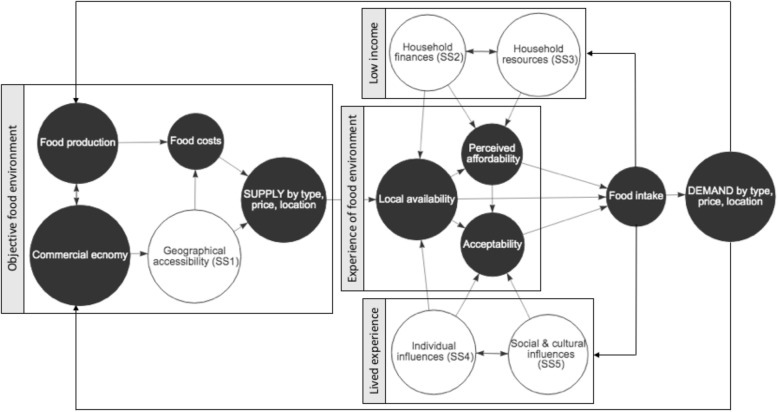
Background: Inequalities in obesity pertain in part to differences in dietary intake in different socioeconomic groups. Examining the economic, social, physical and political food environment of low-income groups as a complex adaptive system - i.e. a system of multiple, interconnected factors exerting non-linear influence on an outcome, can enhance the development and assessment of effective policies and interventions by honouring the complexity of lived reality. We aimed to develop and apply novel causal loop diagramming methods in order to construct an evidence-based map of the underlying system of environmental factors that drives dietary intake in low-income groups.
Methods: A systematic umbrella review was conducted on literature examining determinants of dietary intake and food environments in low-income youths and adults in high/upper-middle income countries. Information on the determinants and associations between determinants was extracted from reviews of quantitative and qualitative studies. Determinants were organised using the Determinants of Nutrition and Eating (DONE) framework. Associations were synthesised into causal loop diagrams that were subsequently used to interpret the dynamics underlying the food environment and dietary intake. The map was reviewed by an expert panel and systems-based analysis identified the system paradigm, structure, feedback loops and goals.
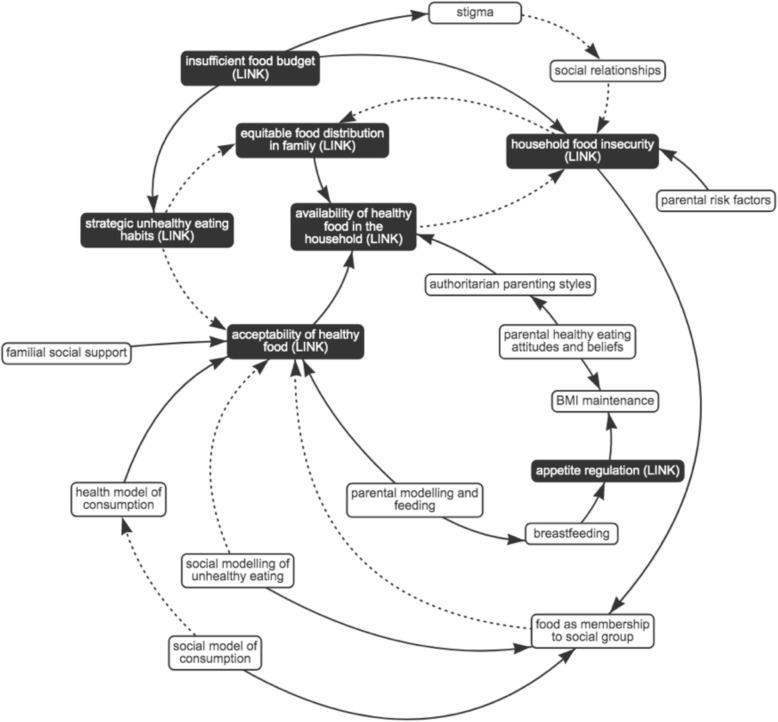
Results: Findings from forty-three reviews and expert consensus were synthesised in an evidence-based map of the complex adaptive system underlying the food environment influencing dietary intake in low-income groups. The system was interpreted as operating within a supply-and-demand, economic paradigm. Five sub-systems ('geographical accessibility', 'household finances', 'household resources', 'individual influences', 'social and cultural influences') were presented as causal loop diagrams comprising 60 variables, conveying goals which undermine healthy dietary intake.
Conclusions: Our findings reveal how poor dietary intake in low-income groups can be presented as an emergent property of a complex adaptive system that sustains a food environment that increases the accessibility, availability, affordability and acceptability of unhealthy foods. In order to reshape system dynamics driving unhealthy food environments, simultaneous, diverse and innovative strategies are needed to facilitate longer-term management of household finances and socially-oriented practices around healthy food production, supply and intake. Ultimately, such strategies must be supported by a system paradigm which prioritises health.
Keywords: Complex adaptive systems; Diet; Food environment; Inequality; Low-income groups; System dynamics.
© 2021. The Author(s).
Conflict of interest statement
The authors declare that they have no competing interests.
Figures


References
-
- World Health Organisation. Factsheet: Non-communicable diseases. Geneva: World Health Organisation; 2018.
-
- McNamara C, Balaj M, Thomson K, Eikemo T, Solheim E, Bambra C. The socioeconomic distribution of non-communicable diseases in Europe: findings from the European social survey (2014) special module on the social determinants of health. Eur J Pub Health. 2017;27(suppl_1):22–26. doi: 10.1093/eurpub/ckw222. - DOI - PubMed
Publication types
MeSH terms
LinkOut - more resources
Full Text Sources
