

Non-genetic photoacoustic stimulation of single neurons by a tapered fiber optoacoustic emitter
- PMID: 34257273
- PMCID: PMC8277806
- DOI: 10.1038/s41377-021-00580-z
Non-genetic photoacoustic stimulation of single neurons by a tapered fiber optoacoustic emitter
Abstract
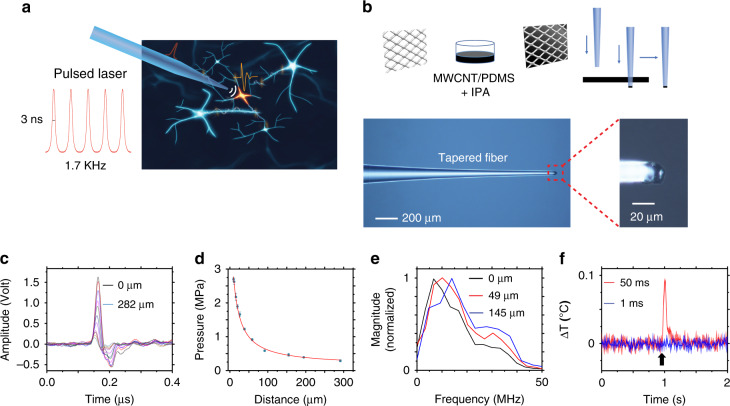
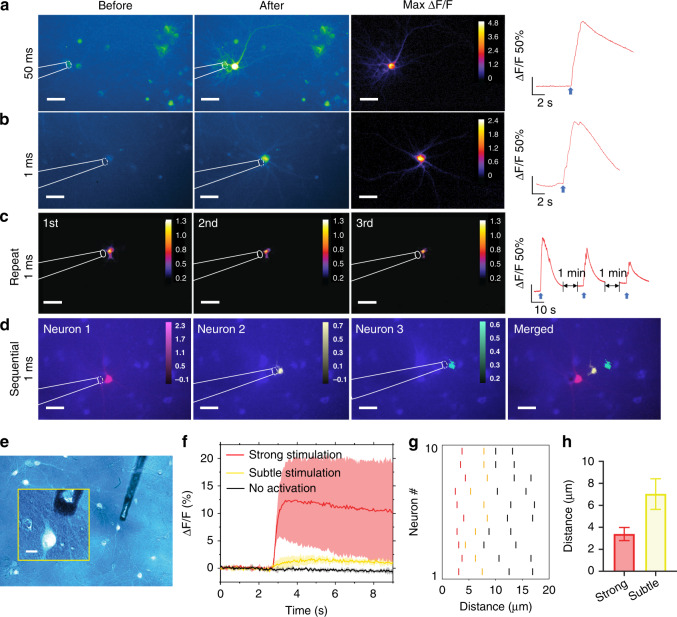
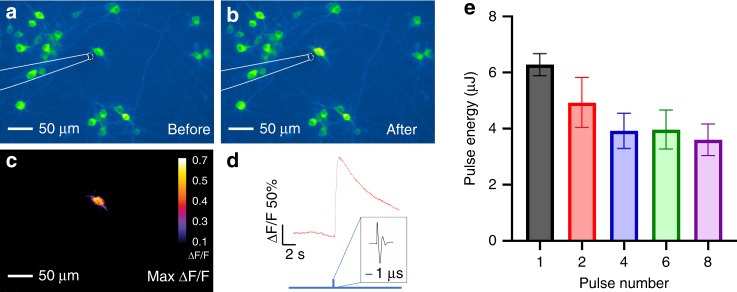
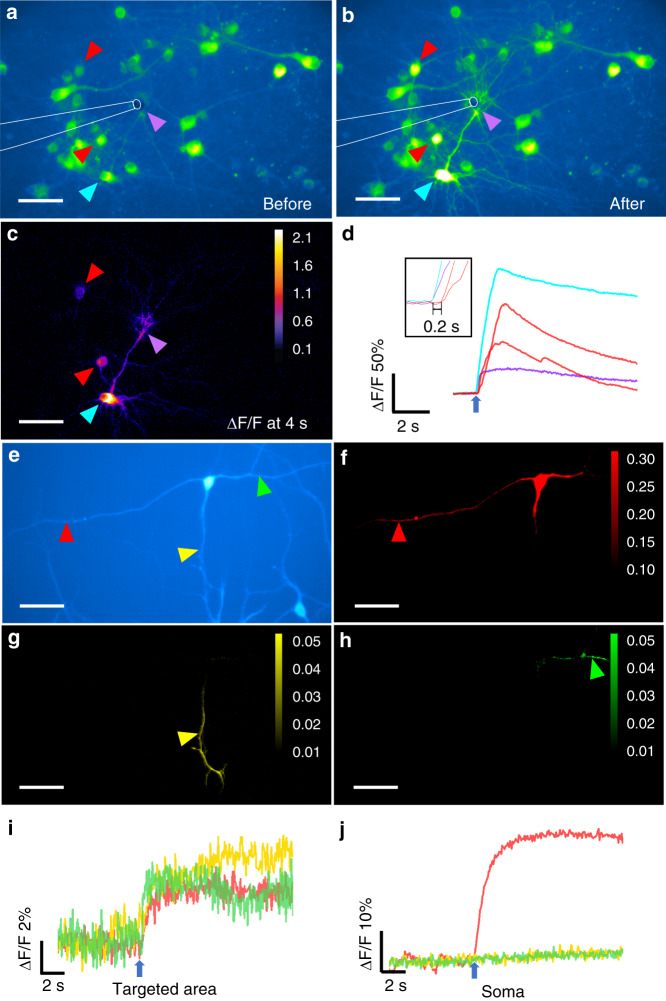
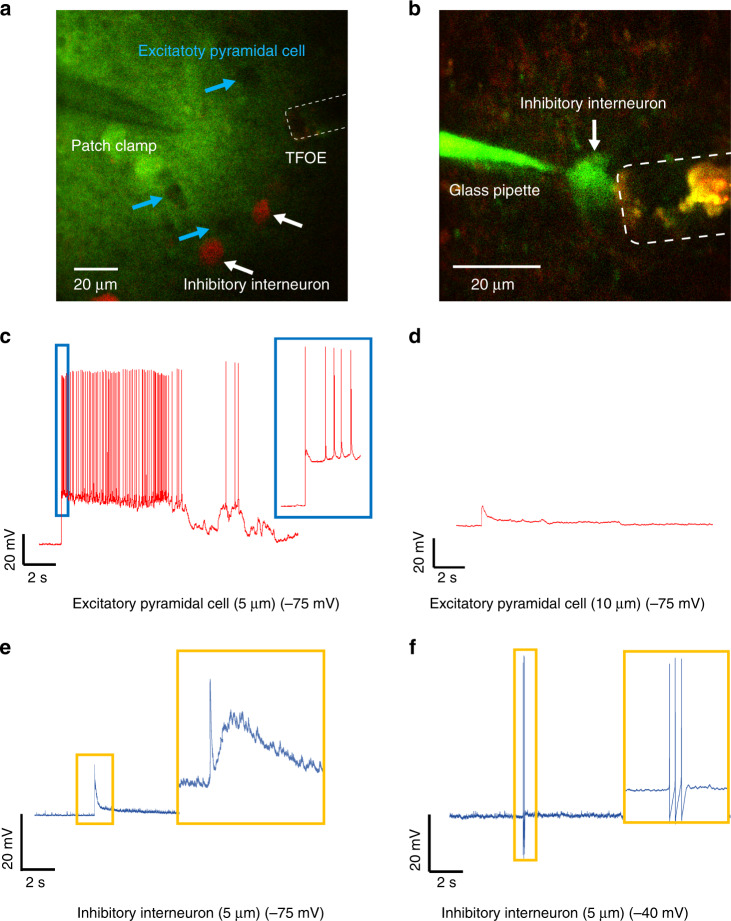
Neuromodulation at high spatial resolution poses great significance in advancing fundamental knowledge in the field of neuroscience and offering novel clinical treatments. Here, we developed a tapered fiber optoacoustic emitter (TFOE) generating an ultrasound field with a high spatial precision of 39.6 µm, enabling optoacoustic activation of single neurons or subcellular structures, such as axons and dendrites. Temporally, a single acoustic pulse of sub-microsecond converted by the TFOE from a single laser pulse of 3 ns is shown as the shortest acoustic stimuli so far for successful neuron activation. The precise ultrasound generated by the TFOE enabled the integration of the optoacoustic stimulation with highly stable patch-clamp recording on single neurons. Direct measurements of the electrical response of single neurons to acoustic stimulation, which is difficult for conventional ultrasound stimulation, have been demonstrated. By coupling TFOE with ex vivo brain slice electrophysiology, we unveil cell-type-specific responses of excitatory and inhibitory neurons to acoustic stimulation. These results demonstrate that TFOE is a non-genetic single-cell and sub-cellular modulation technology, which could shed new insights into the mechanism of ultrasound neurostimulation.
© 2021. The Author(s).
Conflict of interest statement
The authors declare no conflicts of interests.
Figures
Similar articles
-
Photoacoustic: A Versatile Nongenetic Method for High-Precision Neuromodulation.Acc Chem Res. 2024 Jun 4;57(11):1595-1607. doi: 10.1021/acs.accounts.4c00119. Epub 2024 May 17. Acc Chem Res. 2024. PMID: 38759211 Free PMC article. Review.
-
High-precision neural stimulation by a highly efficient candle soot fiber optoacoustic emitter.Front Neurosci. 2022 Nov 3;16:1005810. doi: 10.3389/fnins.2022.1005810. eCollection 2022. Front Neurosci. 2022. PMID: 36408413 Free PMC article.
-
Multifunctional Fiber-Based Optoacoustic Emitter as a Bidirectional Brain Interface.Adv Healthc Mater. 2023 Oct;12(25):e2300430. doi: 10.1002/adhm.202300430. Epub 2023 Jul 31. Adv Healthc Mater. 2023. PMID: 37451259 Free PMC article.
-
Multifunctional fiber-based optoacoustic emitter for non-genetic bidirectional neural communication.ArXiv [Preprint]. 2023 Jan 9:arXiv:2301.03659v1. ArXiv. 2023. Update in: Adv Healthc Mater. 2023 Oct;12(25):e2300430. doi: 10.1002/adhm.202300430. PMID: 36713235 Free PMC article. Updated. Preprint.
-
Shedding light on ultrasound in action: Optical and optoacoustic monitoring of ultrasound brain interventions.Adv Drug Deliv Rev. 2024 Feb;205:115177. doi: 10.1016/j.addr.2023.115177. Epub 2024 Jan 5. Adv Drug Deliv Rev. 2024. PMID: 38184194 Free PMC article. Review.
Cited by
-
Towards in vivo photoacoustic human imaging: Shining a new light on clinical diagnostics.Fundam Res. 2023 Feb 14;4(5):1314-1330. doi: 10.1016/j.fmre.2023.01.008. eCollection 2024 Sep. Fundam Res. 2023. PMID: 39431136 Free PMC article. Review.
-
Optically-generated focused ultrasound for noninvasive brain stimulation with ultrahigh precision.Light Sci Appl. 2022 Nov 3;11(1):321. doi: 10.1038/s41377-022-01004-2. Light Sci Appl. 2022. PMID: 36323662 Free PMC article.
-
Nanoparticle-based optical interfaces for retinal neuromodulation: a review.Front Cell Neurosci. 2024 Mar 20;18:1360870. doi: 10.3389/fncel.2024.1360870. eCollection 2024. Front Cell Neurosci. 2024. PMID: 38572073 Free PMC article. Review.
-
High-precision neural stimulation through optoacoustic emitters.Neurophotonics. 2022 Jul;9(3):032207. doi: 10.1117/1.NPh.9.3.032207. Epub 2022 Mar 23. Neurophotonics. 2022. PMID: 35355658 Free PMC article.
-
A biodegradable, flexible photonic patch for in vivo phototherapy.Nat Commun. 2023 May 27;14(1):3069. doi: 10.1038/s41467-023-38554-x. Nat Commun. 2023. PMID: 37244895 Free PMC article.
References
Grants and funding
LinkOut - more resources
Full Text Sources
Miscellaneous
