. 2021 Jul 13;12(1):4290.
doi: 10.1038/s41467-021-24473-2.

IL-15 and PIM kinases direct the metabolic programming of intestinal intraepithelial lymphocytes

Affiliations

IL-15 and PIM kinases direct the metabolic programming of intestinal intraepithelial lymphocytes

Olivia J James et al. Nat Commun. .

Abstract

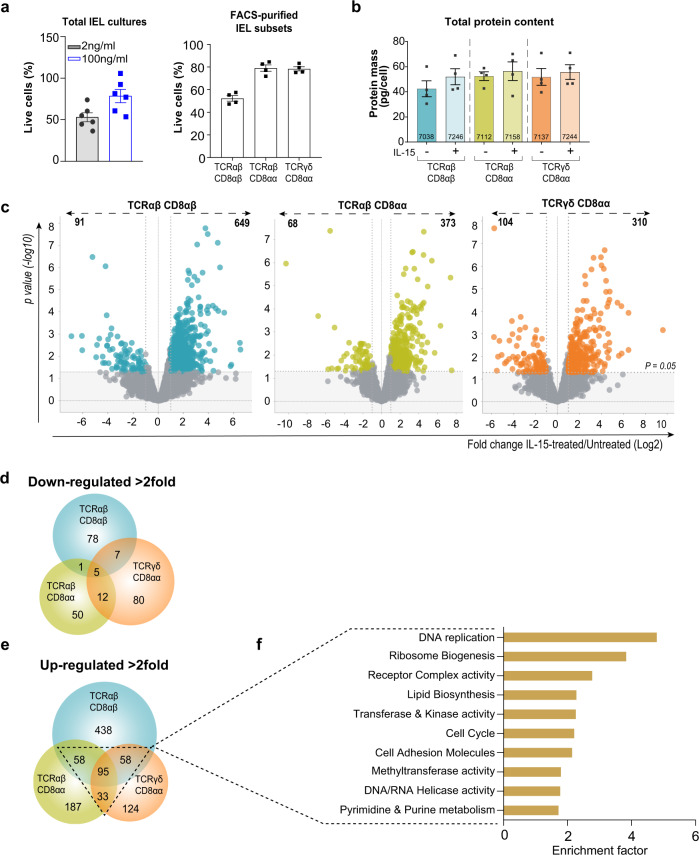
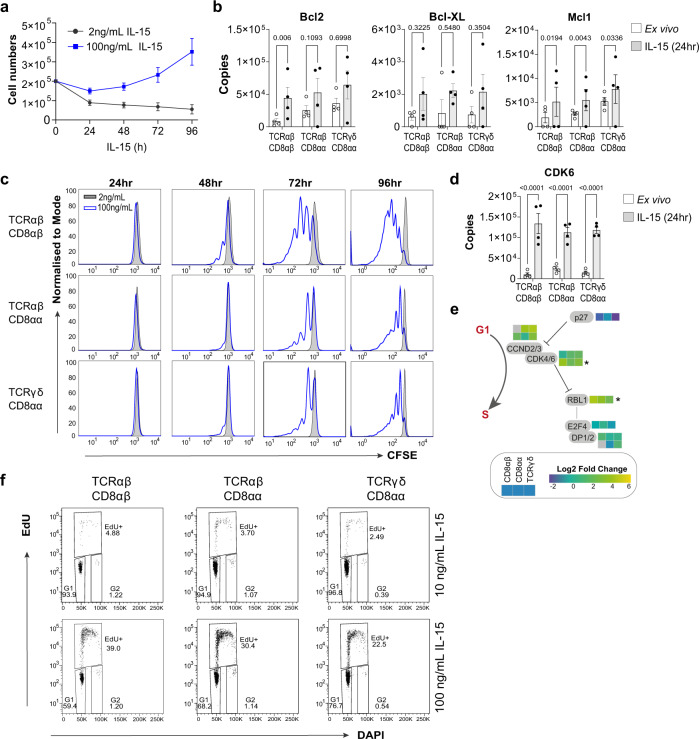
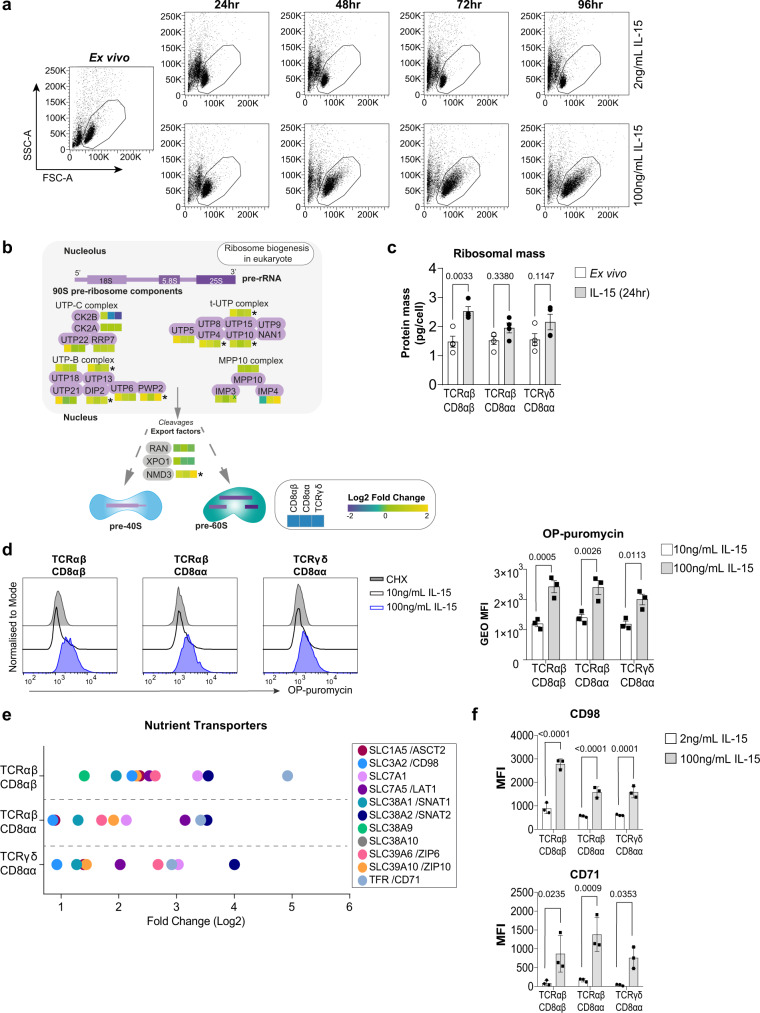
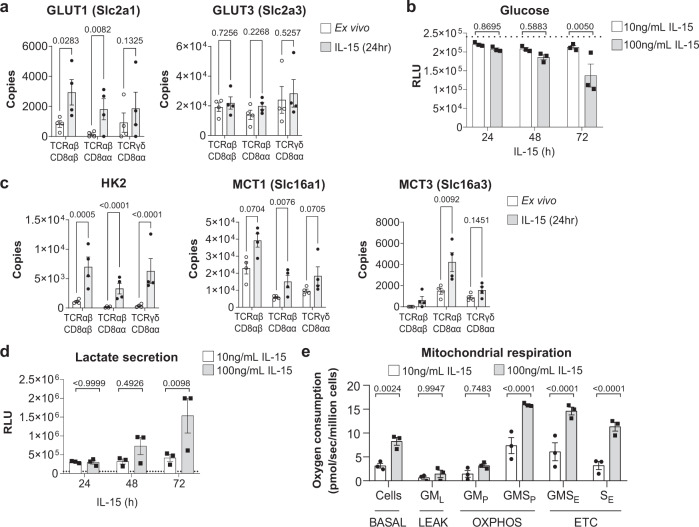
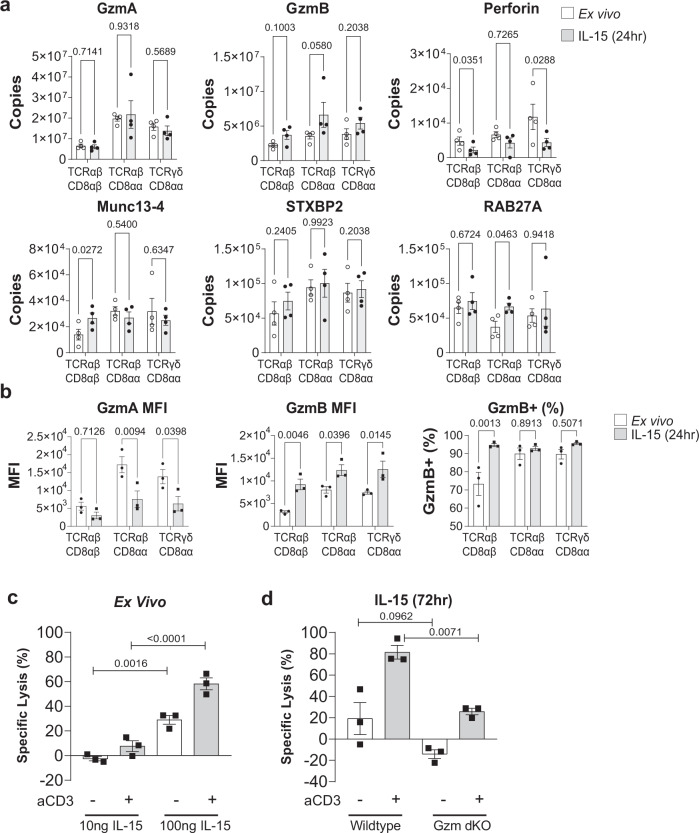
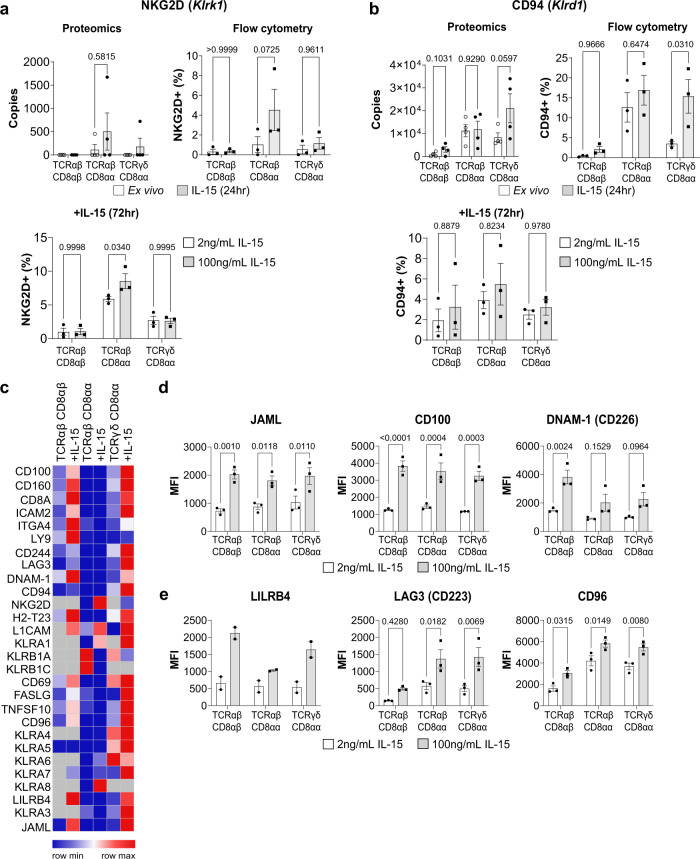
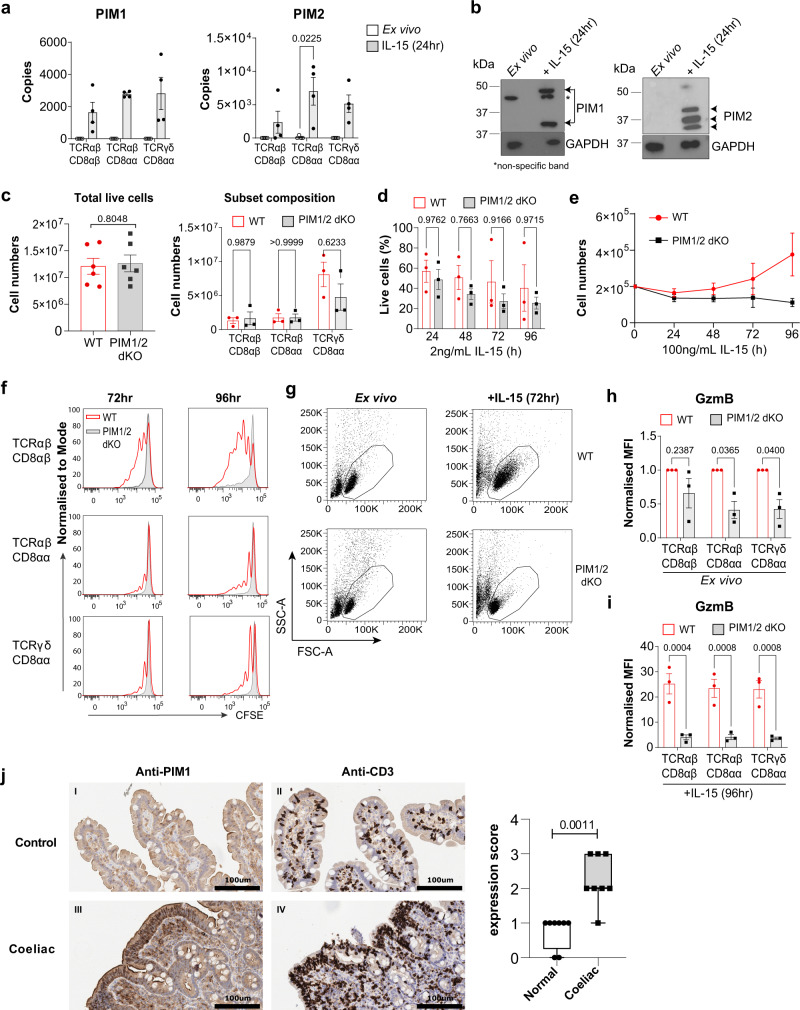
Intestinal intraepithelial lymphocytes (IEL) are an abundant population of tissue-resident T cells that protect and maintain the intestinal barrier. IEL respond to epithelial cell-derived IL-15, which is complexed to the IL-15 receptor α chain (IL-15/Rα). IL-15 is essential both for maintaining IEL homeostasis and inducing IEL responses to epithelial stress, which has been associated with Coeliac disease. Here, we apply quantitative mass spectrometry to IL-15/Rα-stimulated IEL to investigate how IL-15 directly regulates inflammatory functions of IEL. IL-15/Rα drives IEL activation through cell cycle regulation, upregulation of metabolic machinery and expression of a select repertoire of cell surface receptors. IL-15/Rα selectively upregulates the Ser/Thr kinases PIM1 and PIM2, which are essential for IEL to proliferate, grow and upregulate granzyme B in response to inflammatory IL-15. Notably, IEL from patients with Coeliac disease have high PIM expression. Together, these data indicate PIM kinases as important effectors of IEL responses to inflammatory IL-15.


Conflict of interest statement

The authors declare no competing interests.

Figures

Fig. 1
Fig. 1. Global effects of IL-15/Rα stimulation on the proteomes of the three main IEL subsets.
a Bar chart shows the percentage of live cells following 24 h IL-15/Rα (100 ng/mL) stimulation of CD8+ IEL (left, n = 6 biologically independent experiments) and Fluorescence activated cell sorting (FACS)-purified IEL subsets (right, n = 4 biologically independent samples) (gating strategy shown in Supplementary Fig. 1a). Percentages were calculated from the number of cells that were considered live (negative for DAPI staining) following IL-15/Rα treatment for 24 h, divided by the number of cells seeded for culture (1 million/mL). b The protein content (pg/cell) of each IEL subset ± 24h IL-15/Rα stimulation. The number of proteins identified by average copy number expression in each subset are displayed on the respective bars (n = 4 biologically independent samples). c Volcano plots show the differential expression of proteins following IL-15 stimulation for each IEL subset. Data are presented as the distribution of the copy number ratio (IL-15-treated vs untreated) (log2 (fold change)) against the inverse significance value (−log10(p-value)). Proteins were considered differentially expressed following IL-15 stimulation if the log2 fold-change value was >1 (>2-fold) in either an upregulated or downregulated direction. The grey area depicts the cut-off for proteins deemed to have an insignificant fold change (p-value >0.05). Hence, proteins in colour were deemed significantly changed following IL-15 stimulation. Statistical significance was derived from two-tailed empirical Bayes moderated t-statistics performed in limma on total proteome, see Supplementary Data 3. d, e Venn diagrams show the commonality of proteins significantly downregulated and upregulated (>2-fold), respectively, between all IEL subsets following 24 h IL-15/Rα stimulation. f Top 10 functional clusters enriched in proteins that were commonly 2-fold upregulated by IL-15/Rα stimulation in at least 2 IEL subsets, as in e. See also supplementary Data 2. All error bars are mean ± s.e.m.
Fig. 2
Fig. 2. IL-15/Rα stimulation drives proliferation of IEL by licensing the G1/S transition.
a Total numbers of live CD8+ IEL following culture with IL-15/Rα (100 ng/mL or 2 ng/mL) (0–72 h n = 7, 96 h n = 6 biologically independent experiments). b Estimated copy numbers/cell of survival proteins Bcl2, Bcl2l1 (Bcl-xL) and Mcl1 in each IEL subset ± 24 h 100 ng/mL IL-15/Rα stimulation (n = 4 biologically independent samples). c IEL were stained with CellTrace CFSE prior to stimulation with either 2 ng/mL (grey) or 100 ng/mL (blue) IL-15/Rα for 4 days. Every 24 h cells were stained for subsets; TCRαβCD8αβ, TCRαβCD8αα, TCRγδCD8αα and CFSE expression was analysed by flow cytometry (gating strategy as in Supplementary Fig. 1a). The discrete peaks in the histograms represent successive generations of live, DAPI-negative IEL (representative of n = 3 biologically independent experiments). d Estimated copy numbers/cell of cyclin-dependent kinase 6(CDK6) ± 24h 100 ng/mL IL-15/Rα stimulation (n = 4 biologically independent samples), exact p-values are provided in Supplementary Data 3. e Heatmap for proteins involved in G1 to S phase transition of the cell cycle. Heatmap squares are corresponding log2 fold-change in copy number expression (IL-15-treated vs unstimulated) for each IEL subset. Asterisks depict significantly changed proteins (p < 0.05) identified in the pathway analysis, exact p-values can be found in Supplementary Data 2. f IEL were stimulated with either 10 ng/mL or 100 ng/mL IL-15/Rα for 48 h. Cells were stained for IEL subsets (gating strategy shown in Supplementary Fig. 6a) and DNA synthesis was assessed by incorporation of Ethynyl-deoxyuridine (EdU) (representative of n = 2 biologically independent samples). All error bars are mean ± s.e.m. For all proteomic data (b, d, e), statistical significance was derived from two-tailed empirical Bayes moderated t-statistics performed in limma on total proteome, see Supplementary Data 3.
Fig. 3
Fig. 3. IL-15/Rα increases IEL protein synthesis, nutrient uptake and growth.
a Dot plots (representative of n = 3 independent experiments) show the forward scatter (FSC, indicator of cell size) vs side scatter (SSC, indicator of granularity) of live IEL over 96 h culture in either 2 ng/mL or 100 ng/mL IL-15/Rα. b Heatmap for proteins pertaining to the pre-90S ribosome. Heatmap squares are corresponding log2 fold-change in copy number expression (IL-15-treated vs unstimulated) for each IEL subset. Asterisks depict significantly changed proteins (p < 0.05) identified in the pathway analysis, exact p-values can be found in Supplementary Data 2. c Bar graph shows the protein content (pg/cell) of the sum of ribosomal proteins (GO:0005840) identified in all IEL subsets ± 24 h IL-15/Rα stimulation (n = 4 biologically independent samples). Statistical significance was derived from two-way ANOVA with Sidak’s multiple comparisons test. d OPP incorporation in IEL (n = 3 biologically independent experiments) cultured with 10 ng/mL or 100 ng/mL IL-15/Rα for 48 h. As a negative control, incorporation was inhibited by cycloheximide (CHX) pre-treatment in IEL cultured with 100 ng/mL IL-15/Rα. Histograms show OPP incorporation in CHX-treated IEL (grey filled), IEL treated with 10 ng/mL IL-15/Rα (black) and IEL treated with 100 ng/mL IL-15/Rα (blue). Bar graph shows the geometric mean fluorescence intensity (GEO MFI) of OPP in each IEL subset (gating strategy shown in Supplementary Fig. 6b), statistical significance was derived from two-way ANOVA with Sidak’s multiple comparisons test. e Dot plot shows the log2 fold-change of nutrient transporters significantly (p < 0.05) differentially expressed in the proteomic dataset. f Flow cytometric analyses of CD98 and CD71 expression from IEL cultured for 72 h in either 2 ng/mL or 100 ng/mL IL-15/Rα (gating strategy as in Supplementary Fig. 1a). Data is presented as mean fluorescence intensity (MFI) (n = 3 biologically independent experiments), statistical significance was derived from two-way ANOVA with Sidak’s multiple comparisons test. All error bars are mean ± s.e.m. For all proteomic data (b, e), statistical significance was derived from two-tailed empirical Bayes moderated t-statistics performed in limma on total proteome, see Supplementary Data 3.
Fig. 4
Fig. 4. IL-15/Rα stimulation increases mitochondrial respiration in IEL.
a Estimated protein copy number/cell of the glucose transporters, GLUT1 and GLUT3, for all IEL subsets ± 24 h IL-15/Rα stimulation (n = 4 biologically independent experiments). b Bar graph shows the glucose levels remaining in the medium of IEL cultures in the presence of either 10 ng/mL or 100 ng/mL IL-15/Rα for 72 h. Levels of glucose remaining in the medium were assessed by bioluminescence assay, data are presented as relative light units (RLU). The dotted line depicts the signal from the control wells containing only medium but no cells (n = 3 biologically independent experiments). c Estimated protein copy number/cell of the lactate transporters MCT1 and MCT3 and the glycolytic enzyme hexokinase 2 (HK2). Data is shown for all IEL subsets ± 24 h IL-15/Rα stimulation (n = 4 biologically independent samples), exact p-values can be found in Supplementary Data 3. d Lactate output from IEL cultured as in b (n = 3 biologically independent experiments). e Mitochondrial respiration measurements in IEL cultured in 10 ng/mL100 ng/mL IL-15/Rα for 44 h (n = 3 biologically independent samples). Oxygen consumption is expressed as pmol O2 • s−1 • million cells−1. Respiratory rates were measured in cells (BASAL), then the cells were permeabilized with 10 μg/mL Digitonin, and mitochondrial respiratory rates measured after the subsequent addition of glutamate and malate (GML), ADP to stimulate respiration (GMP) along with succinate to stimulate complex II (GMSP), uncoupler (CCCP) to measure maximal electron transport (GMSE), rotenone to block complex I (SE) and Antimycin A to inhibit complex III. The residual oxygen consumption after rotenone and Antimycin A treatment was subtracted from all values shown here. OXPHOS oxidative phosphorylation, ETC electron transfer system capacity. All error bars are mean ± s.e.m. For all proteomic data (a, c), statistical significance was derived from two-tailed empirical Bayes moderated t-statistics performed in limma on total proteome, see Supplementary Data 3. All other data (b, d, e) were analysed by two-way ANOVA with Sidak’s multiple comparisons test.
Fig. 5
Fig. 5. IL-15 potentiates IEL cytotoxicity.
a Estimated protein copy number/cell of cytotoxic molecules granzyme A (GzmA), granzyme B (GzmB), Perforin, Munc13-4, STXBP2 and RAB27A. Data are shown for all IEL subsets ± 24 h IL-15/Rα stimulation (n = 4 biologically independent samples), statistical significance was derived from two-tailed empirical Bayes moderated t-statistics performed in limma on total proteome, see Supplementary Data 3. b Flow cytometric analyses of intracellular GzmA and GzmB in freshly isolated IEL compared to those cultured with 100 ng/mL IL-15/Rα for 24 h. Data are presented as mean fluorescence intensity (MFI) and percentage positive cells for GzmB (gating strategy shown in Supplementary Fig. 6c), (n = 3 biologically independent experiments), analysed by two-way ANOVA with Sidak’s multiple comparisons test. c Luciferase-transduced K562 cells were co-cultured for 24 h with freshly isolated IEL at an effector to target (E:T) ratio of 40:1. Cells were treated with either 10 ng/mL or 100 ng/mL IL-15/Rα (±aCD3). d Luciferase-transduced K562 cells were co-cultured for 24 h with freshly isolated IEL or WT and GzmA/B dKO IEL that had been pre-treated with 100 ng/mL IL-15/Rα (±aCD3) for 72 h, at an E:T ratio of 40:1. c, d Bar graphs represent the percentage of specific lysis for each condition, (n = 3 biologically independent experiments) data were analysed by one-way ANOVA, with Sidak’s multiple comparisons test. All error bars are mean ± s.e.m.
Fig. 6
Fig. 6. Activating and inhibitory receptor expression in response to IL-15/Rα stimulation.
Estimated protein copy number/cell of a NKG2D and b CD94, with corresponding flow cytometric analyses on either ex vivo vs 24 h IL-15-stimulated IEL (top left panels) or IEL that had been cultured in 2 ng/mL or 100 ng/mL IL-15/Rα for 72 h (bottom left panels). Flow cytometry data (n = 3 biologically independent experiments) are presented as percentage positive cells following gating on IEL subsets (gating strategy as in Supplementary Fig. 1a). c Row normalized heatmap showing the expression profile of a manually curated list of surface receptors identified in the proteomics across IEL subsets. Grey squares indicate undetectable expression. d, e IEL were cultured in 2 ng/mL or 100 ng/mL IL-15/Rα for 72 h and assessed for their expression of various surface receptors identified in the heatmap. Flow cytometric data are shown as mean fluorescence intensity (MFI) for d activating receptors; JAML, CD100 and DNAM-1, and e inhibitory receptors; LILRB4, LAG3 and CD96. Gating strategy as in Supplementary Fig. 1a (n = 3 biologically independent experiments, except for LILRB4 (n = 2 biologically independent experiments). All error bars are mean ± s.e.m. For all proteomic data (top right panels a, b), statistical significance was derived from two-tailed empirical Bayes moderated t-statistics performed in limma on total proteome, see Supplementary Data 3. All flow cytometry data (a, b, d, e) were analysed by two-way ANOVA with Sidak’s multiple comparisons test.
Fig. 7
Fig. 7. PIM kinases regulate IEL responses to strong IL-15/Rα stimulation.
a Estimated copy number/cell of PIM1 and PIM2 kinases in IEL ± 24 h IL-15/Rα stimulation (n = 4 biologically independent experiments), statistical significance was derived from two-tailed empirical Bayes moderated t-statistics performed in limma on total proteome, see Supplementary Data 3. b Immunoblot data (representative of n = 3 biologically independent experiments) showing PIM1 (right) and PIM2 (left) expression in ex vivo IEL or 24 h IL-15-stimulated IEL. Antibodies against GAPDH were used as a loading control. c Bar graphs show the absolute cell counts (left; n = 6 biologically independent experiments) and subset composition (right; n = 3 biologically independent experiments) of IEL isolated from WT (red) and PIM1−/−/PIM2−/Y (PIM1/2 dKO) (grey) mice (gating strategy shown in Supplementary Fig. 6c). d The percentage of live IEL from either WT or PIM1/2 dKO mice that were cultured in 2 ng/mL IL-15/Rα for 96 h (n = 3 biologically independent experiments). Percentages were calculated from the number of live cells following IL-15/Rα treatment divided by the number of cells seeded for culture (1 million/mL) every 24 h. e Line graph shows the cell numbers of IEL from either WT or PIM1/2 dKO mice that were cultured in 100 ng/mL IL-15/Rα for 96 h (n = 3 biologically independent experiments). f IEL were isolated from WT and PIM1/2 dKO mice and stained with CellTrace CFSE prior to stimulation with 100 ng/mL IL-15/Rα for 4 days. Every 24 h cells were stained for subsets and CFSE expression was analysed by flow cytometry (gating strategy as in Supplementary Fig. 1a). The discrete peaks in the histograms represent successive generations of live, DAPI-negative IEL (n = 3 biologically independent experiments). g Dot plots (representative of n = 3 biologically independent experiments) show the forward scatter (FSC) vs side scatter (SSC) of live IEL ex vivo as compared to IEL cultured in 100 ng/mL IL-15/Rα for 72 h from both WT (top) and PIM1/2 dKO (bottom) mice. IEL that were h derived ex vivo and i cultured in 100 ng/mL IL-15/Rα from both WT and PIM1/2 dKO mice were stained for intracellular GzmB expression (gating strategy as in Supplementary Fig. 1a), presented as mean fluorescence intensity (MFI) normalized to h WT controls or i cells cultured in 2 ng/mL IL-15/Rα (n = 3 biologically independent experiments). j Representative images of normal duodenal (n = 8) or duodenal biopsies with histological features of coeliac disease (n = 8) stained with anti-PIM1 and anti-CD3 antibodies (scale bar = 100 µm). I and II (top panels) show a biopsy of normal control duodenum and III and IV (bottom panels) show features consistent with coeliac disease. Boxplot demonstrates semi-quantitative assessment of PIM1 immunohistochemical staining intensity from biopsies, whiskers are minima to maxima with all points shown. All error bars are mean ± s.e.m. For (c, right panel) a two-tailed unpaired t-test with Sidak’s multiple comparisons test and j two-tailed Mann–Whitney test was used to derive statistical significance. (c, left panel), d, h, i were analysed by two-way ANOVA with Sidak’s multiple comparisons test.

References

    1. Hayday A, Theodoridis E, Ramsburg E, Shires J. Intraepithelial lymphocytes: exploring the Third Way in immunology. Nat. Immunol. 2001;2:997–1003. doi: 10.1038/ni1101-997. - DOI - PubMed
    1. Mayassi, T. & Jabri, B. Human intraepithelial lymphocytes. Mucosal Immunol. 11, 1281–1289 (2018). - PMC - PubMed
    1. Jabri B, Abadie V. IL-15 functions as a danger signal to regulate tissue-resident T cells and tissue destruction. Nat. Rev. Immunol. 2015;15:771–783. doi: 10.1038/nri3919. - DOI - PMC - PubMed
    1. Ma LJ, Acero LF, Zal T, Schluns KS. Trans-presentation of IL-15 by intestinal epithelial cells drives development of CD8αα IELs. J. Immunol. 2009;183:1044 LP–1041054. doi: 10.4049/jimmunol.0900420. - DOI - PMC - PubMed
    1. Mishra A, Sullivan L, Caligiuri M. Molecular pathways: interleukin-15 signaling in health and in cancer. Clin. Cancer Res. 2014;20:2044–2050. doi: 10.1158/1078-0432.CCR-12-3603. - DOI - PMC - PubMed

Publication types

MeSH terms