. 2021 Aug;23(8):846-858.
doi: 10.1038/s41556-021-00706-w. Epub 2021 Jul 12.

ATG9A protects the plasma membrane from programmed and incidental permeabilization

Affiliations

ATG9A protects the plasma membrane from programmed and incidental permeabilization

Aurore Claude-Taupin et al. Nat Cell Biol. 2021 Aug.

Abstract

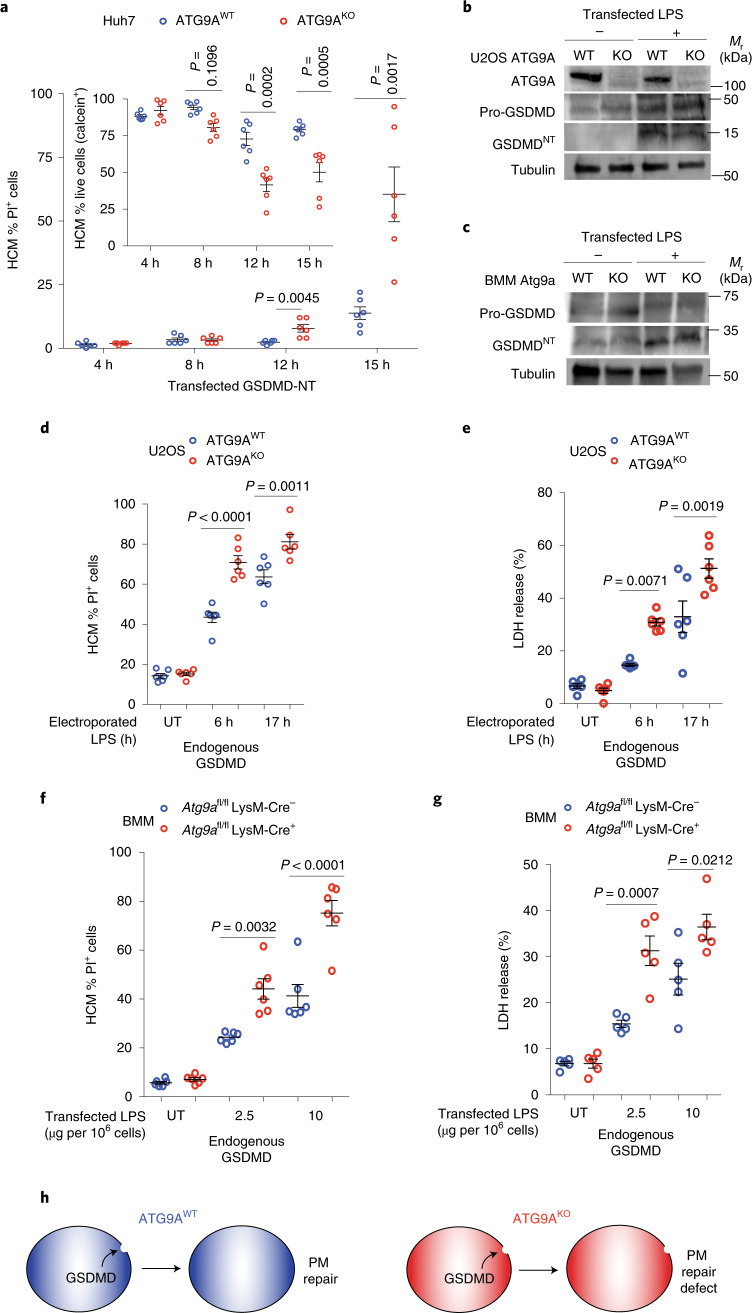
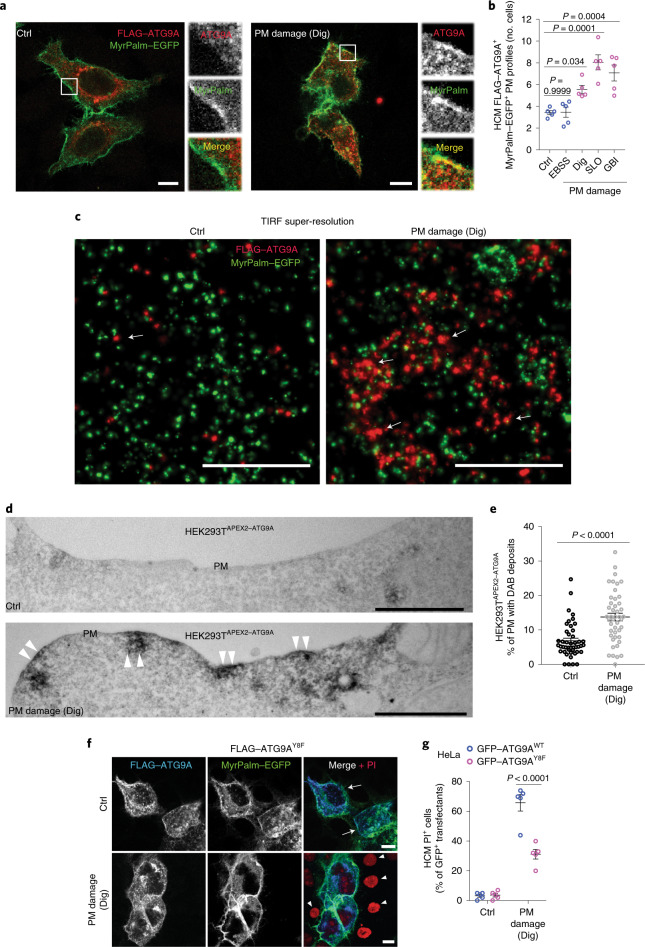
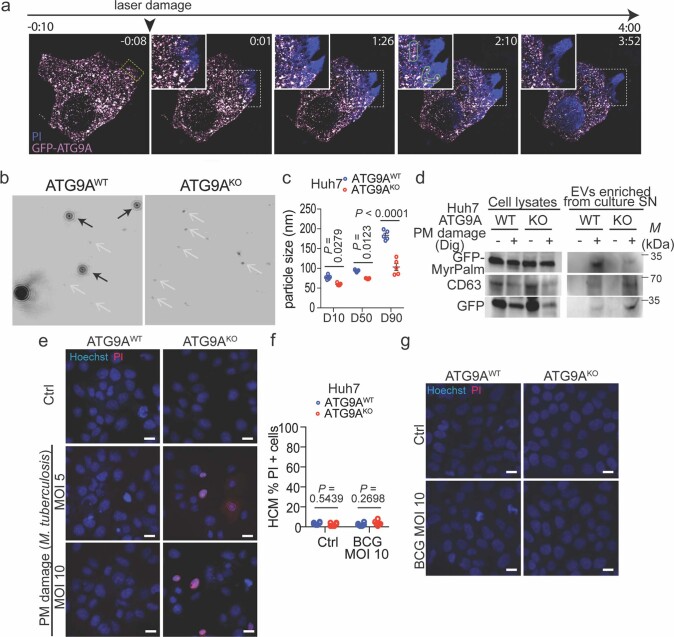
The integral membrane protein ATG9A plays a key role in autophagy. It displays a broad intracellular distribution and is present in numerous compartments, including the plasma membrane (PM). The reasons for the distribution of ATG9A to the PM and its role at the PM are not understood. Here, we show that ATG9A organizes, in concert with IQGAP1, components of the ESCRT system and uncover cooperation between ATG9A, IQGAP1 and ESCRTs in protection from PM damage. ESCRTs and ATG9A phenocopied each other in protection against PM injury. ATG9A knockouts sensitized the PM to permeabilization by a broad spectrum of microbial and endogenous agents, including gasdermin, MLKL and the MLKL-like action of coronavirus ORF3a. Thus, ATG9A engages IQGAP1 and the ESCRT system to maintain PM integrity.


Conflict of interest statement

The authors declare no competing interests.

Figures

Fig. 1
Fig. 1. ATG9A protects cells against PM damage.
a, Schematic of PM permeabilization/damage quantification by HCM and PI+ (nuclei) staining. b, Immunoblot of ATG9AHuh7-KO cells. Image is representative of three independent experiments. c,d, Image examples (white masks, algorithm-defined cell boundaries; yellow masks, computer-identified PI+ nuclei) (c) and HCM quantification (d) of PM permeabilization (by saponin (Sap), digitonin (Dig) or SLO) in ATG9AHuh7-WT and ATG9AHuh7-KO cells. Data show the percentage of cells positive for PI (mean ± s.e.m.; n = 5 biologically independent samples, two-way ANOVA Sidak’s test). Ctrl, control. Scale bars, 10 µm. e, Schematic of the PMHAL assay, which uses a HT probe for quantification of PM permeabilization/damage by HCM. MIL staining is scored, while MPL staining is used as a control for the HT probe. f, PMHAL images (confocal) of ATG9AHuh7-WT and ATG9AHuh7-KO cells showing HT MPL and MIL staining with or without PM damage (Dig). Scale bars, 10 µm. g, PMHAL assay and HCM quantification (GFP+MIL+ puncta intensity) of PM permeabilization in ATG9AHuh7-WT and ATG9AHuh7-KO cells subjected to PM damage. Data shown as the mean ± s.e.m.; n = 5 biologically independent samples, two-way ANOVA Sidak’s test. h, HCM quantification of PM permeabilization (PI, Dig) of ATG9AHuh7-WT and ATG9AHuh7-KO cells washed with 5 mM EGTA and incubated in a Ca2+-free HBSS medium with (+) or without (–) added 3.6 mM Ca2+. Data show the percentage of cells positive for PI (mean ± s.e.m.; n = 5 biologically independent samples, two-way ANOVA Sidak’s test). i, Schematic of how ATG9A protects cells against PM damage. Source data
Fig. 2
Fig. 2. ATG9A protects the PM from gasdermin pores.
a, HCM quantification of PM permeabilization (PI staining) and cell viability (Live/Dead, calcein+ cells) of ATG9AHuh7-WT and ATG9AHuh7-KO cells transfected with FLAG–GSDMD-NT. Data show the percentage of FLAG+ cells that were PI+ or calcein+ (inset). Data shown as the mean ± s.e.m.; n = 6 biologically independent samples, unpaired t-test. b, Immunoblot analysis of ATG9AU2OS-KO cells and endogenous GSDMD cleavage (GSDMDNT). c, Immunoblot analysis of endogenous GSDMD cleavage (GSDMDNT) in BMMs from Atg9afl/fl LysM-Cre and Atg9afl/fl LysM-Cre+ mice. d, HCM quantification of PM permeabilization (PI staining) of ATG9AU2OS-WT and ATG9AU2OS-KO cells electroporated with LPS to induce endogenous GSDMD cleavage. Data shown as the mean ± s.e.m.; n = 6 biologically independent samples, one-way ANOVA Tukey’s test. UT, untreated. e, Cell death analysis of supernatants of ATG9AU2OS-WT and ATG9AU2OS-KO cells electroporated with LPS. Data show the percentage of LDH release (mean ± s.e.m.; n = 6 biologically independent samples, one-way ANOVA Tukey’s test). f, HCM quantification of PM permeabilization (PI staining) of Atg9afl/fl LysMCre and Cre+ BMMs transfected with LPS to induce endogenous GSDMD cleavage. Data shown as the mean ± s.e.m.; n = 6 biologically independent samples, one-way ANOVA Tukey’s test. g, Cell death analysis of supernatants of Atg9aKO (LysMCre+) and Atg9aWT (LysMCre) BMMs after LPS priming and transfection. Data shown the percentage of LDH release (mean ± s.e.m.; n = 6 biologically independent samples, one-way ANOVA Tukey’s test). h, Schematic of how ATG9A protects cells against PM damage. Source data
Fig. 3
Fig. 3. ATG9A translocates to the PM following its damage.
a, ATG9A localization in HeLa cells expressing FLAG–ATG9A and MyrPalm–EGFP untreated control (Ctrl) or treated with Dig. Scale bars, 10 µm. b, HCM analysis of FLAG–ATG9A and MyrPalm–EGFP colocalization in HeLa cells, after starvation (EBSS) or PM damage with Dig, SLO or by GBI. Data show the mean ± s.e.m.; n = 5 biologically independent samples, one-way ANOVA Dunnett’s test. c, Super-resolution TIRF microscopy analysis of FLAG–ATG9A and MyrPalm–EGFP (HeLa). Scale bars, 1 µm. Arrows indicate ATG9A fluorescence at the plasma membrane. d, Stable HEK293TAPEX2–ATG9A cells were exposed (Dig) or not (Ctrl) to PM damage. White arrowheads indicate PM areas showing deposits of DAB (APEX2 activity product) with or without adjacent DAB-positive vesicles. Scale bars, 1 µm. e, Quantification of the percentage of PM with DAB deposits (APEX2–ATG9A) in untreated (Ctrl) and Dig-treated HEK293TAPEX2–ATG9A cells. Data shown as the mean ± s.e.m.; n = 45 random PM profiles, unpaired t-test. f, Images of PM permeabilization (PI; red) in HeLa cells expressing MyrPalm–EGFP (green) and FLAG–ATG9AY8F (blue). White arrows and arrowheads indicate FLAG–ATG9AY8F transfected and untransfected cells, respectively. Scale bars, 10 µm. g, HCM quantification of PM permeabilization (PI) in HeLa cells expressing GFP–ATG9AWT or GFP–ATG9AY8F. Data shown as the mean ± s.e.m.; n = 5 biologically independent samples, two-way ANOVA Sidak’s test. Source data
Fig. 4
Fig. 4. IQGAP1 partners with ATG9A to protect cells against PM damage.
a, Volcano plot of ATG9A partners and changes in their proximity during PM damage (Dig, HEK293TAPEX2–ATG9A). The x axis shows the log2(fold change) (Dig/Ctrl ratio; spectral counts), the y axis shows −log10(P values); t-test (n = 3 biological replicates per group). Green and red dots indicate increase and decrease in proximity to ATG9A after Dig treatment, respectively. Orange dots indicate values below the statistical significance cut-off (P ≥ 0.05). IQGAP1 and adaptor proteins are highlighted as purple circles. Bubble size represents a normalized value for the total amount of spectral counts for the protein indicated. b, Co-IP (anti-FLAG) analysis of FLAG–ATG9A and GFP–IQGAP1 (HEK293T) with or without PM damage (Dig, SLO or GBI). One of three independent experiments shown. c, GST pulldown analysis using radiolabelled [35S]Myc–IQGAP1 and GST–ATG9A1–584. Images are representative of three biologically independent experiments. Data in the graph shown the mean ± s.e.m.; n = 3 independent experiments, unpaired t-test. CBB, Coomassie Brilliant Blue. AR, autoradiograph. d, HCM quantification of PM permeabilization (PI, HeLa IQGAP1 knockdown). si Scr, scrambled siRNA. Data shown as the mean ± s.e.m.; n = 5 biologically independent samples, two-way ANOVA Sidak’s test. e, Schematic summary of the findings in this figure. Source data
Fig. 5
Fig. 5. ATG9A interacts with ESCRTs.
a, Co-IP analysis (anti-FLAG) of GFP–ATG9A and FLAG–TSG101 interactions during PM damage (Dig). One of three independent experiments shown. b, Schematic of the BioWeB assay (HEK293TAPEX2–ATG9A tetracycline (Tet)-inducible cells) for capture, elution and detection by immunoblotting of endogenous proteins that are proximal to APEX2–ATG9A in different conditions. c, BioWeB analysis of changes in TSG101 proximity to APEX2–ATG9A during PM damage (Dig, SLO, GBI, HEK293TAPEX2–ATG9A). d, Quantification of the ratios of eluted TSG101 band intensities versus TSG101 in the input relative to c (mean ± s.e.m.; n = 4 biologically independent experiments, unpaired t-test). e, Co-IP analysis (anti-GFP) of FLAG–CHMP4A and GFP–ATG9A interactions during PM damage (Dig, HEK293T). One of three independent experiments shown. f, Co-IP analysis (anti-GFP) of interactions between Myc–CHMP4B and GFP–ATG9A during PM damage (Dig, HEK293T). Asterisk indicates a nonspecific band. One of three independent experiments shown. g,h, Quantification of TIRF microscopy images of mCherry–CHMP4B recruitment to PM (MyrPalm–EGFP) during PM damage (Dig) in ATG9AHuh7-WT cells pretreated with NEM or NEM + DTT. CHMP4B total fluorescence intensity (g) and CHMP4B puncta number in the TIRF field (h). Data shown as the mean ± s.e.m.; n = 5 independent images, unpaired t-test. ik, TIRF microscopy images (i) and quantification (j,k) of mCherry–CHMP4B (red) recruitment to PM (MyrPalm–EGFP, green) following damage (Dig) in ATG9AHuh7-WT and ATG9AHuh7-KO cells. Scale bars, 5 µm. Data of CHMP4B total fluorescence intensity (j) and CHMP4B puncta number in the TIRF field (k) shown as the mean ± s.e.m.; n = 5 biologically independent samples, unpaired t-test. l, HCM quantification of mCherry–CHMP4B overlap with PM (MyrPalm–EGFP) in cells washed with 5 mM EGTA and incubated in a Ca2+-free HBSS medium with (+) or without (−) added 3.6 mM Ca2+ during PM damage (Dig). Data show the overlap area between CHMP4B and MyrPalm (mean ± s.e.m.; n = 4 biologically independent samples, one-way ANOVA Tukey’s test). Source data
Fig. 6
Fig. 6. ESCRTs and ATG9A cooperate in protection against PM damage.
a, Confirmation by immunoblotting of ALIX and TSG101 knockdown as well as CRISPR–Cas9 KO of ALIX in HeLa cells. One of three independent experiments shown. b, Example of HCM images of PM permeabilization (PI, Dig) in HeLa cells after knockdown of ALIX, TSG101, ALIX + TSG101 or CRISPR–Cas9 KO of ALIX (white masks, algorithm-defined cell boundaries; red masks, computer-identified PI+ nuclei). Scale bars, 10 µm. c, HCM quantification of PM permeabilization (PI, Dig, HeLa) after knockdown of ALIX, TSG101, ALIX + TSG101 or in ALIX CRISPR knockout (ALIXKO) and ALIXWT HeLa cells. Data shown as the mean ± s.e.m.; n = 6 biologically independent samples, one-way ANOVA Tukey’s test. d, Confirmation by immunoblotting of CHMP2A knockdown in ATG9AHuh7-WT and ATG9AHuh7-KO cells (one of three independent experiments shown). e, Example HCM images of PM permeabilization (PI, Dig) in ATG9AHuh7-WT and ATG9AHuh7-KO cells after knockdown of CHMP2A (white masks, algorithm-defined cell boundaries; red masks, computer-identified PI+ nuclei). Scale bars, 10 µm. f, HCM quantification of PM permeabilization (PI, Dig) in ATG9AHuh7-WT and ATG9AHuh7-KO cells after CHMP2A knockdown. Data shown as the mean ± s.e.m.; n = 6 biologically independent samples, unpaired t-test. g, HCM quantification of PM permeabilization (PI, FLAG–GSDMD-Full length (FL) or -NT fragment transfection) in ATG9AHuh7-WT and ATG9AHuh7-KO cells after CHMP2A knockdown. Data show the percentage of FLAG+ cells that were PI+ (mean ± s.e.m.; n = 6 biologically independent samples, unpaired t-test). h, GST pulldown analysis of in vitro translated and radiolabelled [35S]Myc–IQGAP1 with GST, GST–CHMP2A and GST–CHMP4B fusions. i, Quantification of the binding percentage of IQGAP1 relative to the GST constructs in h. Data shown as the mean ± s.e.m.; n = 3 biologically independent experiments, unpaired t-test. j, Schematic summary of findings presented in Fig. 5 and this figure. Source data
Fig. 7
Fig. 7. ATG9A protects against PM damage in diverse biological contexts.
a, Nanoparticle tracking analysis. Concentration (y axis) and size distribution (x axis) of enriched EVs in supernatants after PM (Dig) from ATG9AHuh7-WT (Ctrl: blue; Dig: green) and ATG9AHuh7-KO (Ctrl: pink; Dig: red) cells. One of three independent experiments shown. b, Percentage of particles in the 10–88-nm bin (G1 in a) and the 89–350-nm bin (G2 in a) after PM damage (Dig). Data show nanoparticle sizing (>800 frames per sample), n = 3 biologically independent experiments; mean ± s.e.m.; two-way ANOVA Sidak’s test. c, HCM quantification of PM permeabilization (PI) in ATG9AHuh7-WT and ATG9AHuh7-KO cells expressing Hras25 PM-targeted MLKL–Venus (PM) or non-targeted MLKL–Venus (NT). Data show the percentage of Venus+ cells positive for PI (mean ± s.e.m., n = 5 biologically independent samples, two-way ANOVA Sidak’s test). d, HCM quantification of PM permeabilization (PI) in ATG9AHuh7-WT and ATG9AHuh7-KO cells expressing SARS-CoV-2 FLAG–ORF3a (FLAG–ORF3aCov-2). Data show the percentage of cells positive for PI (mean ± s.e.m., n = 6 biologically independent samples, two-way ANOVA Tukey’s test). e, HCM complementation analysis of PM sensitivity to permeabilization by SARS-CoV-2 ORF3a in ATG9AHuh7-KO cells co-transfected with SARS-CoV-2 GFP–ORF3a and ATG9A–FLAG (WT or M33 scramblase mutant). PI+ cells quantified after gating on GFP+ cells (HCM, mean ± s.e.m., n = 6 biologically independent samples, one-way ANOVA Tukey’s test). f, HCM quantification of PM permeabilization (PI) in ATG9AHuh7-WT and ATG9AHuh7-KO cells exposed to virulent Mtb Erdman at m.o.i. of 0 (Ctrl), 5 or 10 for 1 h. Data show the percentage of cells positive for PI (mean ± s.e.m., n = 6 biologically independent samples, two-way ANOVA Sidak’s test). g, Overall schematic summary. Following PM damage, ATG9A (recruited by Ca2+ influx and IQGAP1) organizes the ESCRT machinery at the site of injury where ESCRT-III effectors (CHMP4A/B and CHMP2A) remodel membranes to bud EVs carrying away the PM pore/damaged area. Source data
Extended Data Fig. 1
Extended Data Fig. 1. ATG9A protects different cell lines against plasma membrane damage.
a, HCM image examples (white masks, algorithm-defined cell boundaries; yellow masks, computer-identified PI+ nuclei) of PM permeabilization (saponin (Sap) and streptolysin O (SLO)) in ATG9AHuh7-WT and ATG9AHuh7-KO cells. Scale bars, 10 µm. b,c, HCM complementation analysis of PM permeabilization sensitivity (Dig) in ATG9AHuh7-KO transfected with b, GFP or GFP-ATG9A or c, FLAG-ATG9A increasing concentrations. PI+ cells quantified after gating on GFP+ or FLAG+ cells (HCM, mean± SEM, n=5 (b), n=6 (c) biologically independent samples, two-way ANOVA Sidak’s test (b) or unpaired t test (c). d, Example of HCM images of ATG9AHuh7-WT and ATG9AHuh7-KO cells. PMHAL assay (Dig). Yellow masks, computer-identified GFP-MIL+ puncta. Scale bars, 10 µm. e,f, HCM PMHAL analysis of ATG9AHuh7-WT and ATG9AHuh7-KO cells (Dig, MPL staining). e, Yellow masks, computer-identified GFP-MPL+ puncta. Scale bars, 10 µm. f, Graph, HCM PMHAL quantification of GFP-MPL+ puncta/cell (mean±SEM, n=5 biologically independent samples, two-way ANOVA Sidak’s test). g, HCM analysis of PM permeabilization (FITC-Dextran-10k - Dx-10) in ATG9AHuh7-WT and ATG9AHuh7-KO cells upon PM damage (Dig). Data, % of cells positive for Dx-10 (mean±SEM, n=5 biologically independent samples, two-way ANOVA Sidak’s test). h, HCM analysis of the endocytic pathway (DQ-Red BSA) in ATG9AHuh7-WT and ATG9AHuh7-KO cells upon PM damage (Dig). Data, number of DQ-Red BSA profiles/cell (mean±SEM, n=5 biologically independent samples, two-way ANOVA Sidak’s test). i, HCM quantification of the overlap area between GFP-Rab5 (WT or Q79L mutant) and LBPA in ATG9AHuh7-WT and ATG9AHuh7-KO cells. Data, mean±SEM; n=6 biologically independent samples, two-way ANOVA Sidak’s test. j, Confocal images of LBPA (red) in ATG9AHuh7-WT and ATG9AHuh7-KO cells transiently expressing GFP-Rab5 (WT or Q79L, green). Scale bars, 10 µm. k,l, Analysis of PM tension in ATG9AHuh7-WT and ATG9AHuh7-KO cells using the Flipper-TR® probe (Fluorescence lifetime microscopy, FLIM). k, Representative images of the average fluorescence lifetime of Flipper-TR®. Color scale from 2 to 6 ns. Scale bars, 10 µm. l, quantification of the average lifetime of Flipper-TR from full images (mean±SEM, n=5 independent images, unpaired t test). m, HCM analysis of calcein+ cells (Live/DeadTM 30 min staining prior to Dig treatment) in ATG9AHuh7-WT and ATG9AHuh7-KO cells (washed with 5 mM EGTA and incubated in a Ca2+-free HBSS medium with (+) or without (-) added 3.6 mM Ca2+). Data, % of cells positive for calcein (mean±SEM; n=5 biologically independent samples, two-way ANOVA Sidak’s test). n, Immunoblotting of the ATG9AMCF-7-KO cells (one of 3 independent experiments). o,p, HCM analysis of PM permeabilization (PI, Dig) of ATG9AMCF-7-WT and ATG9AMCF-7-KO cells. o, Example of HCM images: white masks, algorithm-defined cell boundaries; red masks, computer-identified PI+ nuclei. Scale bars, 10 µm. p, % of cells positive for PI (mean±SEM, n=5 biologically independent samples, two-way ANOVA Sidak’s test). q, HCM analysis of PM permeabilization (Dx-10, Dig) in ATG9AMCF-7-WT and ATG9AMCF-7-KO cells. Data, % of cells positive for Dx-10 (mean±SEM, n=5 biologically independent samples, two-way ANOVA Sidak’s test). r, HCM analysis of the endocytic pathway (DQ-Red BSA, Dig) in ATG9AMCF-7-WT and ATG9AMCF-7-KO cells. Data, quantification of DQ-Red BSA profiles/cell (mean±SEM, n=5 biologically independent samples, two-way ANOVA Sidak’s test). s, Confirmation by immunoblotting of ATG9A KD in HeLa cells (one of 3 independent experiments). t,u, HCM analysis of PM permeabilization (PI, Dig). t, example of HCM images: white masks, algorithm-defined cell boundaries; red masks, computer-identified PI+ nuclei. Scale bars, 10 µm. u, % of cells positive for PI (mean±SEM, n=5 biologically independent samples, two-way ANOVA Sidak’s test). Source data
Extended Data Fig. 2
Extended Data Fig. 2. ATG9A protects primary cells against plasma membrane damage.
a, Confirmation by immunoblotting of the Atg9aKO (LysMCre+) in BMM. One of 3 independent experiement. b, HCM analysis of PM permeabilization (Dx-10, Dig) in BMM from Atg9afl/flLysM-Cre- and Atg9afl/flLysM-Cre+ mice. Data, % of cells positive for Dx-10 (mean±SEM, n=5 biologically independent samples, two-way ANOVA Sidak’s test). c, HCM analysis of the endocytic pathway (DQ-Red BSA, Dig) in BMM from Atg9afl/flLysM-Cre- and Atg9afl/flLysM-Cre+ mice. Data, Quantification of DQ-Red BSA profiles/cell (mean±SEM; n=5 biologically independent samples, two-way ANOVA Sidak’s test). d, HCM analysis of PM permeabilization (Alexa Fluor 647-Dextran-10k -AF647 Dx-10, SLO) in BMM from Atg9afl/flLysM-Cre- and Atg9afl/flLysM-Cre+ mice. Data, % of cells positive for Dx-10 (mean±SEM, n=6 biologically independent samples, two-way ANOVA Sidak’s test). e, HCM quantification of PM permeabilization (PI staining) and cell viability (Live/DeadTM, Calcein+ cells) of ATG9AHuh7-WT and ATG9AHuh7-KO cells transfected with FLAG-GSDMD-N-terminal fragment (NT). Data, % of FLAG-positive cells that were double positive for PI and Calcein. Data, mean±SEM; n=6 biologically independent samples, unpaired t test. Source data
Extended Data Fig. 3
Extended Data Fig. 3. Plasma membrane damage induces ATG9A translocation to PM.
a, Confocal images of FLAG-ATG9A (red) localization to PM (MyrPalm-EGFP, green) during its damage (SLO, GBI or Sap) in HeLa cells. Scale bars, 10 µm. b, Quantification (super resolution TIRF) of the distance between FLAG-ATG9A and MyrPalm-EGFP clusters before and after PM damage (Dig). c, Cell surface biotinylation analysis of ATG9A in HEK293T cells transiently expressing GFP-ATG9A (Starvation, EBSS or PM damage: Dig, SLO or GBI). GFP-ATG9A (IP anti GFP) analyzed by Streptavidin-HRP immunoblotting. One of 3 biologically independent experiments. d, TIRF microscopy images of FLAG-ATG9A (red) recruitment to PM (MyrPalm-EGFP, green) upon Dig in cells pretreated with NEM or DTT, as indicated. Scale bars, 5 µm. e,f, Quantification of ATG9A recruitment to PM in TIRF field upon Dig and/or NEM treatment. e, FLAG-ATG9A fluorescence intensity and f, ratio of FLAG-ATG9A puncta intensity with fluorescence intensity in TIRF field. Data, mean±SEM; n=10 biologically independent cells, unpaired t test. g, HCM analysis of PM permeabilization (PI, Dig) in ATG9AHuh7-WT and ATG9AHuh7-KO cells pre-treated with NEM or DTT as indicated. Data, % of cells positive for PI (mean±SEM, n=6 biologically independent samples, unpaired t test). h, Schematic of the stable cell line HEK293TAPEX2-ATG9A constructed in HEK293T Flp-In cells, expressing integrated FLAG-APEX2-ATG9A inducible by tetracycline. i-n, HEK293TAPEX2-ATG9A cells were exposed (j-n) or not (i) to Dig. i and j, overviews. k-n, magnification of areas showing deposits of diaminobenzidine (APEX2 activity product of APEX2-ATG9A) without or with adjacent diaminobenzidine-positive vesicles/tubulo-vesicular structures. E, endosome; N, Nucleus; PM, plasma membrane; white arrowheads highlight regions of the PM where APEX2-ATG9A is concentrated. Scale bars, 1 µm (i, j, n), 250 nm (Panels k-m). o, Schematic summary of the findings in Extended Data Figure 3. Source data
Extended Data Fig. 4
Extended Data Fig. 4. ATG9A translocation to plasma membrane protects cells from PM damage.
a, Examples of HCM images of HeLa cells expressing GFP-ATG9AWT or GFP-ATG9AY8F (green) subjected to PI staining (red) after Dig treatment. Red masks, computer-identified PI+ nuclei on GFP+ cells. Scale bars, 10 µm. b, Confocal images of ATG9A localization in HeLa cells expressing FLAG-ATG9A (red) and MyrPalm-EGFP (green), serum-starved for 24 h, and then stimulated with hEGF for 30 min. Non-starved cells: full media (FM) used as control. Scale bars, 10 µm. c, HCM quantification of PM permeabilization (PI, Dig) in HeLa cells expressing GFP-ATG9A, serum-starved and stimulated with hEGF. Data, % of GFP+ cells that are PI+ (mean±SEM; n=5 biologically independent samples, two-way ANOVA Sidak’s test). d, HCM analysis of PM permeabilization (PI, Dig) in ATG9AU2OS-WT and ATG9AU2OS-KO cells serum-starved for 24 h, and then stimulated with hEGF for 30 min. Non-starved cells: full media (FM) used as control. Data, % of cells positive for PI (mean±SEM, n=5 biologically independent samples, two-way ANOVA Tukey’s test). e, Schematic summary of the findings in Fig. 3f,g. f, Schematic summary of findings in Extended Data Figure 4b-d. Source data
Extended Data Fig. 5
Extended Data Fig. 5. ATG9A partners identified by dynamic proximity biotinylation proteomics.
a, Complementation analysis of LC3 lipidation in ATG9AHuh7-KO cells transfected with FLAG-APEX2-ATG9A. Autophagy was induced by starvation in EBSS (90 min) with or without Bafilomycin A1 (BAF). *, unspecific band (one of 3 independent experiments). b, Proximity biotinylation proteomics (process stages) for LC-MS/MS identification of APEX2-ATG9A partners and analysis of dynamic changes in their proximity during PM damage (Dig, SLO or GBI). c,d, Volcano plots, HEK293TAPEX2-ATG9A cells were incubated in full medium under control (Ctrl) or PM damage-inducing conditions SLO (c) or GBI (d). X-axis, log2 fold change (PM damage/Ctrl ratio; spectral counts); y-axis, -log10 of p-values, t-test (n=3 biologically independent samples per group). Green and red dots, increase and decrease in proximity to ATG9A after PM damage, respectively. Orange dots, values below statistical significance (for increase/decrease changes) cut-off (p ≥ 0.05). IQGAP1, RAB7A, and AP3D1 are highlighted in purple. Bubble size represents a normalized value for the total spectral counts (average of all samples) for the protein indicated. e,f, Protein species showing infinite positive (e) or negative (f) fold change in proteomic studies here, in all three conditions (Dig, SLO and GBI) tested with HEK293TAPEX2-ATG9A cells. Data, mean total peptide spectral counts (green, infinite positive-fold change group had 0 spectral counts in all 3 untreated samples; red, infinite negative-fold change group had 0 spectral counts in all 3 treated samples). IQGAP1 (e) and AP3D1 (f) are shown as non-infinite fold change comparators. Source data
Extended Data Fig. 6
Extended Data Fig. 6. IQGAP1 and calcium contribute to ATG9A’s role in protection against plasma membrane damage.
a, CoIP analysis of endogenous ATG9A (CST, HEK293T) with TSG101 and IQGAP1 after PM damage (Dig, SLO, GBI, one of 3 independent experiments). b, Confocal images of endogenous IQGAP1 (blue) in HeLa cells expressing MyrPalm-EGFP (green) and FLAG-ATG9A (red) during PM damage (Dig). Scale bars, 10 µm. c, HCM quantification of FLAG-ATG9A and GFP-IQGAP1 overlap area in HeLa cells after PM damage by digitonin (Dig). Data, Quantification of the overlap between FLAG-ATG9A and GFP-IQGAP1 profiles (mean±SEM; n=5 biologically independent samples, unpaired t-test). d, Aspect (top view) of ATG9A CryoEM structure (PDB:7JLP; Maeda et al., 2020), revealing adjacency of extramembranous domains at the cytosolic side of ATG9A. e, Modified schematic from Guardia et al., 2020, based on CryoEM ATG9A structure. Colored circles indicate beginnings and ends of regions used in GST-pulldowns in panel f and correspond in color to domains in d. f, GST-pulldown analysis of in vitro translated and radiolabeled [35S]Myc-IQGAP1 with GST and GST fused with ATG9A cytosolic domains (residues 1-66, 495-839, 522-839, 153-289 and 723-839). CBB: Coomassie brilliant blue. Graph, quantification of the binding percentage of IQGAP1 relative to GST constructs. Data, mean±SEM; n=3 biologically independent experiments, unpaired t-test g, Confirmation by immunoblotting of IQGAP1 KD in HeLa cells. One of 3 independent experiments. h, Confocal images of ATG9A localization after IQGAP1 KD during PM damage (Dig), in HeLa cells expressing MyrPalm-EGFP (green) and FLAG-ATG9A (red). Scale bars, 10 µm. i, HCM quantification of the overlap area between GFP-Rab5 (WT or Q79L mutant) and LBPA in Huh7 cells after IQGAP1 KD. Data, mean±SEM; n=4 biologically independent samples, two-way ANOVA Tukey’s test. j, Confocal images of LBPA (red) in Huh7 cells (IQGAP1 KD) transiently expressing GFP-Rab5 (WT or Q79L, green). Scale bars, 10 µm. k, Confocal images of ATG9A localization after PM damage (Dig), in the presence or absence of Ca2+. HeLa cells expressing FLAG-ATG9A (red) and MyrPalm-EGFP (green) were washed with 5 mM EGTA and incubated in a Ca2+-free HBSS medium with (+) or without (-) added 3.6 mM Ca2+ during PM damage. Scale bars, 10 µm. l, Examples of HCM images in HeLa cells expressing GFP-IQGAP1 (green) and FLAG-ATG9A (red) after PM damage (Dig, Ca2+ treatment/conditions as in k). Yellow masks, computer-identified FLAG-ATG9A+GFP-IQGAP1+ double positive profiles. Scale bars, 10 µm. m, HCM quantification of FLAG-ATG9A and GFP-IQGAP1 colocalization in HeLa cells (Dig, Ca2+ treatment/conditions as in k). Data, overlap area between FLAG-ATG9A and GFP-IQGAP1 (mean±SEM; n=3 biologically independent samples, unpaired t-test). n, CoIP (anti FLAG) analysis of FLAG-ATG9A and GFP-IQGAP1 interaction after PM damage (Dig) in the presence or absence of Ca2+ (HEK293T, Ca2+ treatment/conditions as in k, one of 3 independent experiments). Source data
Extended Data Fig. 7
Extended Data Fig. 7. ATG9A interacts with ALIX.
a, ALIX domains and constructs used in this study. FL, full length; Bro1, Bro1 domain; VD, V domain, PRD, proline-rich domain. Numbers, residue positions. b, CoIP analysis (anti-FLAG) of FLAG-ALIX deletion mutants with HA-ATG9A (HEK293T). One of 3 independent experiments. c, BioWeB analysis of ALIX proximity to APEX2-ATG9A (HEK293TAPEX2-ATG9A), with or without PM damage (Dig, SLO, GBI). One of 3 independent experiments. Source data
Extended Data Fig. 8
Extended Data Fig. 8. ESCRTs cooperate with ATG9A in protection against plasma membrane damage.
a, CoIP analysis of endogenous ATG9A (CST, HEK293T) with TSG101 after IQGAP1 KD and PM damage (Dig); one of 3 independent experiments. b, TIRF microscopy images of mCherry-CHMP4B (red) recruitment to PM (MyrPalm-EGFP, green) during PM damage (Dig), in ATG9AHuh7-WT cells pretreated with NEM or NEM+DTT. Scale bars, 5 µm. c, Confocal images of HeLa Flp-In mCherry-CHMP4A (red) and MyrPalm-EGFP (green) during PM damage (Dig) (washed with 5mM EGTA and incubated in a Ca2+-free HBSS medium with (+) or without (-) added 3.6 mM Ca2+). Arrows, cell periphery. Scale bars, 10 µm. d, Confocal images of mCherry-CHMP4B (red) and MyrPalm-EGFP (green) during PM damage (Dig) in ATG9AHuh7-WT and ATG9AHuh7-KO cells. Ca2+ treatment/conditions as in panel c. Scale bars, 10 µm. White arrows indicate CHMP4B puncta localizing to the PM (MyrPalm-EGFP). e, Confocal images of GFP-ATG9A (green) and mCherry-CHMP4B (red) in cells transiently transfected with FLAG-GSDMD-NT (PM damage) or -NT-4A as control. Scale bars, 10 µm. White arrows indicate GSDMD-NT localization at PM in proximity to ATG9A and CHMP4B. Source data
Extended Data Fig. 9
Extended Data Fig. 9. Analysis of additional ATG9A interactors and ATG9A M33 mutant in defense against PM damage.
a, Confirmation by immunoblotting of CRISPR-Cas9 in ATG2AU2OS-KO cells. One of 3 independent experiments. b, Confirmation by immunoblotting of CRISPR-Cas9 in ATG2BU2OS-KO cells. One of 3 independent experiments. c, Graph, HCM quantification of PM permeabilization (PI, Dig) in ATG2AU2OS-KO, ATG2BU2OS-KO and ATG9AU2OS-KO cells. Data, % of total cells that are PI+ cells (mean±SEM; n=3 biologically independent samples, two-way ANOVA Sidak’s test). d,e, HCM quantification of PM permeabilization (PI, d) and cell viability (LDH release in the supernatant, e) in ATG2AU2OS-KO, ATG2BU2OS-KO and ATG9AU2OS-KO cells after LPS electroporation. Data, % of total cells that are PI+ cells (d, HCM; e, % LDH release quantified, mean±SEM; n=6 biologically independent samples, unpaired t test). f, Confirmation by immunoblotting of PI4KB KD in HeLa cells (one of 3 independent experiments). g, Graph, HCM quantification of PM permeabilization (PI, Dig) in PI4KB KD cells. Data, % of total cells that are PI+ cells (mean±SEM; n=5 biologically independent samples, two-way ANOVA Sidak’s test). h, HCM complementation analysis of PM permeabilization sensitivity (Dig) in ATG9AHuh7-KO transfected with ATG9A-FLAG (WT or M33 scramblase mutant). PI+ cells quantified after gating on FLAG+ cells (HCM, mean± SEM, n=6 biologically independent samples, unpaired t test). i, Immunoblot confirmation of Rab7 KD in HeLa cells. One of 3 biologically independent experiments. j, HCM quantification of PM permeabilization (PI, Dig) in HeLa cells after Rab7 KD. Data, % of cells positive for PI (mean±SEM; n=6 biologically independent samples, two-way ANOVA Sidak’s test). k, CoIP (anti-GFP) analysis of FLAG-ATG9A and GFP-AP2M1 interaction during PM damage (Dig, HEK293T, one of 3 independent experiments). l, CoIP (anti-GFP) analysis of FLAG-ATG9A and GFP-AP4M1 interaction during PM damage (Dig, HEK293T, one of 3 independent experiments). m, Bimolecular fluorescence complementation assay schematic for analysis of ALIX and ATG9A association with split Venus fluorescent protein. ALIX and ATG9A were respectively fused with the N-terminal (VNALIX) and C-terminal (VCATG9A) fragments of Venus and expressed in HeLa cells. Venus fluorescence corresponding to ALIX and ATG9A association was then assessed by HCM and confocal microscopy. n, Confocal images of ATG9A and ALIX association using the bimolecular fluorescence complementation assay (VNALIX+VCATG9A=green) during PM damage (Dig). GM130 (Golgi staining, red). Scale bars, 10 µm. o, p, HCM quantification of (o) ATG9A and ALIX association and (p) their overlap with PM using the bimolecular fluorescence complementation assay, during PM damage (Dig). HeLa cells transiently expressing VNALIX and VCATG9A were labelled with cell outline/plasma membrane stain CellMask reagent. Data, HCM quantification of (o) Venus puncta and (p) the overlap area between Venus puncta and CellMask (mean±SEM; n=5 biologically independent samples, one-way ANOVA Dunnett’s test). q, HCM quantification of cytosolic PI staining in ATG9AHuh7-WT and ATG9AHuh7-KO cells without damage (mean±SEM; n=6 biologically independent samples, unpaired t test). Source data
Extended Data Fig. 10
Extended Data Fig. 10. Analyses of ATG9A-dependent processes during PM damage.
a, Time-lapse confocal images of GFP-ATG9A (magenta hot) and propidium iodide (blue) upon laser-induced PM damage (ROI, yellow rectangle). Insets, ATG9A distribution at site of PM damage. Green ROI (2’10”) indicate organization of GFP-ATG9A bordering with damaged areas. Scale bar, 10 µm. b, Example images (Dig) obtained from videos during nanoparticle tracking analysis. c, Particle distribution (“D”-values) in the supernatant of ATG9AHuh7-WT and ATG9AHuh7-KO cells (Dig). D10, D50 and D90 values reflect the diameter of the particles, whereby 10%, 50% or 90% of all particles is below the size indicated on the y-axis. Data, mean±SEM; n=5 biologically independent samples, two-way ANOVA Sidak’s test. d, Immunoblotting analysis of enriched extracellular vesicles (EVs) present in the supernatants of ATG9AHuh7-WT and ATG9AHuh7-KO cells (Dig) expressing GFP or MyrPalm-EGFP and immunoblotted for GFP and CD63 (one of 3 independent experiments). e, Example of HCM images showing PM permeabilization (PI) of ATG9AHuh7-WT and ATG9AHuh7-KO cells exposed to virulent Mycobacterium tuberculosis Erdman; mutliplicity of infection (MOI; bacteria to cells ratio) 0 (Ctrl), 5 or 10. red masks, computer-identified PI+ nuclei. Scale bars, 10 µm. f, HCM quantification of PM permeabilization (PI) in ATG9AHuh7-WT and ATG9AHuh7-KO cells exposed to a nonvirulent derivative of M. tuberculosis subspecies bovis (BCG), mutliplicity of infection (MOI) 0 (Ctrl) or 10. Data, % of cells positive for PI (mean±SEM; n=6 biologically independent samples, two-way ANOVA Sidak’s test). g, Example of HCM images relative to f. Scale bars, 10 µm. Source data

References

    1. Morishita H, Mizushima N. Diverse cellular roles of autophagy. Annu. Rev. Cell Dev. Biol. 2019;35:453–475. doi: 10.1146/annurev-cellbio-100818-125300. - DOI - PubMed
    1. Levine B, Kroemer G. Biological functions of autophagy genes: a disease perspective. Cell. 2019;176:11–42. doi: 10.1016/j.cell.2018.09.048. - DOI - PMC - PubMed
    1. Christ L, Raiborg C, Wenzel EM, Campsteijn C, Stenmark H. Cellular functions and molecular mechanisms of the ESCRT membrane-scission machinery. Trends Biochem. Sci. 2017;42:42–56. doi: 10.1016/j.tibs.2016.08.016. - DOI - PubMed
    1. Hurley JH. ESCRTs are everywhere. EMBO J. 2015;34:2398–2407. doi: 10.15252/embj.201592484. - DOI - PMC - PubMed
    1. Gatta AT, Carlton JG. The ESCRT-machinery: closing holes and expanding roles. Curr. Opin. Cell Biol. 2019;59:121–132. doi: 10.1016/j.ceb.2019.04.005. - DOI - PubMed

Publication types