

Understanding the evolution of nutritive taste in animals: Insights from biological stoichiometry and nutritional geometry
- PMID: 34257909
- PMCID: PMC8258225
- DOI: 10.1002/ece3.7745
Understanding the evolution of nutritive taste in animals: Insights from biological stoichiometry and nutritional geometry
Abstract
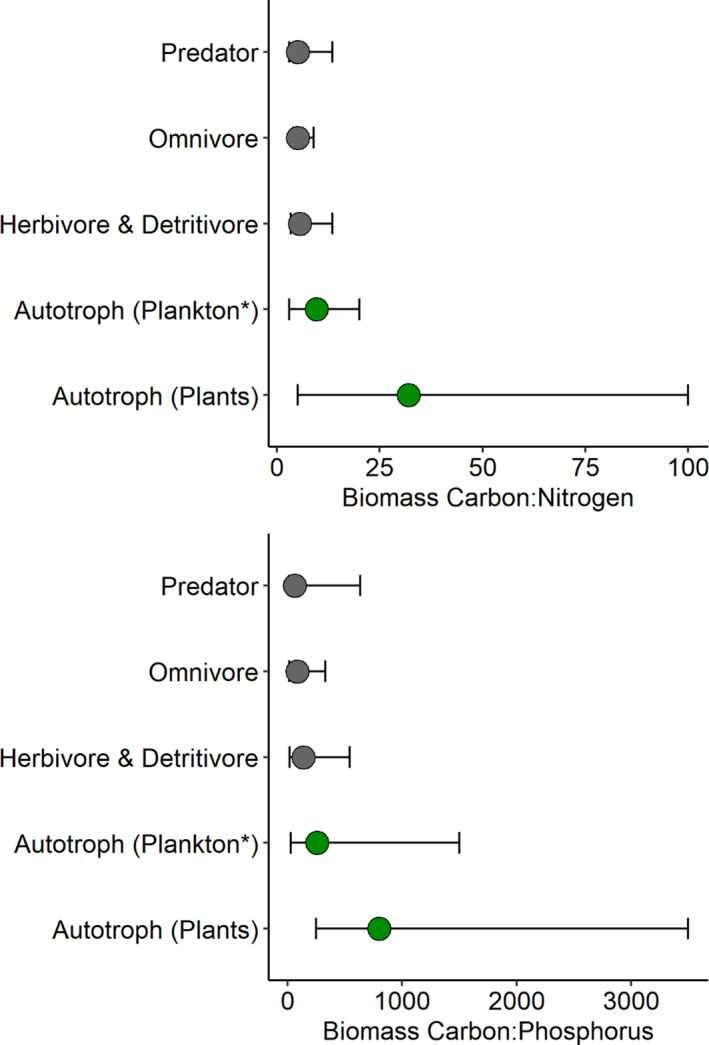
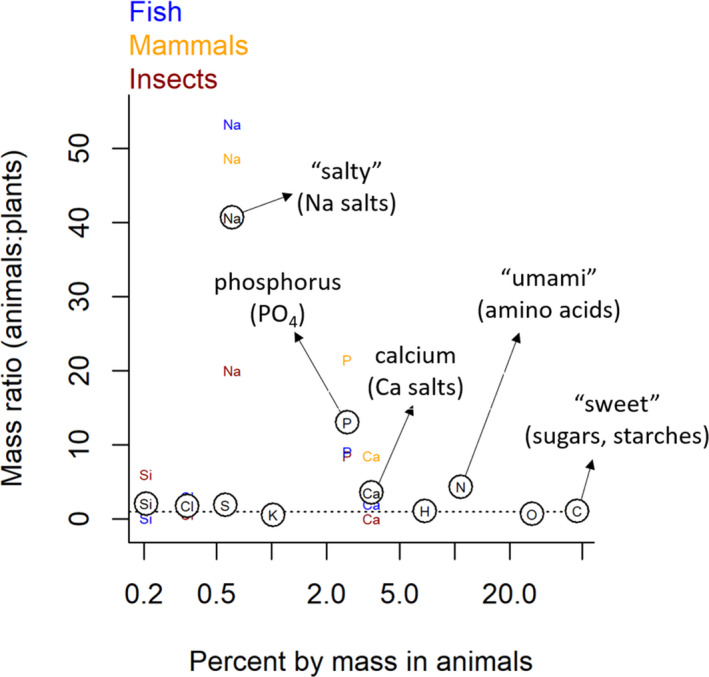
A major conceptual gap in taste biology is the lack of a general framework for understanding the evolution of different taste modalities among animal species. We turn to two complementary nutritional frameworks, biological stoichiometry theory and nutritional geometry, to develop hypotheses for the evolution of different taste modalities in animals. We describe how the attractive tastes of Na-, Ca-, P-, N-, and C-containing compounds are consistent with principles of both frameworks based on their shared focus on nutritional imbalances and consumer homeostasis. Specifically, we suggest that the evolution of multiple nutritive taste modalities can be predicted by identifying individual elements that are typically more concentrated in the tissues of animals than plants. Additionally, we discuss how consumer homeostasis can inform our understanding of why some taste compounds (i.e., Na, Ca, and P salts) can be either attractive or aversive depending on concentration. We also discuss how these complementary frameworks can help to explain the evolutionary history of different taste modalities and improve our understanding of the mechanisms that lead to loss of taste capabilities in some animal lineages. The ideas presented here will stimulate research that bridges the fields of evolutionary biology, sensory biology, and ecology.
Keywords: chemoreception; gustation; homeostasis; nutritional ecology; optimal foraging.
© 2021 The Authors. Ecology and Evolution published by John Wiley & Sons Ltd.
Conflict of interest statement
The authors of this manuscript declare no competing interests between the listed authors, institutions, or any third parties concerning this manuscript.
Figures
References
-
- Anderson, T. R. , Boersma, M. , & Raubenheimer, D. (2004). Stoichiometry: Linking elements to biochemicals. Ecology, 85, 1193–1202. 10.1890/02-0252 - DOI
-
- Anderson, T. R. , Raubenheimer, D. , Hessen, D. O. , Jensen, K. , Gentleman, W. C. , & Mayor, D. J. (2020). Geometric stoichiometry: Unifying concepts of animal nutrition to understand how protein‐rich diets can be “Too much of a good thing”. Frontiers in Ecology and Evolution, 8, 1–12. 10.3389/fevo.2020.00196 - DOI
-
- Baldwin, M. W. , Toda, Y. , Nakagita, T. , O'Connell, M. J. , Klasing, K. C. , Misaka, T. , Edwards, S. V. , & Liberles, S. D. (2014). Evolution of sweet taste perception in hummingbirds by transformation of the ancestral umami receptor. Science, 345, 929–933. 10.1126/science.1255097 - DOI - PMC - PubMed
Publication types
LinkOut - more resources
Full Text Sources
Miscellaneous
