. 2021 Jul;2(4):354-369.
doi: 10.1158/2643-3230.BCD-21-0038.

Tumor burden limits bispecific antibody efficacy through T cell exhaustion averted by concurrent cytotoxic therapy

Affiliations

Tumor burden limits bispecific antibody efficacy through T cell exhaustion averted by concurrent cytotoxic therapy

Erin W Meermeier et al. Blood Cancer Discov. 2021 Jul.

Erratum in

Abstract

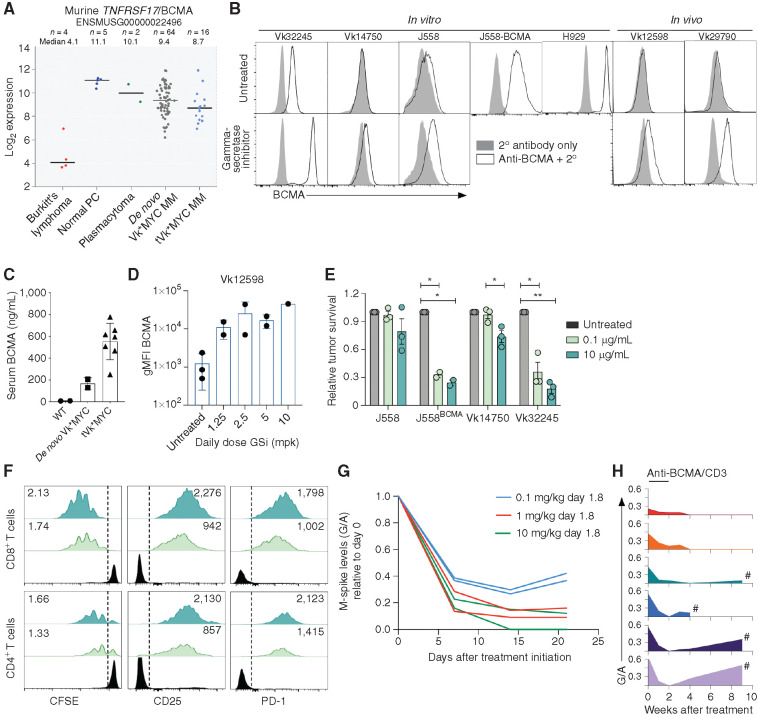
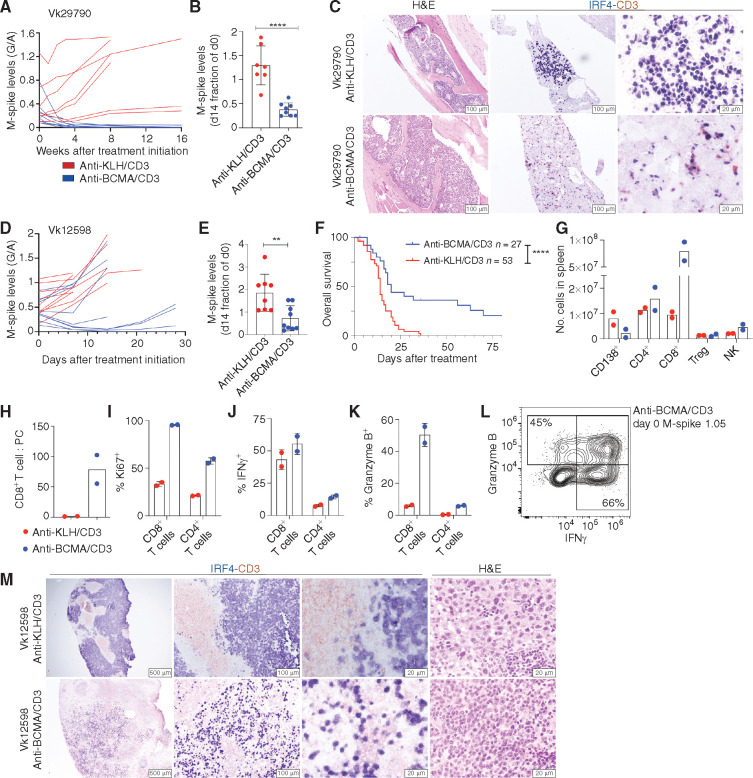
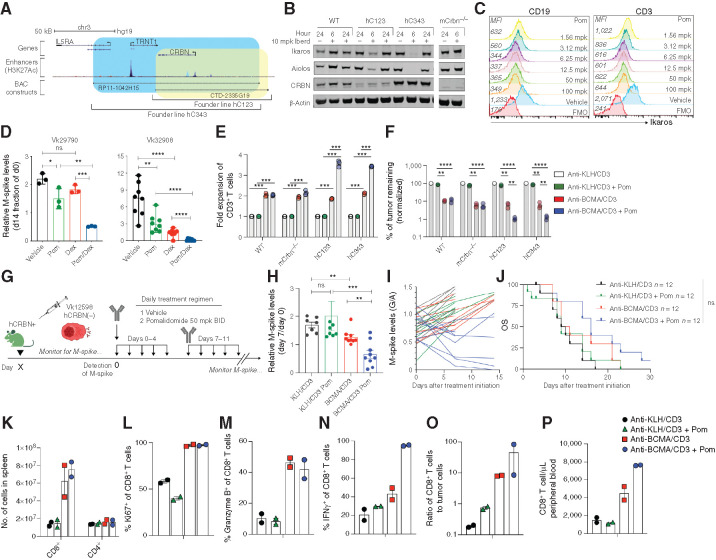
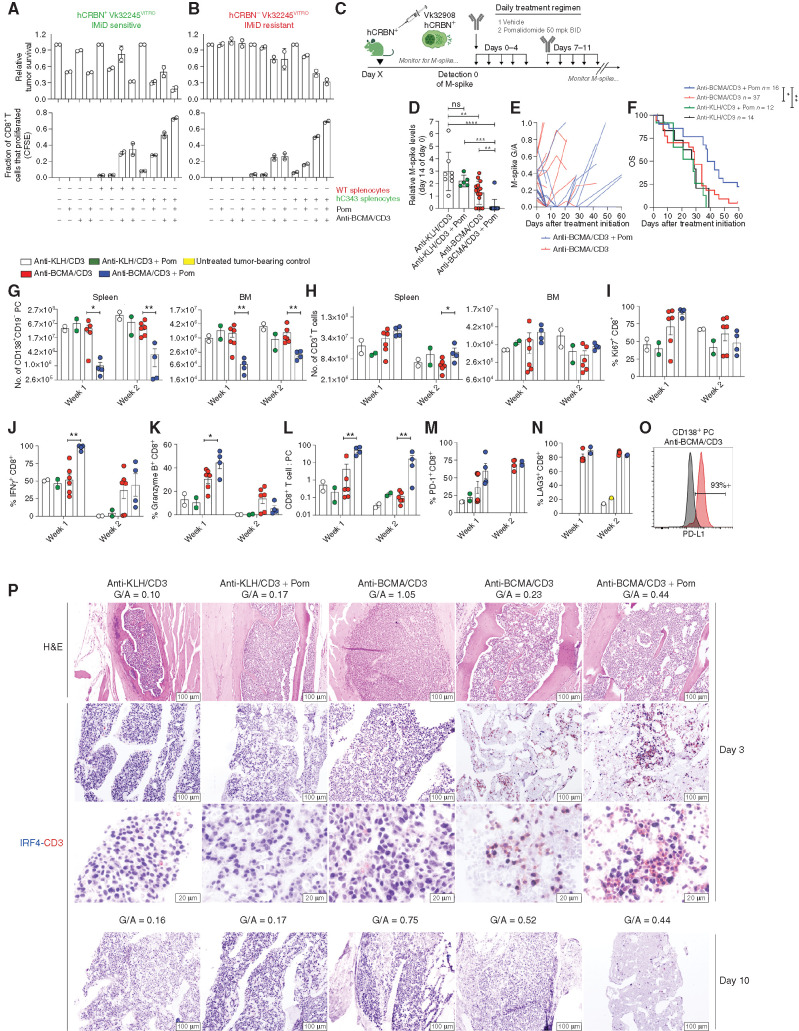
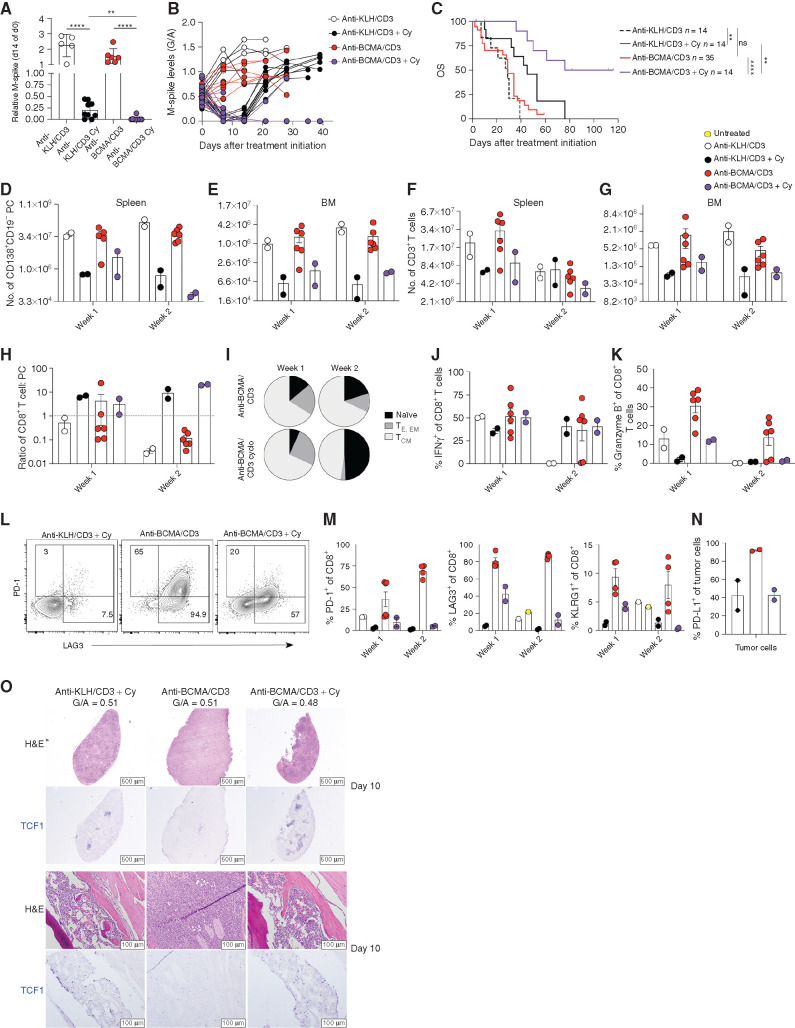
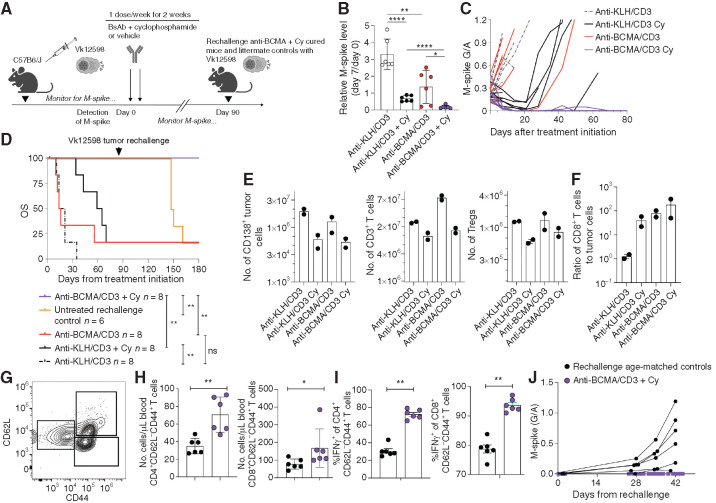
BCMA-CD3-targeting bispecific antibodies (BsAb) are a recently developed immunotherapy class which shows potent tumor killing activity in multiple myeloma (MM). Here, we investigated a murine BCMA-CD3-targeting BsAb in the immunocompetent Vk*MYC and its IMiD-sensitive derivative Vk*MYChCRBN models of MM. The BCMA-CD3 BsAb was safe and efficacious in a subset of mice, but failed in those with high-tumor burden, consistent with clinical reports of BsAb in leukemia. The combination of BCMA-CD3 BsAb with pomalidomide expanded lytic T cells and improved activity even in IMiD resistant high-tumor burden cases. Yet, survival was only marginally extended due to acute toxicity and T cell exhaustion, which impaired T cell persistence. In contrast, the combination with cyclophosphamide was safe and allowed for a tempered pro-inflammatory response associated with long-lasting complete remission. Concurrent cytotoxic therapy with BsAb actually improved T cell persistence and function, offering a promising approach to patients with a large tumor burden.


Figures

Figure 1.
Figure 1.
BCMA is a target for bispecific immunotherapy in Vk*MYC multiple myeloma (MM). A, Robust multi-array average (RMA)–summarized expression values of Tnfrsf17/BCMA mRNA of Vk*MYC-derived lymphoma cell lines, normal PCs, Balb/c plasmacytoma cell lines, Vk*MYC de novo multiple myeloma and transplantable cell lines (tVK*MYC). Line at median is shown for each group. B, BCMA cell-surface staining (white histogram) by flow cytometry (FCM) of cell lines or primary multiple myeloma cells with (bottom) or without (top) GS inhibition (DAPT 1 μmol/L, 18 hours for in vitro, and LY-411575-I at 5 mg/kg for in vivo treatment). The gray histogram depicts negative control staining with secondary antibody only. C, sBCMA levels quantified by ELISA in the serum of moribund tumor-bearing or age-matched wild-type (WT) control mice. Each symbol represents one untreated mouse, tested in duplicate. D, Surface BCMA quantified by FCM (geometric mean fluorescence intensity, gMFI) of ex vivo CD138+ tumor cells harvested from Vk12598 tumor–bearing mice left untreated or treated for 48 hours with the GS inhibitor (GSi) LY-411575-I at the indicated dose. Each dot represents an individual mouse. E, Tumor cell survival after incubation in vitro with splenocytes and BCMA/CD3 BsAb at two different concentrations, normalized to the untreated conditions. P values determined using multiple comparison t tests with Holm–Sidak adjustment. P values are denoted by asterisks: *, P < 0.05; **, P < 0.01. F, FCM analysis of T cells from killing assay in E, representative of triplicate tests. The proliferation index is in the top left and the gMFI for the indicated markers is presented in the top right corner of both plots. G, M-spike levels (G/A relative to day 0) over time (days) in six de novo Vk*MYC mice treated with increasing doses of anti-BCMA/CD3 BsAb. H, M-spike levels (G/A) over time (weeks) in six de novo Vk*MYC mice treated with 1 mg/kg anti-BCMA/CD3 BsAb on days 1 and 8. Each mouse is represented by a different colored histogram. # shows mice that succumbed to tumor burden.
Figure 2.
Figure 2.
The activity of anti-BCMA/CD3 is transient and related to initial tumor burden. A, M-spike levels (G/A ratio) measured over time in Vk29790 tumor–bearing mice treated with control anti-KLH/CD3 BsAb or anti-BCMA/CD3 at 1 mg/kg on days 1 and 8. B, M-spike levels (% of day 0) in Vk29790 tumor–bearing mice measured 14 days after treatment. Each dot represents an M-spike from an individual mouse. Bars show mean M-spike levels with SD. C, IHC staining (surface CD3 in red and nuclear IRF4 in blue) of BM sections from mice treated in A. Scale bar is shown in the bottom right corner. Images are representative of two mice necropsied from each treatment arm. H&E, hematoxylin and eosin. D, M-spike levels (G/A) quantified over time in response to control anti-KLH/CD3 or anti-BCMA/CD3 BsAb given at 1 mg/kg on days 1 and 8 in Vk12598 tumor–bearing mice. E, M-spike levels (% of day 0) in Vk12598 tumor–bearing mice measured 14 days after treatment. F, Kaplan–Meier survival plot in days from the initiation of treatment of Vk12598 tumor–bearing mice receiving the BsAb or control treatment. P values derived from Mantel–Cox log-ranked X2 test. G–L, FCM analysis of splenocytes from Vk12598 tumor–bearing mice harvested 3 days after treatment initiation as in D. NK, natural killer. M, Representative CD3 and IRF4 staining by IHC of SPL sections harvested 3 days after treatment initiation as in D. Unpaired t test P values in B and E are represented by asterisks. *, P < 0.05; **, P < 0.01; ***, P < 0.001; ****, P < 0.0001.
Figure 3.
Figure 3.
Pom enhances hCRBN transgenic CD8+ T-cell proliferation, cytokine production, and tumor killing induced by anti-BCMA/CD3 in IMiD-resistant tumors. A, Depiction of the location on human chromosome 3 of the two BACs (RP11-1042H15 and CTD-2335G19) chosen to generate hCRBN transgenic mice. Genes included in BAC are shown, and then the enhancer regions (identified by H3K27Ac peaks), followed by the span of each BAC (blue hC343, yellow, hC123). B, Western blot of splenocyte protein extracts generated from necropsied mice treated for 6 or 24 hours with 10 mg/kg iberdomide/CC220 and probed with antibodies against the listed proteins. Mouse strains are listed on the top as WT (C57BL/6), hC123, or hc343 (representing two different transgenic founder lines expressing hCRBN) and mCrbn−/−. C, Ikaros expression measured by FCM in CD19+ or CD3+ cell-surface–stained splenocytes harvested from hC343 transgenic mice treated in vivo for 6.5 hours with the indicated dose of Pom. Mean fluorescence intensity (MFI) is reported on the left of each histogram. FMO, fluorescence minus one. D, M-spike levels (% of day 0) in WT mice bearing the indicated Vk*MYChCRBN multiple myeloma lines measured 2 weeks after treatment. Bars indicate mean with SD. Dex, dexamethasone. E, Fold expansion of splenic T cells of the indicated genotype stimulated ex vivo by Vk32245VITRO multiple myeloma cells and the indicated BsAb with or without Pom for 3 days. Bars represent the mean and SEM. Significant differences were tested through multiple comparison t tests with Holms–Sidak adjustment. F, Viability of Vk32245VITRO multiple myeloma cells surviving tumor killing assay in A, all normalized to the negative control-treated condition. Bars in E and F represent the mean and SEM. Significant differences were tested through multiple comparison t tests with Holms–Sidak adjustment. G, Treatment schedule for hC343 recipient mice bearing IMiD-insensitive Vk12598 tumor cells treated with anti-KLH/CD3 or anti-BCMA/CD3 with or without Pom. BID, twice a day. H, M-spike levels (% of day 0) in Vk12598 tumor–bearing mice measured 7 days after treatment in B. Each dot represents an M-spike from an individual mouse. Bars show mean M-spike levels with SD. I, M-spike levels (G/A) were quantified over 2 weeks. Each line represents an individual mouse. Color of each line corresponds to the treatment groups in B. J, Kaplan–Meier survival plot in days from the initiation of treatment of Vk12598 tumor–bearing hCRBN+ mice receiving treatments in B. Differences were tested with Mantel–Cox log-ranked X2 test. K, Number of cells per SPL, identified by FCM, of mice (n = two per group) 3 days after treatment initiation from B. Percentage of CD8+ T cells expressing Ki67 (L), granzyme B (M), or IFNγ (N) and the ratio of CD8+ T cells to tumor cells (O). P, Number of CD8+ T cells per μL of peripheral blood at necropsy. Unpaired t test: *, P < 0.05; **, P < 0.01; ***, P < 0.001; ****, P < 0.0001. ns, not significant.
Figure 4.
Figure 4.
Tumor- and T cell–autonomous Pom effects enhance anti-BCMA/CD3 activity. The cell viability by FCM of Vk32245VITRO multiple myeloma cells transduced with hCRBN-expressing lentivirus (A) or empty control (B) cocultured in vitro with splenocytes from WT or hC343 mice and exposed to anti-BCMA/CD3 with or without Pom is shown on top graphs, normalized to the untreated conditions. Representative of three independent experiments.Bottom, the proliferation of CD8+ T cells from the conditions in A were quantified by dilution of cytoplasmic CFSE and measured by FCM. Bar graphs indicate the fraction of total cells that proliferated (1 = 100%). Error bars, SEM of triplicate values. C, Treatment schematic for hC343 recipient mice bearing IMiD-sensitive Vk32908 multiple myeloma cells. BID, twice a day. D, M-spike levels (% of day 0) in Vk32908 tumor–bearing mice measured 14 days after treatment initiation. Each dot represents the M-spike from an individual mouse. Bars show mean with SD. P values derived from unpaired nonparametric t tests. E, M-spike (G/A) of individual mice measured over time after treatment initiation. F, Kaplan–Meier survival plot in days from the initiation of treatment of Vk32908 tumor–bearing hCRBN+ mice receiving treatments in B. P values derived from Mantel–Cox log-ranked X2 test. Bar graphs summarizing Vk32908 tumor cells (G) or T cells (H) quantified by FCM in the SPL and BM of mice in C, 3 or 10 days after treatment initiation. Each dot represents an individual mouse. Bar graphs of the percentage of Ki67+ (I), IFNγ+ (J), and granzyme B (K) CD8+ splenic T cells as well as the CD8+ T cell–to–tumor cell ratio in the SPL (L). Percentage of PD-1+ (M) and LAG3+ (N) CD8+ T cells from splenocytes. O, PD-L1 expression by FCM in Vk32908 multiple myeloma cells from a representative mouse treated with anti-BCMA/CD3, 10 days after treatment initiation. Black histogram represents fluorescence minus one control staining. P, BM sections from mice necropsied 3 days (first–third rows) or 10 days (fourth row) after treatment initiation in C, stained with hematoxylin and eosin (H&E) or antibodies to CD3 in red and IRF4 in blue. G/A ratio at the beginning of treatment is indicated above each image. Two examples of mice treated with anti-BCMA/CD3 are shown: low and high initial M-spikes. Scale bar, magnification. Unpaired t test: *, P < 0.05; **, P < 0.01; ***, P < 0.001; ****, P < 0.0001. ns, not significant.
Figure 5.
Figure 5.
Effective combination of Cy and anti-BCMA/CD3. hC343 mice bearing Vk32908 multiple myeloma cells were treated with anti-KLH/CD3 BsAb or anti-BCMA/CD3 BsAb (1 mg/kg on days 1 and 8) with or without Cy concurrently (100 mg/kg on days 1 and 8). A, M-spike levels (% of day 0) measured 14 days after treatment. Each dot represents an M-spike from an individual mouse. Bars show mean M-spike levels with SD. Unpaired t test: *, P < 0.05; **, P < 0.01; ***, P < 0.001; ****, P < 0.0001. ns, not significant. B, M-spike levels (G/A) measured weekly for the treatment groups in A. Each dot represents an individual mouse. C, Kaplan–Meier survival plot in days of Vk32908 tumor–bearing mice receiving treatments in A; P values derived from Mantel–Cox log-rank X2 test. Number of tumor cells (D and E) or T cells (F and G) quantified by FCM in the SPL or BM of mice 3 or 10 days after treatment initiation. Each dot represents an individual mouse. H, CD8+ T cell–to–tumor cell ratio in the SPL. I, Average frequency of CD8+ T-cell memory compartments quantified by FCM [naïve = CD44CD62L+, effector (TE) = CD44+CD62LKLRG1 or CD44+CD62LKLRG1+, effector memory (TM) = CD44+CD62L, and central memory (TCM) = CD44+CD62L+]. Bar graphs of the frequency of splenic CD8+ T cells expressing IFNγ (J) or granzyme B (K). L, Example dot plots of CD8+ T-cell expression of immediate activation markers LAG3 and PD-1 3 days after treatments indicated on top of each graph. M, Percentage of splenic CD8+ T cells expressing PD-1, LAG3, and KLRG1. N, Percentage of Vk32908 tumor cells expressing PD-L1 10 days after treatment initiation. O, Hematoxylin and eosin (H&E) and TCF1 (blue) staining of SPL (top) and BM (bottom) sections from mice collected 10 days after treatment with the indicated drugs. M-spike levels (G/A) at day 0 are reported for each mouse.
Figure 6.
Figure 6.
The combination of Cy and anti-BCMA/CD3 is curative and induces long-lasting protection from tumor rechallenge. A, WT mice bearing Vk12598 tumors were treated as indicated with control or anti-BCMA/CD3 with or without Cy for 2 weeks. B, Relative M-spike levels (% of day 0) ­measured 7 days after the indicated treatment. Each dot represents an M-spike from an individual mouse. Bars show mean M-spike levels with SD.C, M-spike levels (G/A) measured weekly. Each line indicates one mouse. D, Kaplan–Meier survival plot in days from the initiation of treatment of Vk12598 tumor–bearing mice receiving treatments in A. P values derived from the Mantel–Cox log-ranked X2 test. Arrow indicates the time at which anti-BCMA/CD3–treated mice were retransplanted with 1 million Vk12598 myeloma cells. At the same time, previously untreated and not transplanted age-matched littermate WT mice were also transplanted with the same pool of Vk12598 cells. E, Number of CD138+ tumor cells, CD3+ T cells, and regulatory CD4+ T cells per SPL measured by FCM of samples from necropsied mice 3 days after treatment initiation of groups in A. F, Ratio of CD8+ T cells to CD138+ tumor cells per mouse. G, Representative example of FCM measurement of circulating memory T cells collected from mice in F on day 90, prior to rechallenge with Vk12598. H, Quantification of effector memory CD4+ and CD8+ T cells per μL of blood on day 90, prior to challenge. I, Frequency of IFNγ-producing effector memory CD4+ and CD8+ T cells in the blood of mice prior to challenge with Vk12598 in F. J, M-spike (G/A) after rechallenge of cured or matched WT control mice with Vk12598 cells. P values derived from unpaired t tests. *, P < 0.05; **, P < 0.01; ***, P < 0.001; ****, P < 0.0001. ns, not significant.

References

    1. Chesi M, Fonseca R.Antibodies create killer bonds in myeloma. Cancer Cell 2017;31:305–7. - PubMed
    1. Shah N, Aiello J, Avigan DE, Berdeja JG, Borrello IM, Chari A, et al. The society for immunotherapy of cancer consensus statement on immunotherapy for the treatment of multiple myeloma. J Immunother Cancer 2020;8:e000734. - PMC - PubMed
    1. Costa LJ, Wong SW, Bermúdez A, de la Rubia J, Mateos MV, Ocio EM, et al. First clinical study of the B-cell maturation antigen (BCMA) 2+1 T cell engager (TCE) CC-93269 in patients (Pts) with relapsed/refractory multiple myeloma (RRMM): interim results of a phase 1 multicenter trial. Blood 2019;134:143.
    1. Topp MS, Duell J, Zugmaier G, Attal M, Moreau P, Langer C, et al. Evaluation of AMG 420, an anti-BCMA bispecific T cell engager (BiTE) immunotherapy, in R/R multiple myeloma (MM) patients: updated results of a first-in-human (FIH) phase I dose escalation study. J Clin Oncol 2019;37:8007.
    1. Garfall AL, Usmani SZ, Mateos MV, Nahi H, van de Donk NWCJ, San-Miguel JF, et al. Updated phase 1 results of teclistamab, a B-cell maturation antigen (BCMA) x CD3 bispecific antibody, in relapsed and/or refractory multiple myeloma (RRMM). Blood 2020;136:27.

Publication types

Substances