

doi: 10.1016/j.xpro.2021.100627.
eCollection 2021 Sep 17.
Optimized protocol for immunophenotyping of melanoma and tumor-bearing skin from mouse
Affiliations
- PMID: 34258591
- PMCID: PMC8260876
- DOI: 10.1016/j.xpro.2021.100627
Item in Clipboard
Optimized protocol for immunophenotyping of melanoma and tumor-bearing skin from mouse
STAR Protoc.
.
Abstract
While isolating immune cells from spleens and lungs is routinely achieved using flow cytometry, it is challenging to isolate viable immune cells from skin. Here, we describe a step-by-step protocol for skin digestion using a murine melanoma model, which is amenable for detection of low abundant immune cell populations including group 2 innate lymphoid cells.
Keywords: Cancer; Cell isolation; Flow Cytometry/Mass Cytometry; Immunology; Model Organisms.
© 2021 The Author(s).
Conflict of interest statement
The authors declare no competing interests.
Figures
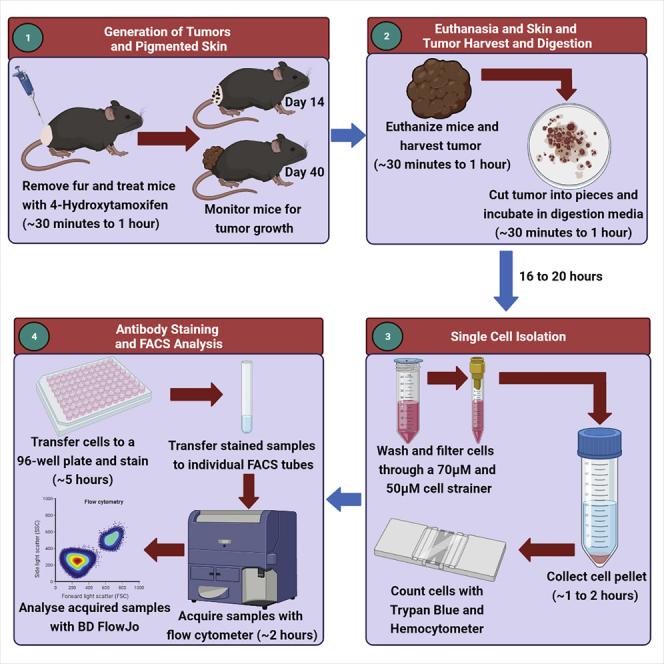
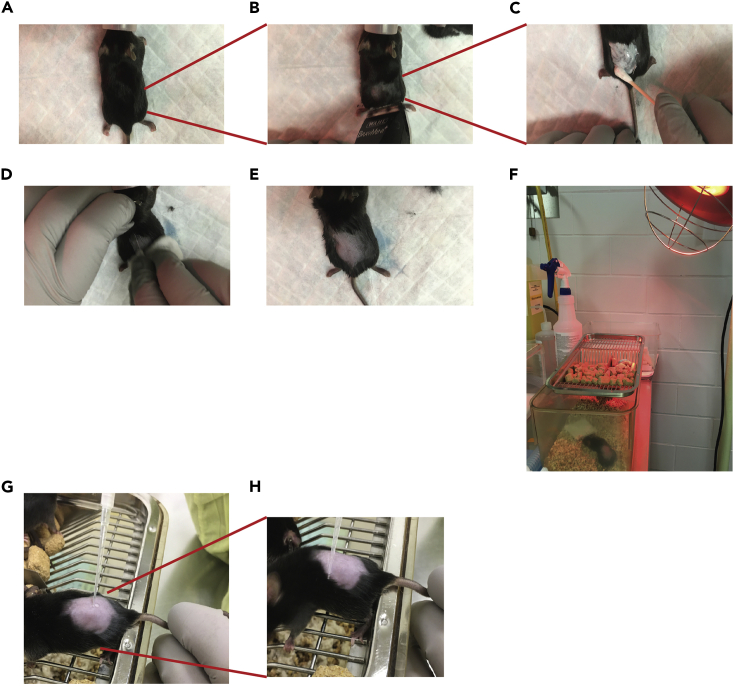
Application of 4-Hydroxytamoxifen (4-HT) for the induction of Melanoma formation (A) Mice are sedated with 3% Isoflurane. (B) Mice are shaved at the lower back near the base of tail. (C) Hair depilatory cream is applied for 2–3 min to remove residual fur. (D) Wet swab used to remove the cream. (E) Dry and inspect skin for any residual fur. (F) Place mice back in the cage with a heating lamp to allow recovery. (G) Using a pipette tip, add 2μl of 5mM 4-HT to the shaved, exposed skin. (H) Use the side of a pipette tip to spread 4-HT on the skin and allow it to dry before placing the mouse back into the cage
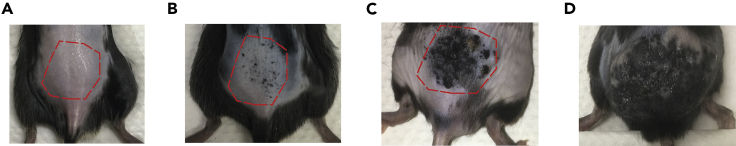
Melanoma progression following 4-HT treatment (A) Day 7 following 4-HT treatment. During this timepoint, no pigmented lesions yet visible. (B) Day 12 – 14 following 4-HT treatment. During this timepoint, pigmented lesions will start to form. (C) Day 24 – 28 following 4-HT treatment. During this timepoint, measurable tumors will start to form. (D) Any time after Day 40 following 4-HT treatment, mice are monitored closely for human endpoints.
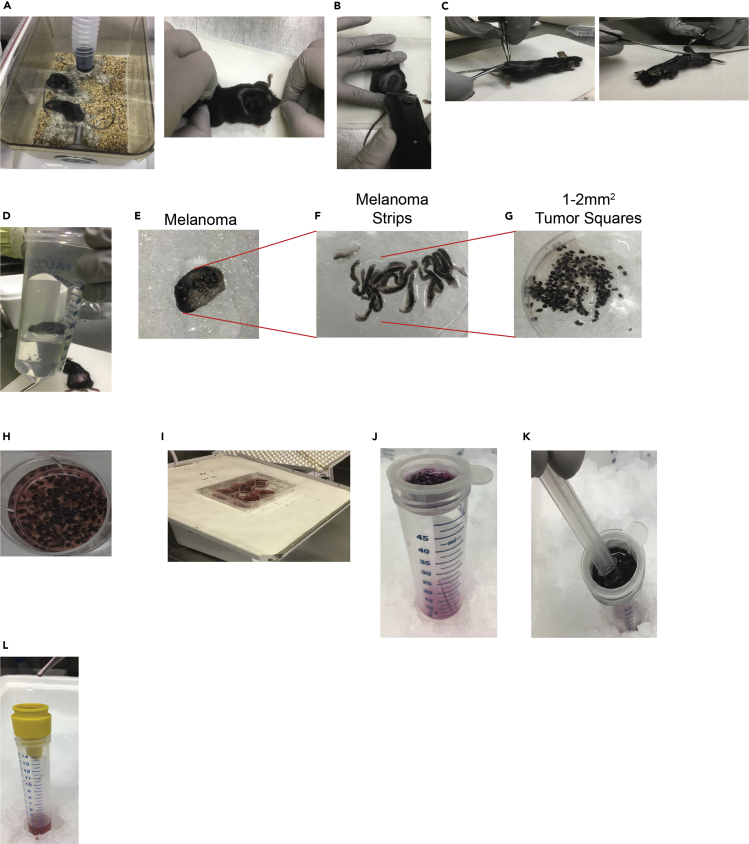
Skin and melanoma harvest (A) Euthanize mice according to institutional guidelines, typically by sedation with 5% Isoflurane, followed by asphyxiation and physical confirmation of death by cervical dislocation. (B) Shave fur from tumor sites and peripheral area. (C) Harvest tumors using scissors and forceps. (D) Place tumors in cold PBS. (E) Place tumors in 10cm dishes on ice. (F) Cut tumors into strips. (G) Cut strips into 1–2 mm2 squares. (H) Place tumors squares into a 6-well plate and add 5 mL digestion media. (I) Place plate containing tumor squares on a rocker in a cold room and incubate for 16–20 h. (J) Place tumors and digestion media through a 70μM cell strainer. (K) A 3 mL or 5 mL syringe plunger is used to mash the tumor on the strainer and wash the strainer twice with DMEM containing 5% FBS. (L) Filter the tumor and media through a 50μM cell strainer, wash, and count cells with Trypan Blue and a hemocytometer.
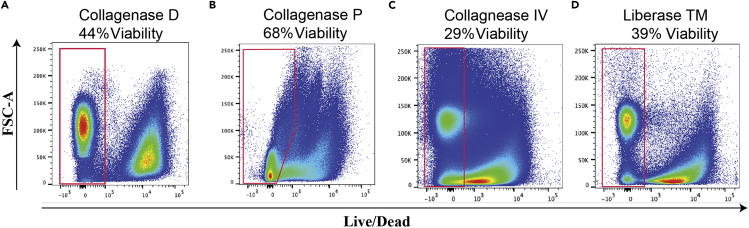
Single cell suspensions of melanomas were prepared using distinct enzymatic treatments and cell viabilities were determined by flow cytometric analysis. (A) Collagenase D, (B) Collagenase P, (C) Collagenase IV at 30°C for 1 h, (D) Liberase TM
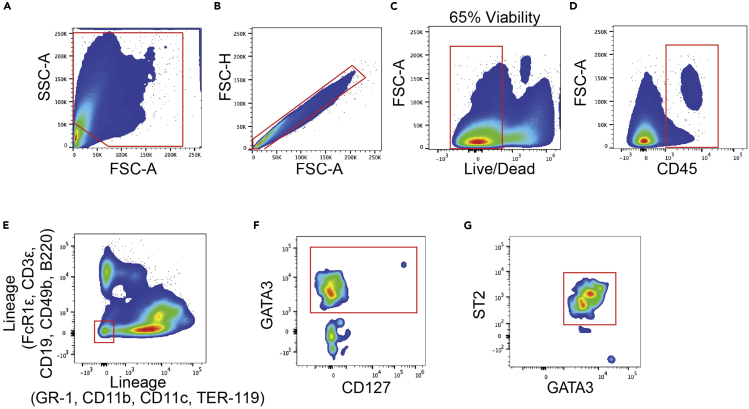
ILC2 gating strategy (A) Forward and sideward scatter gating to exclude debris. (B) Singlet cell gating. (C) Live cell gating. (D) CD45+ cell gating. (E) Lineage-negative cell population gating. (F) GATA3+ cell population gating. (G) ILC2 were characterized as GATA3+ST2+ cell population.
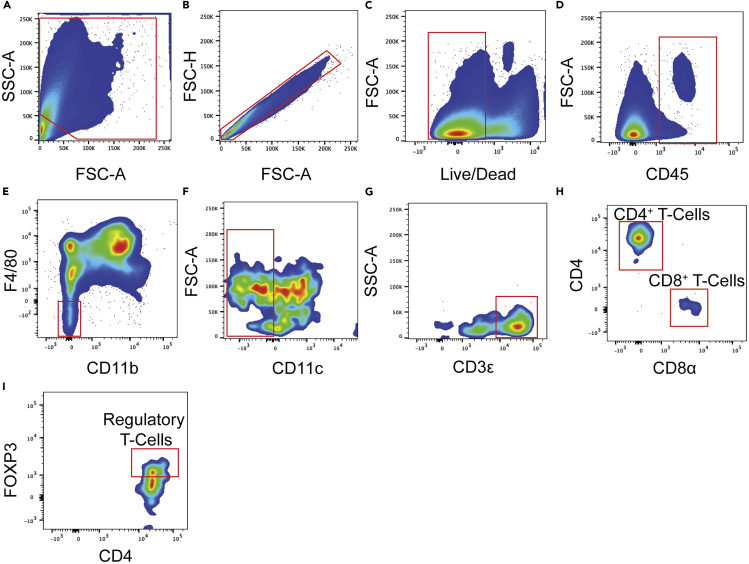
Regulatory T-cells (Tregs) gating strategy (A) Forward and sideward scatter gating to exclude debris. (B) Singlet cell gating. (C) Live cell gating. (D) CD45+ cell gating. (E) CD11b and F4/80 double-negative gating. (F) CD11c negative gating. (G) CD3ε+ T cell gating. (H) CD4+ T cell and CD8+ T cell gating. (I) CD4+FOXP3+ gating to identify Tregs
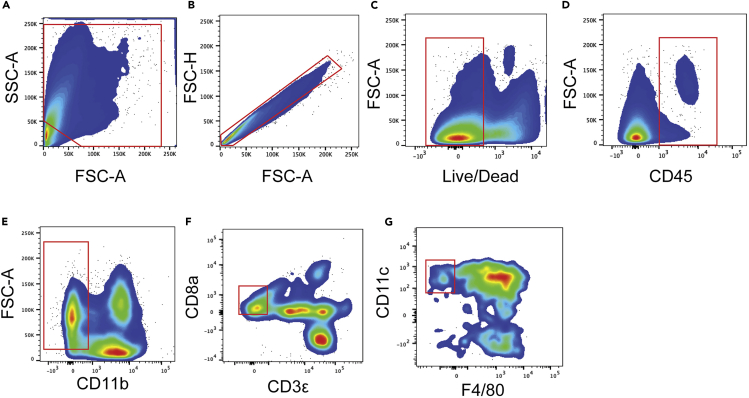
Non-lymphoid tissue dendritic cells (NLT DCs) gating strategy (A) Forward and sideward scatter gating to exclude debris. (B) Singlet cell gating. (C) Live cell gating. (D) CD45+ cell gating. (E) CD11b negative gating. (F) CD3ε and CD8ε double negative gating. (G) F4/80Low, CD11cMid gating to identify NLT DCs.
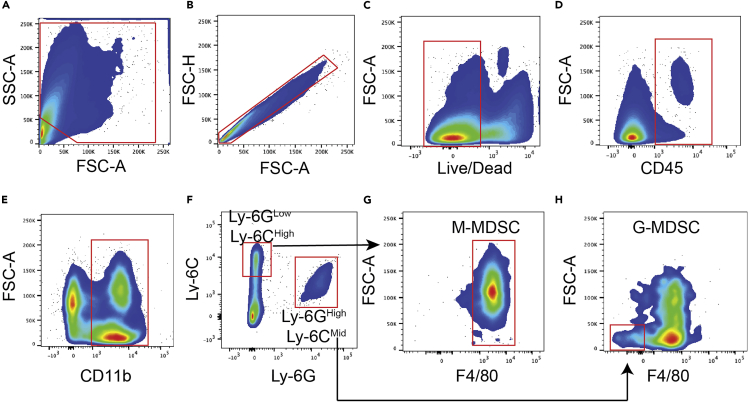
Myeloid-derived suppressor cells (MDSC) gating strategy (A) Forward and sideward scatter gating to exclude debris. (B) Singlet cell gating. (C) Live cell gating. (D) CD45+ cell gating. (E) CD11b positive gating. (F) Ly-6GLow and Ly-6CHigh gating for M-MDSCs and Ly-6GHigh and Ly-6CMid for G-MDSCs. (G) F4/80High gating to identify M-MDSCs. (H) F4/80Low gating to identify G-MDSCs
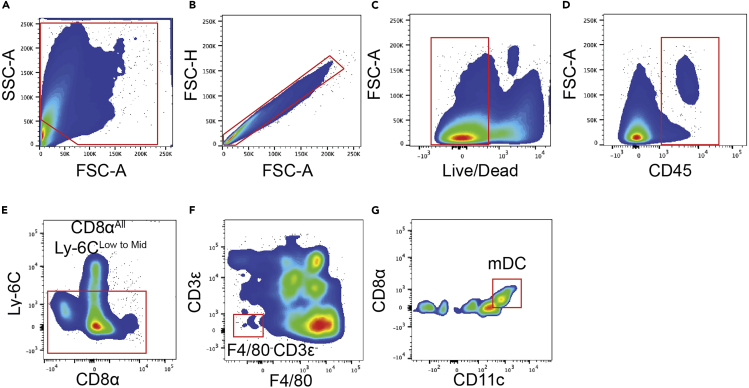
Monocytic tissue dendritic cells (mDCs) gating strategy (A) Forward and sideward scatter gating to exclude debris. (B) Singlet cell gating. (C) Live cell gating. (D) CD45+ cell gating. (E) CD8αAll and Ly-6CLow gating. (F) F4/80-CD3ε- for mDCs. (G) CD8αLow and CD11cMid to High to identify mDCs
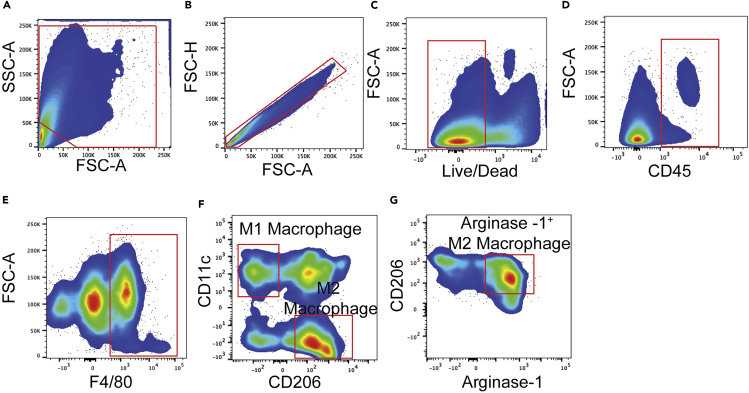
Macrophage gating strategy (A) Forward and sideward scatter gating to exclude debris. (B) Singlet cell gating. (C) Live cell gating. (D) CD45+ cell gating. (E) F4/80High population gating. (F) CD11cHigh and CD206Low gating for M1 Macrophages, and CD11cLow and CD206Mid to High gating for M2 Macrophages. (G) M2 Macrophages express high levels of Arginase-1.
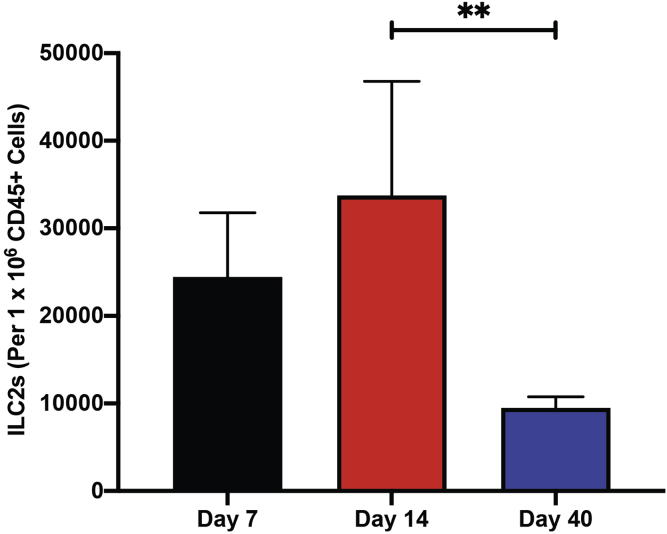
Detection of ILC2s at 3 different timepoints during melanoma progression (mouse model shown in Figure 2) ILC2s reduce in number in melanomas characterized on Day 40, compared to Days 7 and 14. One-way ANOVA. All values are represented as mean ± SD. ∗∗P ≤ 0.01.
References
-
- Meininger I., Carrasco A., Rao A., Soini T., Kokkinou E., Mjosberg J. Tissue-specific features of innate lymphoid cells. Trends Immunol. 2020;41:902–917. - PubMed
Publication types
MeSH terms
Grants and funding
LinkOut - more resources
Full Text Sources
Medical
