. 2022 Feb;251(2):390-402.
doi: 10.1002/dvdy.400. Epub 2021 Jul 22.

Defined diets for freshwater planarians

Affiliations

Defined diets for freshwater planarians

Chris Abel et al. Dev Dyn. 2022 Feb.

Abstract

Background: Planarian flatworms are popular invertebrate models for basic research on stem cell biology and regeneration. These animals are commonly maintained on a diet of homogenized calf liver or boiled egg yolk in the laboratory, introducing a source of uncontrolled experimental variability.

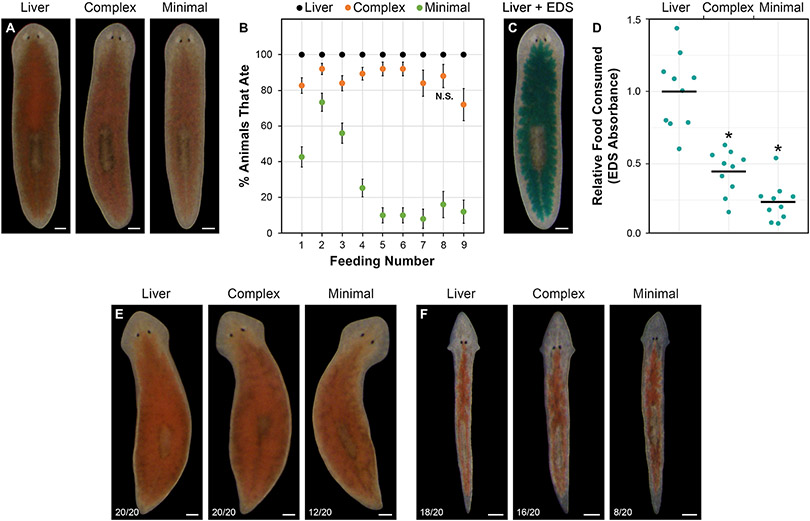
Results: Here, we report the development of defined diets, prepared entirely from standardized, commercially sourced ingredients, for the freshwater species Schmidtea mediterranea, Dugesia japonica, and Girardia dorotocephala. These food sources provide an opportunity to test the effects of specific nutritional variables on biological phenomena of interest. Defined diet consumption was not sufficient for growth and only partially induced the increase in stem cell division that normally accompanies feeding, suggesting these responses are not solely determined by caloric intake. Our defined diet formulations enable delivery of double-stranded RNA for gene knockdown in a manner that provides unique advantages in some experimental contexts. We also present a new approach for preserving tissue integrity during hydrogen peroxide bleaching of liver-fed animals.

Conclusions: These tools will empower research on the connections between diet, metabolism, and stem cell biology in the experimentally tractable planarian system.

Keywords: feeding; flatworms; growth; nutrition; stem cells.


Figures

Figure 1.
Figure 1.. Defined diet feeding in freshwater planarians.
(A) Representative images of live S. mediterranea photographed after a single ad libitum feeding with homogenized beef liver or defined diets. Red food coloring was added to visualize ingested food. (B) Percentage of animals that consumed each diet. Results are from three biological replicates, each of which included 25 animals per condition. Feedings were administered every other day until the liver-fed animals began to fission (replicates were terminated after feedings 4, 6, and 9). Error bars show standard error. Differences between liver and each defined diet were significant at all time points (Pearson’s chi-square test; p < 0.05), except for the complex diet in feeding number 8. (C) Representative image of an animal fed liver containing 0.2% erioglaucine disodium salt (EDS). (D) The relative amount of each diet consumed in a single ad libitum feeding was determined by measuring EDS absorbance in lysates of fed animals (Experimental Procedures). Each data point denotes the absorbance of a single lysate prepared from five animals, with all values expressed relative to the mean for liver. Horizontal lines denote means. Asterisks denote p values < 5E-5 for T-tests comparing liver and each defined diet. (E,F) Live D. japonica (E) and G. dorotocephala (F) photographed after a single ad libitum feeding with the indicated diets. Red food coloring was added to visualize ingested food. The number of animals that consumed each diet is indicated in the lower left of each panel. Scale bars (A,C,E,F): 200 μm.
Figure 2.
Figure 2.. Impacts of defined diets on growth and stem cell division.
(A) Ad libitum feeding with the complex diet every other day significantly slowed the rate of degrowth. Results are from three biological replicates, each of which included 15 animals per condition. Error bars show standard deviation. Asterisks and double asterisks denote p values < 0.002 and < 5E-5, respectively, for T-tests comparing unfed controls and animals fed with the complex diet. Liver-fed controls started to fission beyond 5 feedings and were excluded from subsequent analysis. (B) Representative images of H3P immunostaining in unfed controls and animals fixed 24 hours after a single feeding with the indicated diets. Scale bars = 100 μm. (C) Quantitative analysis of H3P results. Data are from three biological replicates, with a minimum of 30 combined animals per condition. Boxes, whiskers, and horizontal lines denote the interquartile range (IQR), values within 1.5X the IQR, and medians, respectively. Asterisks denote p values for T-tests comparing unfed controls and animals fed with the indicated diets (single asterisk: p < 1E-3; double asterisks: p < 1E-10). (D-F) Effects of complex diet supplementation (0.5 g casein and 2.0 g dextrose per 10 ml) on rates of food consumption (D), changes in animal size (E), and stem cell division at 24 hours post-feeding (F). Relative food consumption was determined from EDS absorbance measurements (each data point indicates the absorbance of a single lysate prepared from five animals, with values expressed relative to the mean for liver). Results for animal area and H3P labeling are from three biological replicates, with a minimum of 30 combined animals per condition. Horizontal lines denote means in (D) and medians in (E,F). Boxes and whiskers denote the IQR and range of values within 1.5X the IQR, respectively. Asterisks denote T-test p values for comparisons with liver-fed controls (D), 0-feeding controls (E), or unfed controls (F), except for the indicated, direct comparisons between the standard and supplemented complex diet formulations [single asterisk: p < 1E-3; double asterisks: p < 5E-10; N.S. (not significant): p > 0.05].
Figure 3.
Figure 3.. RNA interference by dsRNA delivery in defined diets.
(A,B) Regardless of food source, RNAi knockdown of PBGD-1 via a single dsRNA feeding (A) or of β-catenin-1 via six dsRNA feedings (B) prevented pigmentation of newly formed tissue and resulted in two-headed animals, respectively. Images show representative live animals subjected to head and tail amputations the day after the final feeding and photographed at 21 days post-amputation. (C,D) H3P immunostaining in negative control(RNAi) and magoh(RNAi) animals fixed, labeled, and photographed three days after the last of four dsRNA feedings. The quantitative analysis was based on results from three biological replicates, with a minimum of 32 combined animals per condition. Boxes, whiskers, and horizontal lines denote the IQR, values within 1.5X the IQR, and medians, respectively. Double asterisks denote p values < 1E-20 for T-tests comparing negative control(RNAi) and magoh(RNAi) animals for each diet; comparisons for dsRNA delivery via liver and the complex diet within each RNAi condition were not significant (N.S.; p > 0.1). (E,F) Impacts of added dsRNA-expressing bacteria [negative control(RNAi)] on relative food consumption (E) and growth/degrowth (F). Relative food consumption was determined from EDS absorbance measurements (each data point indicates the absorbance of a single lysate prepared from five animals, with values expressed relative to the mean for liver). Results for animal area are from three biological replicates, with a minimum of 48 combined animals per condition. Area measurements were obtained for a subset of randomly selected animals at the start of the experiment (Initial) and 48 hours after the last of eight feedings with the indicated diets. Horizontal lines denote means in (E) and medians in (F). Boxes and whiskers denote the IQR and range of values within 1.5X the IQR, respectively. Asterisks denote p values for T-tests comparing experimental conditions and liver-fed controls (E) or the initial timepoint (F) (single asterisk: p < 5E-4; double asterisks: p < 1E-20; N.S.: p > 0.4). Scale bars: (A,B) = 200 μm; (C) = 100 μm.
Figure 4.
Figure 4.. Labeling of recently fed animals.
(A,B) H3P immunostaining (A) and whole-mount in situ hybridization with a probe for the neoblast marker smedwi-1 (B) in animals fixed at one hour post-feeding. Liver-fed animals were pre-treated and bleached with Na azide (Experimental Procedures). Scale bars: (A) = 100 μm; (B) = 200 μm.

References

    1. Newmark PA, Sánchez Alvarado A. Not your father’s planarian: a classic model enters the era of functional genomics. Nat Rev Genet. 2002;3(3):210–219. doi:10.1038/nrg759 - DOI - PubMed
    1. Ivankovic M, Haneckova R, Thommen A, et al. Model systems for regeneration: Planarians. Development. 2019;146(17):dev167684. doi:10.1242/dev.167684 - DOI - PubMed
    1. Reddien PW. The cellular and molecular basis for planarian regeneration. Cell. 2018;175(2):327–345. doi:10.1016/j.cell.2018.09.021 - DOI - PMC - PubMed
    1. Dattani A, Sridhar D, Aziz Aboobaker A. Planarian flatworms as a new model system for understanding the epigenetic regulation of stem cell pluripotency and differentiation. Semin Cell Dev Biol. 2019;87:79–94. doi:10.1016/j.semcdb.2018.04.007 - DOI - PubMed
    1. Baguñà J Dramatic mitotic response in planarians after feeding, and a hypothesis for the control mechanism. J Exp Zool. 1974;190(1):117–122. doi:10.1002/jez.1401900111 - DOI - PubMed

Publication types

LinkOut - more resources