. 2021 Nov;41(11):2870-2886.
doi: 10.1177/0271678X211028680. Epub 2021 Jul 14.

Intranasal delivery of interleukin-4 attenuates chronic cognitive deficits via beneficial microglial responses in experimental traumatic brain injury

Affiliations

Intranasal delivery of interleukin-4 attenuates chronic cognitive deficits via beneficial microglial responses in experimental traumatic brain injury

Hongjian Pu et al. J Cereb Blood Flow Metab. 2021 Nov.

Abstract

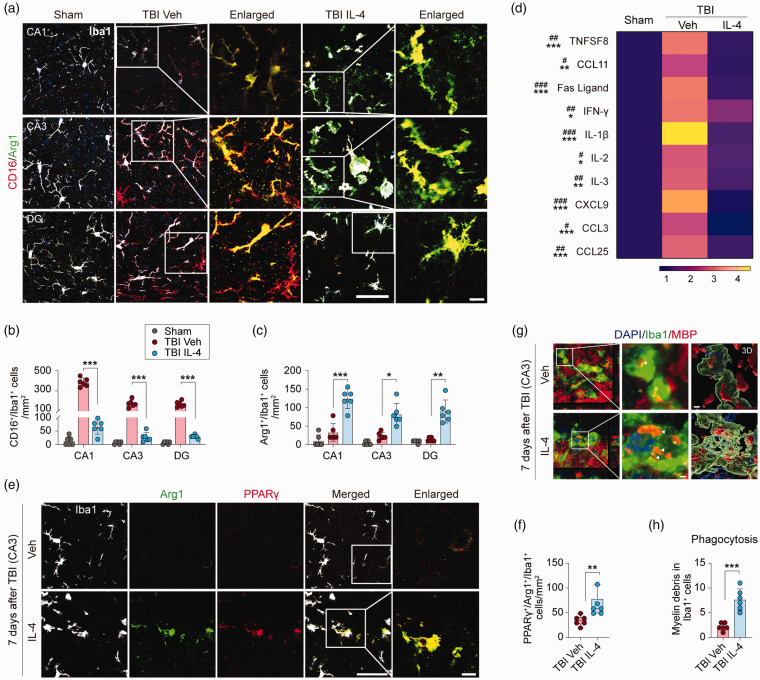
Traumatic brain injury (TBI) is commonly followed by long-term cognitive deficits that severely impact the quality of life in survivors. Recent studies suggest that microglial/macrophage (Mi/MΦ) polarization could have multidimensional impacts on post-TBI neurological outcomes. Here, we report that repetitive intranasal delivery of interleukin-4 (IL-4) nanoparticles for 4 weeks after controlled cortical impact improved hippocampus-dependent spatial and non-spatial cognitive functions in adult C57BL6 mice, as assessed by a battery of neurobehavioral tests for up to 5 weeks after TBI. IL-4-elicited enhancement of cognitive functions was associated with improvements in the integrity of the hippocampus at the functional (e.g., long-term potentiation) and structural levels (CA3 neuronal loss, diffusion tensor imaging of white matter tracts, etc.). Mechanistically, IL-4 increased the expression of PPARγ and arginase-1 within Mi/MΦ, thereby driving microglia toward a global inflammation-resolving phenotype. Notably, IL-4 failed to shift microglial phenotype after TBI in Mi/MΦ-specific PPARγ knockout (mKO) mice, indicating an obligatory role for PPARγ in IL-4-induced Mi/MΦ polarization. Accordingly, post-TBI treatment with IL-4 failed to improve hippocampal integrity or cognitive functions in PPARγ mKO mice. These results demonstrate that administration of exogenous IL-4 nanoparticles stimulates PPARγ-dependent beneficial Mi/MΦ responses, and improves hippocampal function after TBI.

Keywords: Cognitive function; DTI; PPARγ; long-term potentiation; microglia polarization.


Conflict of interest statement

Declaration of conflicting interests: The author(s) declared no potential conflicts of interest concerning the research, authorship, and/or publication of this article.

Figures

Figure 1.
Figure 1.
IL-4 treatment improves long-term cognitive functions after TBI. (a) Illustration of experimental timeline. Mice received intranasal administrations of IL-4 (50 µg/kg) or vehicle starting at 6 h after TBI and repeated daily at 1-7 days and then weekly at 2, 3, and 4 weeks after TBI. Sham, sham surgery group; TBI Veh, vehicle-treated TBI group; TBI IL-4, IL-4-treated TBI group. (b–e) Morris water maze (MWM) test. Representative track plot of learning and memory phases of test (b), the escape latency during cued learning phase pre-TBI and 22-26 days after TBI (c), the number of platform crossings and time spent in target quadrant in the memory test on day 27 (d), and swim speed (e). n = 10 per group. (f) Novel object recognition (NOR) test. Exploration times and discrimination indices were calculated. n = 10, sham group; n = 11 per TBI group. (g) Passive avoidance test. Illustration of test design (left panel). Step-through latency (right panel) was recorded on the test day. n = 12, sham group; n = 14, TBI Veh group; n = 16, TBI IL-4 group. Statistical analyses: Two-way repeated measures ANOVA with Bonferroni post hoc test for c (*p < 0.05; **p < 0.01; ***p < 0.001, TBI Veh vs. Sham; $p < 0.05 TBI IL-4 vs. Sham; ##p < 0.01 TBI Veh vs. TBI IL-4) and f. One-way ANOVA followed by Bonferroni post hoc test for d (target quadrant time) and g. Kruskal-Wallis test with Dunn post hoc for d (platform crossings) and e. Shown are mean ± SD or box plots. *p < 0.05, **p < 0.01, ***p < 0.001 as indicated, ns: no significance.
Figure 2.
Figure 2.
IL-4 treatment promotes the functional and structural integrity of the hippocampus after TBI. (a and b) Electrophysiological analysis of hippocampal LTP at 35 days after TBI or sham surgery. (a) The relationship between field excitatory postsynaptic potential (fEPSP) magnitude and stimulus intensity (in microamperes). (b) Representative traces and cumulative data plots of fEPSP slope (normalized from baseline) prior and up to 60 min after high-frequency stimulation (HFS). n = 6, sham group; n = 5 per TBI group. (c–e) Pearson correlation between fEPSP slope (the final 2-min recording) and learning or memory phase in the Morris water maze (MWM) test (c), latency in the passive avoidance test (d), or exploration time in the novel object recognition (NOR) test (e). n = 4-6 per group. (f–h) Protective effect of IL-4 treatment on hippocampal fiber tracts after TBI, assessed using ex vivo DTI. (f) Left panel: a 3 D reconstruction based on one axial DTI scanning plane that encompasses the hippocampus. The white box depicts the approximate coronal levels for DTI scanning of Schaffer collaterals, and the yellow line indicates the coronal level of AP −2.18 mm. Right panel: A representative 2 D directional color-encoded image showing the dorsal hippocampal formation at the level of AP −2.18 mm. Color hues indicate directions of neural fibers. (g) 3 D reconstruction of DTI images showing the fiber tracts of Schaffer collaterals between CA1 (pink) and CA3 (green) of the hippocampus. (h) Quantification of fiber tract density of two serial sections (AP: −1.58 mm and −2.18 mm). n = 6, sham group; n = 8, TBI Veh group; n = 6, TBI IL-4 group. (i–k) Pearson correlation between density of fiber tracts and learning or memory phase in the MWM test (i), latency in the passive avoidance test (j), or novel object exploration time (% of total exploration time) in the NOR test (k). n = 6–8 per group. Statistical analyses: Two-way repeated measures ANOVA with Bonferroni post hoc test for a and b. One-way ANOVA followed by Bonferroni post hoc test for h. Pearson linear regression analysis for c-e and i-k. Shown are mean ± SD. *p < 0.05, **p < 0.01, ***p < 0.001 as indicated, ns: no significance.
Figure 3.
Figure 3.
IL-4 treatment protects against neuronal loss in hippocampal CA3 after TBI. (a) Representative images of NeuN immunofluorescence (red) showing the regions of interest in CA1 (green rectangle), CA3 (yellow square), and DG (blue square). Scale bar = 1 mm (upper panel) and 50 µm (lower panel). All images are captured from mice sacrificed at 35 days after TBI or sham surgery. (b) Quantification of NeuN+ cells in CA1, CA3, and DG regions at 35 days after TBI or sham surgery. n = 8, sham group; n = 10 per TBI group. (c–e) Pearson correlation between NeuN+ cell counts in CA3 and learning or memory phase in MWM test (c), latency in the passive avoidance test (d), or novel object exploration time in the NOR test (e). n = 8, sham group; n = 10 per TBI group. (f) Representative images of NF200 immunofluorescence (green) in the dorsal hippocampus at 35 days after TBI. The upper left image is a low-power view of the dorsal hippocampus (scale bar = 1 mm), in which the red rectangle depicts where high-power images were captured. The other three images are high-power views of region of interest from different experimental groups as indicated (scale bar = 50 µm). (g) Quantification of relative NF200+ neural fiber intensity in CA1. n = 6 per group. (h–j) Pearson correlation between NF200+ neural fiber intensity and learning or memory phase results in MWM test (h), latency in the passive avoidance test (i), or novel object exploration time in the NOR test (j). n = 6 per group. Statistical analyses: One-way ANOVA followed by Bonferroni post hoc test for b and g. Pearson correlation coefficient analyses for c-e and h-j. Shown are the mean ± SD. *p < 0.05, **p < 0.01, ***p < 0.001 as indicated, ns: no significance.
Figure 4.
Figure 4.
IL-4 polarizes microglia and enhances phagocytosis after TBI. (a) Representative images of triple-label immunofluorescence for Iba1 (gray), CD16 (red), and Arg1 (green) in CA1, CA3, and DG at 7 days after TBI or sham surgery. The region of interest (ROI) depicted by white squares in the second and fourth columns are enlarged and presented in the third and fifth columns, respectively. Scale bar = 50 µm (fourth column) and 10 µm (fifth column). (b and c) Quantification of CD16+/Iba1+ (b) and Arg1+/Iba1+(c) cells in CA1, CA3, and DG after TBI or sham surgery. n = 6 per group. (d) A panel of 40 inflammatory makers were measured in hippocampal extracts at 5 days after TBI or sham surgery. Heatmap showing mean expression levels of 10 makers that were significantly upregulated in TBI Veh brains compared to sham control brains, and that were significantly reduced in TBI IL-4 brains. (e) Representative images of triple-label immunofluorescence for Iba1 (gray), Arg1 (green), and PPARγ (red) in CA3 at 7 days after TBI. The ROI depicted by white squares in the fourth column is enlarged and presented in the fifth column and the Arg1(green) and PPARγ (red) merged images are shown. Scale bar = 50 µm (fourth column) and 10 µm (fifth column). (f) Quantification of PPARγ+/Arg1+/Iba1+ cells in CA3 region. n = 6 per group. (g) Representative images of immunofluorescence for MBP (red) and Iba1 (green) in CA3 at 7 days after TBI. Nuclei were stained with DAPI (blue). The ROIs depicted by white squares in the first column are enlarged (middle column) or 3 D-rendered (right column). Arrowheads point to myelin debris inside the microglia. Scale bar = 2 µm. (h) Quantification of MBP+/Iba1+ cell numbers. n = 6 per group. Statistical analyses: One-way ANOVA followed by Bonferroni post hoc test for b (CA1). Welch ANOVA followed by Dunnett T3 post hoc test for b (CA3 and DG). Brown-Forsythe ANOVA followed Dunnett T3 post hoc for c. Two-way ANOVA with Bonferroni post hoc test for d. Mann-Whitney test for f. Welch’s t-test for h. Shown are the mean ± SD or box plots. #p < 0.05, ##p < 0.01, ###p < 0.001 TBI Veh vs. Sham. *p < 0.05, **p < 0.01, ***p < 0.001, ns: no significance vs. TBI IL-4.
Figure 5.
Figure 5.
PPARγ is obligatory for IL-4-induced microglial polarization after TBI. (a) Generation of tamoxifen inducible Mi/MΦ-specific PPARγ knockout (PPARγ mKO) mice. (b) Representative images of immunofluorescence for Iba1 (green) and PPARγ (red) in CA3 at 7 days after TBI. Nuclei were stained with DAPI (blue). The ROIs depicted by white squares (left column) are enlarged (right column). Scale bar = 50 µm (left column) and 10 µm (right column), respectively. (c) Quantification of PPARγ relative immunofluorescence intensity in CA3 microglia. n = 6, control group; n = 9, mKO group. (d) Representative images of triple-label immunofluorescence for Iba1 (gray), CD16 (red), and Arg1 (green) in CA1, CA3, and DG at 7 days after TBI or sham surgery in PPARγ mKO mice. Iba1 immunofluorescence (gray) from the selected cells (pointed by arrow heads) in the second and third columns is shown in the inserts. Scale bar = 50 µm. For more details, see Supplemental Figure 7(e) and (f). Quantification of CD16+/Iba1+ (e) and Arg1+/Iba1+ (f) cells in CA1, CA3, and DG at 7 days after TBI or sham surgery. n = 6, sham group; n = 5 per mKO TBI group. Statistical analyses: Mann-Whitney test for (c). Brown-Forsythe ANOVA followed by Dunnett T3 post hoc for (e). Kruskal-Wallis with Dunn post hoc for (f). Shown are the mean ± SD or box plots. *p < 0.05, **p < 0.01, ***p < 0.001 as indicated, ns: no significance.
Figure 6.
Figure 6.
PPARγ mKO abolishes IL-4-afforded hippocampal protection. (a) 3D reconstruction of DTI images showing fiber tracts of Schaffer collaterals between CA1 (pink) and CA3 (green) in the hippocampi of PPARγ mKO mice at 35 days after TBI. (b) Quantification of fiber tract density. n = 6, TBI Veh group; n = 4, TBI IL-4 group. (c) Representative images of NF200 immunofluorescence (green) in hippocampal CA1 of PPARγ mKO mice at 35 days after TBI. Scale bar = 50 µm. (d) Quantification of relative NF200+ immunofluorescent signal intensity in CA1. n = 6, mKO sham group; n = 5 per mKO TBI group. (e) Representative images of NeuN immunofluorescence (red) showing the ROIs in CA1 (green rectangle), CA3 (yellow square), and DG (blue square). Scale bar = 1 mm (upper panel) and 50 µm (lower panel). All images are from PPARγ mKO mice at 35 days after TBI or sham surgery. (f) Quantification of NeuN+ cells in CA1, CA3, and DG of PPARγ mKO mice at 35 days after TBI or sham surgery. n = 9, sham group; n = 10, TBI Veh group; n = 12, TBI IL-4 group. (g–i) Pearson correlation between NeuN+ cell counts in CA3 and learning or memory phase in MWM test (g), latency in passive avoidance test (h), or exploration time in NOR test (i). n = 10, TBI Veh group; n = 12, TBI IL-4 group. Statistical analyses: Student’s t-test for (b). Kruskal-Wallis test with Dunn post hoc test for (d) and (f) (DG). One-way ANOVA followed by Bonferroni post hoc test for (f) (CA1, CA3). Pearson correlation coefficient analyses in (g) to (i). Shown are the mean ± SD or box plots. *p < 0.05, **p < 0.01, ***p < 0.001 as indicated, ns: no significance.
Figure 7.
Figure 7.
PPARγ is essential for IL-4-afforded improvement of long-term cognitive functions after TBI. (a–c) Morris water maze test. The escape latency during the cued learning test, pre-TBI and 22-26 days after TBI (a), the number of platform crossings and time spent in target quadrant in the memory test on day 27 (b), and swim speed (c) are presented. n = 12, mKO sham group; n = 13 per mKO TBI group. (d) Passive avoidance test. Step-through latency was recorded on the test day. n = 9, mKO sham group; n = 13, mKO TBI Veh group; n = 13, mKO TBI IL-4 group. (e) Novel object recognition test. Novel object exploration time (upper panel) and discrimination index (lower panel) were calculated. n = 12, mKO sham group; n = 13, mKO TBI Veh group; n = 13, mKO TBI IL-4 group. Statistical analyses: Two-way repeated measures ANOVA with Bonferroni post hoc test for (a), (d), and (e). One-way ANOVA followed by Bonferroni post hoc test for (b) (Target quadrant time) and (c). Kruskal-Wallis test with Dunn post hoc test for (b) (platform crossing count). Shown are the mean ± SD or box plots. *p < 0.05, **p < 0.01, ***p < 0.001 as indicated, ns: no significance.

Similar articles

Cited by

References

    1. Liang X, Yeh CH, Domínguez DJ, et al.. Longitudinal fixel-based analysis reveals restoration of white matter alterations following balance training in young brain-injured patients. Neuroimage Clin 2021; 30: 102621. - PMC - PubMed
    1. Poulin V, Dawson DR, Bottari C, et al.. Managing cognitive difficulties after traumatic brain injury: a review of online resources for families. Disabil Rehabil 2019; 41: 1955–1965. - PubMed
    1. Wang G, Zhang J, Hu X, et al.. Microglia/macrophage polarization dynamics in white matter after traumatic brain injury. J Cereb Blood Flow Metab 2013; 33: 1864–1874. - PMC - PubMed
    1. Wang G, Shi Y, Jiang X, et al.. HDAC inhibition prevents white matter injury by modulating microglia/macrophage polarization through the GSK3β/PTEN/akt axis. Proc Natl Acad Sci U S A 2015; 112: 2853–2858. - PMC - PubMed
    1. Hu X, Liou AK, Leak RK, et al.. Neurobiology of microglial action in CNS injuries: receptor-mediated signaling mechanisms and functional roles. Prog Neurobiol 2014; 119–120: 60–84. - PMC - PubMed

Publication types

MeSH terms