. 2021 Aug 25;6(4):e0039321.
doi: 10.1128/mSphere.00393-21. Epub 2021 Jul 14.

Multidimensional Clinical Surveillance of Pseudomonas aeruginosa Reveals Complex Relationships between Isolate Source, Morphology, and Antimicrobial Resistance

Affiliations

Multidimensional Clinical Surveillance of Pseudomonas aeruginosa Reveals Complex Relationships between Isolate Source, Morphology, and Antimicrobial Resistance

Laura J Dunphy et al. mSphere. .

Abstract

Antimicrobial susceptibility in Pseudomonas aeruginosa is dependent on a complex combination of host and pathogen-specific factors. Through the profiling of 971 clinical P. aeruginosa isolates from 590 patients and collection of paired patient metadata, we show that antimicrobial resistance is associated with not only patient-centric factors (e.g., cystic fibrosis and antipseudomonal prescription history) but also microbe-specific phenotypes (e.g., mucoid colony morphology). Additionally, isolates from different sources (e.g., respiratory tract, urinary tract) displayed rates of antimicrobial resistance that were correlated with source-specific antimicrobial prescription strategies. Furthermore, isolates from the same patient often displayed a high degree of heterogeneity, highlighting a key challenge facing personalized treatment of infectious diseases. Our findings support novel relationships between isolate and patient-level data sets, providing a potential guide for future antimicrobial treatment strategies. IMPORTANCE P. aeruginosa is a leading cause of nosocomial infection and infection in patients with cystic fibrosis. While P. aeruginosa infection and treatment can be complicated by a variety of antimicrobial resistance and virulence mechanisms, pathogen virulence is rarely recorded in a clinical setting. In this study, we discovered novel relationships between antimicrobial resistance, virulence-linked morphologies, and isolate source in a large and variable collection of clinical P. aeruginosa isolates. Our work motivates the clinical surveillance of virulence-linked P. aeruginosa morphologies as well as the tracking of source-specific antimicrobial prescription and resistance patterns.

Keywords: Pseudomonas aeruginosa; antimicrobial resistance; clinical risk factors; infectious disease.


Figures
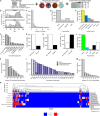
FIG 1
FIG 1
A total of 971 clinical Pseudomonas aeruginosa isolates from 590 patients collected during 1 year at the UVA Health System. (A) Outline of data types collected. (B) Age distributions of 590 patients separated by sex. (C) Histogram of the number of isolates collected per patient. (D) Number of patients with cystic fibrosis or diabetes. (E) Distribution of isolate sources. (F) Distribution of coisolating pathogens identified at the time of P. aeruginosa isolation. Pathogens not in the top 10 most common are accounted for in “Other.” All isolates not shown had no coisolating pathogens on the day of P. aeruginosa isolation. (G) Distribution of mucoid and nonmucoid isolates on blood agar. (H) Distribution of isolates with and without a metallic sheen on blood agar. (I) Distribution of hemolytic and nonhemolytic isolates on blood agar. (J) Distribution of pigment production on cetrimide agar. (K) Number of unique antimicrobials the patient of each isolate was prescribed prior to isolate collection. Multiple prescriptions of the same antimicrobial are counted as a single prescription. (L) Number of isolates from patients prescribed each antimicrobial prior to isolate collection. Multiple prescriptions of the same antimicrobial are counted as a single prescription. Antimicrobial abbreviations can be found in Table S3 and are consistent with those outlined by the American Society for Microbiology with the exception of dapsone (DDS), imipenem/cilastatin (IPMC), metronidazole (MTZ), and rifaximin (RIFX), which were excluded from these guidelines. Antimicrobials prescribed fewer than 20 times were grouped into “Other.” Colors reflect antipseudomonal activity. (M) Distribution of the number of resistant or intermediate antimicrobial susceptibility results per isolate. Susceptibility testing was performed on seven antimicrobials for each isolate. (N) Susceptibility profiles of all isolates and population-level frequencies of resistance or intermediate resistance to each measured antimicrobial. Susceptibility profiles were clustered by Gower distance with complete linkage. Colors reflect susceptibility to each measured antimicrobial (S, susceptible; I, intermediate; R, resistant).
FIG 2
FIG 2
Pairwise relationships between demographic, phenotypic, and antimicrobial susceptibility data. (A) Pearson correlation coefficients between different phenotypic and demographic measurements of all clinical isolates. Asterisks denote BH-corrected P values (*, P < 0.05; **, P < 0.01; ***, P < 0.001). (B) Observed number of coresistant isolates relative to the number that would be expected based on the resistance frequencies of individual antimicrobials, determined for isolates from patients with (bottom) and without (top) CF. Intermediately resistant isolates were considered resistant. Asterisks denote BH-corrected P values from Fisher's exact test for statistical independence (*, P < 0.05; **, P < 0.01; ***, P < 0.001). (C) Adjusted odds ratios between measured features and susceptibility data across all isolates (a ratio of >1 denotes increased odds of resistance; a ratio of <1 denotes decreased odds of resistance). Adjusted odds ratios were calculated from logistic regression models (see Materials and Methods for model descriptions and Data Set S1 for regression coefficients). Asterisks denote BH-corrected P values (*, P < 0.05; **, P < 0.01; ***, P < 0.001).
FIG 3
FIG 3
P. aeruginosa morphologies and antimicrobial susceptibility profiles vary across isolate sources. PCoA of Gower distances between isolate susceptibility profiles and phenotype profiles colored by isolate source (A) and whether a patient had CF (B). Significant differences were calculated by PERMANOVA. Radar plots show the fraction of phenotype-expressing (C) or intermediate and resistant (D) isolates. CF lung isolates (gray, yellow fill), non-CF lung isolates (black, yellow fill), skin/wound isolates (pink), and urine/catheter isolates (blue) are compared.
FIG 4
FIG 4
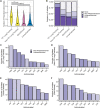
Isolate antimicrobial prescription history varies by source. (A) Number of antimicrobials prescribed prior to isolate collection by source. Multiple prescriptions of the same antimicrobial are considered a single prescription. The crossbar indicates the median number of prescriptions for that isolate source. Pairwise comparisons were made by Wilcoxon rank sum test. Asterisks denote BH-corrected P values (*, P < 0.05; ***, P < 0.001). (B) Frequency of isolates prescribed no antimicrobials, antipseudomonal antimicrobials, nonantipseudomonal antimicrobials, or both antipseudomonal and nonantipseudomonal antimicrobials prior to isolate collection by source. (C to F) Top 10 most common antimicrobials prescribed prior to isolate collection from CF lung/trachea (C), non-CF lung/trachea (D), urine/catheter (E), and skin/wound (F).
FIG 5
FIG 5
Intrapatient isolates display heterogeneous phenotypes and antimicrobial susceptibility profiles. (A to C) Susceptibility and morphological profiles of isolates from patient 348 (A), patient 199 (B), and patient 323 (C) collected over a 1-year period. Patient ages were within 3 years of one another. Isolates are arranged in chronological order of collection with the earliest isolate on top (left labels: L, lung/trachea; E, ENT/sinus). Susceptibility to seven antimicrobials (blue, susceptible; white, intermediate; red, resistant), presence (black) or absence (white) of the mucoid phenotype, metallic sheen, and hemolysis on blood agar, and observed pigment production on cetrimide agar (green, green pigment; blue, blue pigment; brown, mixed pigment; white, no pigment). (D) Key to density of median intrapatient isolate-isolate distances. Dashed lines denote median isolate-isolate distances across all isolate pairs. Aside from population medians, median distances were measured across isolate pairs within isolates from the same patient. Arrows indicate whether patients in a given quadrant have higher (red) or lower (blue) variability in phenotype (first arrow) or susceptibility (second arrow) relative to the whole population. (E) Density of median intrapatient isolate-isolate distances. Gower distances were calculated separately for morphological profiles and susceptibility profiles. Areas of high patient density are shown in yellow. Dashed lines denote the median distances across all isolate pairs. Data for patient 348 (orange), patient 199 (purple), and patient 323 (green) are highlighted. (F) Number of isolates per patient and median isolate-isolate distances.

References

    1. Moradali MF, Ghods S, Rehm BHA. 2017. Pseudomonas aeruginosa lifestyle: a paradigm for adaptation, survival, and persistence. Front Cell Infect Microbiol 7:39. doi:10.3389/fcimb.2017.00039. - DOI - PMC - PubMed
    1. Obritsch MD, Fish DN, MacLaren R, Jung R. 2005. Nosocomial infections due to multidrug-resistant Pseudomonas aeruginosa: epidemiology and treatment options. Pharmacotherapy 25:1353–1364. doi:10.1592/phco.2005.25.10.1353. - DOI - PubMed
    1. Strateva T, Yordanov D. 2009. Pseudomonas aeruginosa—a phenomenon of bacterial resistance. J Med Microbiol 58:1133–1148. doi:10.1099/jmm.0.009142-0. - DOI - PubMed
    1. Lyczak JB, Cannon CL, Pier GB. 2002. Lung infections associated with cystic fibrosis. Clin Microbiol Rev 15:194–222. doi:10.1128/CMR.15.2.194-222.2002. - DOI - PMC - PubMed
    1. Cystic Fibrosis Foundation. 2019. Cystic Fibrosis Foundation patient registry 2018 annual data report. Cystic Fibrosis Foundation, Bethesda, MD. https://www.cff.org/Research/Researcher-Resources/Patient-Registry/2018-....

Publication types

MeSH terms