. 2021 Jul;129(7):77001.
doi: 10.1289/EHP8580. Epub 2021 Jul 14.

Gene-Environment Interactions in Developmental Neurotoxicity: a Case Study of Synergy between Chlorpyrifos and CHD8 Knockout in Human BrainSpheres

Affiliations

Gene-Environment Interactions in Developmental Neurotoxicity: a Case Study of Synergy between Chlorpyrifos and CHD8 Knockout in Human BrainSpheres

Sergio Modafferi et al. Environ Health Perspect. 2021 Jul.

Abstract

Background: Autism spectrum disorder (ASD) is a major public health concern caused by complex genetic and environmental components. Mechanisms of gene-environment (G×E) interactions and reliable biomarkers associated with ASD are mostly unknown or controversial. Induced pluripotent stem cells (iPSCs) from patients or with clustered regularly interspaced short palindromic repeats and CRISPR-associated protein 9 (CRISPR/Cas9)-introduced mutations in candidate ASD genes provide an opportunity to study (G×E) interactions.

Objectives: In this study, we aimed to identify a potential synergy between mutation in the high-risk autism gene encoding chromodomain helicase DNA binding protein 8 (CHD8) and environmental exposure to an organophosphate pesticide (chlorpyrifos; CPF) in an iPSC-derived human three-dimensional (3D) brain model.

Methods: This study employed human iPSC-derived 3D brain organoids (BrainSpheres) carrying a heterozygote CRISPR/Cas9-introduced inactivating mutation in CHD8 and exposed to CPF or its oxon-metabolite (CPO). Neural differentiation, viability, oxidative stress, and neurite outgrowth were assessed, and levels of main neurotransmitters and selected metabolites were validated against human data on ASD metabolic derangements.

Results: Expression of CHD8 protein was significantly lower in CHD8 heterozygous knockout (CHD8+/-) BrainSpheres compared with CHD8+/+ ones. Exposure to CPF/CPO treatment further reduced CHD8 protein levels, showing the potential (G×E) interaction synergy. A novel approach for validation of the model was chosen: from the literature, we identified a panel of metabolic biomarkers in patients and assessed them by targeted metabolomics in vitro. A synergistic effect was observed on the cholinergic system, S-adenosylmethionine, S-adenosylhomocysteine, lactic acid, tryptophan, kynurenic acid, and α-hydroxyglutaric acid levels. Neurite outgrowth was perturbed by CPF/CPO exposure. Heterozygous knockout of CHD8 in BrainSpheres led to an imbalance of excitatory/inhibitory neurotransmitters and lower levels of dopamine.

Discussion: This study pioneered (G×E) interaction in iPSC-derived organoids. The experimental strategy enables biomonitoring and environmental risk assessment for ASD. Our findings reflected some metabolic perturbations and disruption of neurotransmitter systems involved in ASD. The increased susceptibility of CHD8+/- BrainSpheres to chemical insult establishes a possibly broader role of (G×E) interaction in ASD. https://doi.org/10.1289/EHP8580.


Figures

Figure 1A is a set of two western blots. The first western blot plots Chromodomain helicase D N A binding protein 8 homozygous positive and Chromodomain helicase D N A binding protein 8 heterozygous knockout (columns) across Chromodomain helicase D N A binding protein 8, 290 kDa (row). The second western blot plots Chromodomain helicase D N A binding protein 8 homozygous positive and Chromodomain helicase D N A binding protein 8 heterozygous knockout (columns) across Glyceraldehyde 3-phosphate dehydrogenase, 38 kDa (row). Figure 1B is a set of two illustrative images of cells depicting expression of neural progenitor cells marker Sox 2 and Nestin in Chromodomain helicase D N A binding protein 8 homozygous positive and Chromodomain helicase D N A binding protein 8 heterozygous knockout neural progenitor cells cultures prior to induction of differentiation into BrainSpheres. The nuclei were visualized with Hoechst 33342 and the scale bars are 50 micrometers. Figure 1C is timeline divided into two parts, namely, first differentiation step neural progenitor cells formation, including Induced pluripotent stem cells, Embryoid Bodies neural progenitor cells, and neural progenitor cells in monolayer. The second differentiation step Brain organoid formation, including neural progenitor cells in 3 D, 2 wk, 4 wk with chlorpyrifos or oxon-metabolite for 24 hours, and 8 wk with chlorpyrifos or oxon-metabolite for 24 hours.
Figure 1.
CHD8+/+ and CHD8+/ NPC characterization. Scheme of BrainSphere differentiation. Prior differentiation to BrainSpheres, NPCs were expanded in monolayers and characterized. (A) CHD8 protein levels in CHD8+/ vs. CHD8+/+ NPCs analyzed by western blot. (B) Representative images showing expression of the NPC markers Sox2 (green) and Nestin (red) in CHD8+/+ and CHD8+/ NPC cultures prior to induction of differentiation into BrainSpheres. The nuclei were visualized with Hoechst 33342. Scale bar: 50μm. (C) Differentiation and toxicant treatment scheme. Note: CPF, chlorpyrifos; CPO, oxon-metabolite of chlorpyrifos; EB, embryoid bodies; NPC, neural progenitor cell; 3D, three dimensional.
Figures 2A and 2B are error bar graphs, plotting Viability, percentage to control, ranging from 0 to 200 in increments of 50 (y-axis) across chlorpyrifos (micromolar) for 4 wk and 8 wk (x-axis) for not significant and discovery of effect by genetics or discovery of effects by exposure and not significant and discovery of effect by genetics or discovery of effects by exposure, discovery of effects by Gene by Environment interaction, respectively. Under 4 and 8 wk, Chromodomain helicase D N A binding protein 8 homozygous positive and Chromodomain helicase D N A binding protein 8 heterozygous knockout is observed, respectively. The Chromodomain helicase D N A binding protein 8 homozygous positive and Chromodomain helicase D N A binding protein 8 heterozygous knockout range from 0 to 47 in increments of 46 and 47 to 100 in increments of 53, respectively. Figure 2C is a clustered bar graph, plotting percentage of acetylcholinesterase, ranging from 0 to 300 in increments of 100 (y-axis) across Chromodomain helicase D N A binding protein 8 homozygous positive and Chromodomain helicase D N A binding protein 8 heterozygous knockout for Dimethyl sulfoxide, chlorpyrifos, and oxon-metabolite (x-axis), respectively for discovery of effects by exposure. Figures 2D, 2E, and 2F are error bar graphs plotting acetylcholinesterase messenger ribonucleic acid log to the base 2 of (uppercase f c), ranging from negative 6 to 2 in increments of 2; percentage of Acetylcholine, ranging from 1 to 10 in increments of 9, 10 to 100 in increments of 90, 100 to 1,000 in increments of 900, and 1,000 to 10,000 in increments of 9,000; and percentage of Choline, ranging from 10 to 100 in increments of 90 (y-axis) across Chromodomain helicase D N A binding protein 8 homozygous positive and Chromodomain helicase D N A binding protein 8 heterozygous knockout for Dimethyl sulfoxide, chlorpyrifos, and oxon-metabolite (x-axis) for discovery of effect by genetics; discovery of effect by genetics, discovery of effects by exposure, and discovery of effects by Gene by Environment interaction; and discovery of effect by genetics and discovery of effects by exposure, respectively.
Figure 2.
Cell viability and AChE activity after exposure to CPF or CPO. Resazurin reduction assay in 47 and 100μM (A) CPF- and (B) CPO-treated CHD8+/+ (gray) and CHD8+/ (white) BrainSpheres for 24 h at 4 and 8 wk of differentiation. The data represents three independent experiments with three technical replicates each (9 replicates in total, and 6 for 8-wk CPO treatment) normalized to DMSO vehicle-treated controls. Corresponding summary data are shown in Table S7. Asterisks after E, G, and I denote discovery of two-way ANOVA with posttest multiple comparisons for exposure effect between CHD8+/+ and CHD8+/ BrainSpheres by the two-stage linear step-up procedure of Benjamini, Krieger, and Yekutieli and a desired false discovery rate (FDR) of 0.05. *p<0.05, **p<0.01, ***p<0.001. (C) AChE activity: the data represent the AChE activity normalized to the protein amount in each sample (mean±SEM, three independent experiments, *p<0.01, ****p<0.0001); (D) mRNA expression (five independent experiments, with 7 technical replicates in total, *p<0.05, **p<0.01); intracellular levels of (E) acetylcholine and (F) choline measured at 4 wk of differentiation in CHD8+/+ and CHD8+/ spheroids after exposure to 100μM CPF (dark gray) and 100μM CPO (light gray). DMSO vehicle-treated controls are depicted in white. Acetylcholine and choline were measured by LC-MS/MS in three independent experiments (12 technical replicates in total). Data were normalized to DMSO vehicle-treated CHD8+/+ controls. Discovery of effect by genetics or by exposure or by (G×E) interaction on the metabolite levels was based on a two-way ANOVA with posttest multiple comparisons to *CHD8+/+ DMSO or #CHD8+/ DMSO by the two-stage linear step-up procedure of Benjamini, Krieger, and Yekutieli and a desired FDR of 0.01. *p<0.01, ****p<0.0001. Corresponding summary data are shown in Tables S8 and S10. Note: AChE, acetylcholinesterase; ANOVA, analysis of variance; CPF, chlorpyrifos; CPO, oxon-metabolite of chlorpyrifos; DMSO, dimethyl sulfoxide; E, discovery of effect by exposure; G, discovery of effect by genetics; G×E, gene–environment; I, discovery of effects by G×E; n.s., not significant; SEM, standard error of the mean.
Figure 3A is a set of two line graphs titled Chromodomain helicase D N A binding protein 8 homozygous positive and Chromodomain helicase D N A binding protein 8 heterozygous knockout, plotting number of intersections, ranging from 0 to 250 in increments of 50 (y-axis) across Radius, ranging from 300 to 1,000 in increments of 100 and 400 to 1,000 in increments of 100 (x-axis) for Dimethyl sulfoxide, chlorpyrifos, and oxon-metabolite with tocopherol, respectively. Figure 3B is an error bar graph, plotting Area under the curve, ranging as 0, 2 times 10 begin superscript 4 end superscript, 4 times 10 begin superscript 4 end superscript, 6 times 10 begin superscript 4 end superscript, 8 times 10 begin superscript 4 end superscript, and 1 times 10 begin superscript 5 end superscript (y-axis) across Chromodomain helicase D N A binding protein 8 homozygous positive and Chromodomain helicase D N A binding protein 8 heterozygous knockout (x-axis) for Dimethyl sulfoxide, chlorpyrifos, and oxon-metabolite with tocopherol. Figure 3C is a display of three columns, namely, Dimethyl sulfoxide, chlorpyrifos, and oxon-metabolite plus tocopherol of cells and two rows, namely, Chromodomain helicase D N A binding protein 8 homozygous positive and Chromodomain helicase D N A binding protein 8 heterozygous knockout of cells. Below, a tabular representation has four main columns and three rows, namely, Area under the curve, Control, chlorpyrifos, and oxon-metabolite with vitamin E. The Control, chlorpyrifos, and oxon-metabolite with vitamin E columns each are subdivided into three columns, namely, Mean, standard deviation, and uppercase n.
Figure 3.
Neurite outgrowth upon 100μM CPF treatment and co-treatment with 100μM tocopherol. (A) Sholl analysis of neurite outgrowth in CHD8+/+ and CHD8+/ showing number of intersections (neurite density) starting from the edge of the spheroid. Each curve represents the mean±SEM from 8 to 12 spheroids. (B) Area under the curve (AUC), calculated for each condition shown in (A). **p<0.01 and *** p<0.001, one-way ANOVA with Holm-Sidak’s posttest. (C) Representative images for each treatment. Scale bar: 200μm. Note: ANOVA, analysis of variance; CPF, chlorpyrifos; DMSO, dimethyl sulfoxide; SD, standard deviation; SEM, standard error of the mean; Vit. E, tocopherol.
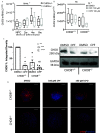
Figures 4A and 4B are box plots titled time and not significant, plotting Chromodomain helicase D N A binding protein 8 messenger ribonucleic acid (2 begin superscript negative uppercase delta cycle threshold end superscript, ranging as 0 to 1 times 10 begin superscript negative 2 end superscript, 2 times 10 begin superscript negative 2 end superscript, and 3 times 10 begin superscript negative 2 end superscript (y-axis) across weeks of differentiation, including neural progenitor cells, 2 wk, 4 wk, and 8 wk and Chromodomain helicase D N A binding protein 8 homozygous positive and Chromodomain helicase D N A binding protein 8 heterozygous knockout (x-axis) for Chromodomain helicase D N A binding protein 8 homozygous positive and Chromodomain helicase D N A binding protein 8 heterozygous knockout and discovery of effect by genetics: Dimethyl sulfoxide, chlorpyrifos 100 micromolar, and oxon-metabolite 100 micromolar, respectively. Figure 4C is a set of one clustered bar graph and western blot. The clustered bar graph is plotting Chromodomain helicase D N A binding protein 8 percentage integrated density, ranging from 0 to 100 in increments of 50 (y-axis) across Chromodomain helicase D N A binding protein 8 homozygous positive and Chromodomain helicase D N A binding protein 8 heterozygous knockout for Dimethyl sulfoxide and chlorpyrifos (x-axis) for discovery of effects by Gene by Environment interaction, discovery of effect by genetics, and discovery of effects by exposure, respectively. The western blot plots Chromodomain helicase D N A binding protein 8 homozygous positive and Chromodomain helicase D N A binding protein 8 heterozygous knockout for Dimethyl sulfoxide and chlorpyrifos (columns) across Chromodomain helicase D N A binding protein 8 290 kDa and Glyceraldehyde 3-phosphate dehydrogenase 38 kDa (rows). Figure 4D is a display of three columns, namely, Dimethyl sulfoxide, 100 micromolar chlorpyrifos, and 100 micromolar oxon-metabolite and two rows, namely, Chromodomain helicase D N A binding protein 8 homozygous positive and Chromodomain helicase D N A binding protein 8 heterozygous knockout.
Figure 4.
CHD8 expression upon CPF/CPO treatment. (A) CHD8 gene expression in course of differentiation (four independent experiments). (B) CHD8 gene expression in CHD8+/+ and CHD8+/ BrainSpheres exposed to CPF/CPO (four independent experiments). (C) Western Blot quantification of CHD8 protein in CHD8+/+ and CHD8+/ BrainSpheres treated with CPF. CHD8 protein level was normalized to GAPDH and is expressed as a percentage of CHD8+/+ DMSO vehicle-treated control BrainSpheres. Dendrogram is shown as means±SEMs (five independent experiments). Statistical significance was calculated by two-way ANOVA with posttest multiple comparisons to *CHD8+/+ DMSO or #CHD8+/ DMSO by the two-stage linear step-up procedure of Benjamini, Krieger, and Yekutieli and a desired false discovery rate of 0.05. *p<0.05, **p<0.01, ***p<0.001, ****p<0.0001. A representative blot is shown on the right side of (C). (D) Immunostaining of CHD8+/+ and CHD8+/ BrainSpheres with CHD8 antibody (red) after CPF or CPO exposure. Representative images from three experiments are shown. Nuclei are stained with Hoechst 33342 (blue). Scale bar: 100μm. Summary data (mean, SEM, N) are shown in Table S9. Note: ANOVA, analysis of variance; CPF, chlorpyrifos; CPO, oxon-metabolite of chlorpyrifos; DMSO, dimethyl sulfoxide; E, discovery of effect by exposure; G, discovery of effect by genetics; G×E, gene–environment; GADPH, glyceraldehyde-3-phosphate dehydrogenase; I, discovery of effect by (G×E) interaction; MS, mass spectrometry; NPC, neural progenitor cell; ns, not significant; SEM, standard error of the mean.
Figure 5A is a set of four error bar graphs, plotting percentage of S-adenosylmethionine, ranging from 0 to 400 in increments of 100; percentage of S-adenosylhomocysteine, ranging from 0 to 600 in increments of 200; percentage of S-adenosylmethionine to S-adenosylhomocysteine ratio, ranging from 0 to 3 in unit increments; and percentage of folic acid, ranging from 0 to 400 in increments of 100 (y-axis) across Chromodomain helicase D N A binding protein 8 homozygous positive and Chromodomain helicase D N A binding protein 8 heterozygous knockout with Dimethyl sulfoxide, chlorpyrifos, and oxon-metabolite (x-axis) for discovery of effect by genetics and discovery of effects by exposure, discovery of effects by genetics, discovery of effects by genetics and discovery of effects by exposure, and discovery of effects by exposure, respectively. Figure 5B is a set of two error bar graphs, plotting percentage of L-Alanine, ranging from 0 to 400 in increments of 100, and percentage of lactic acid, ranging from 0 to 800 in increments of 200 (y-axis) across Chromodomain helicase D N A binding protein 8 homozygous positive and Chromodomain helicase D N A binding protein 8 heterozygous knockout with Dimethyl sulfoxide, chlorpyrifos, and oxon-metabolite (x-axis) for discovery of effects by exposure and discovery of effect by genetics and discovery of effects by exposure, respectively. Figure 5C is a set of two error bar graphs, plotting percentage of Tryptophan and percentage of Kynurenic Acid, ranging from 0 to 400 in increments of 100 (y-axis) across Chromodomain helicase D N A binding protein 8 homozygous positive and Chromodomain helicase D N A binding protein 8 heterozygous knockout with Dimethyl sulfoxide, chlorpyrifos, and oxon-metabolite (x-axis) for discovery of effect by genetics and discovery of effects by exposure, respectively. Figure 5D is an error bar graph, plotting percentage of D-a-Hydroxyglutaric acid, ranging from 0 to 2,000 in increments of 500 (y-axis) across Chromodomain helicase D N A binding protein 8 homozygous positive and Chromodomain helicase D N A binding protein 8 heterozygous knockout with Dimethyl sulfoxide, chlorpyrifos, and oxon-metabolite (x-axis) for discovery of effects by exposure.
Figure 5.
Effects of CHD8 mutation and CPF/CPO exposure on key adverse outcome pathways of ASD. (A) Methyl donor system: SAM, SAH, SAM/SAH ratio, and folic acid. (B) l-alanine and lactic acid, (C) tryptophan and KA, and (D) α-hydroxyglutaric acid levels were measured by LC-MS/MS. DMSO vehicle-treated controls are depicted in white, CPF-treated in dark gray, and CPO in light gray. Data are normalized to DMSO vehicle-treated CHD8+/+ control and represent results from three independent experiments (12 technical replicates in total, 8 for KA). Discovery of effect by genetics or by exposure was based on a two-way ANOVA with posttest multiple comparisons to *CHD8+/+ DMSO or #CHD8+/ DMSO by the two-stage linear step-up procedure of Benjamini, Krieger, and Yekutieli and a desired false discovery rate of 0.01. *,#p<0.01, ***p<0.001, ****p<0.0001. Summary data (mean, SD, SEM, N) are shown in Table S10. Note: ANOVA, analysis of variance; ASD, autism spectrum disorder; CPF, chlorpyrifos; CPO, oxon-metabolite of chlorpyrifos; DMSO, dimethyl sulfoxide; E, discovery of effect by exposure; G, discovery of effect by genetics; KA, kynurenic acid; LC, liquid chromatography; MS/MS, tandem mass spectrometry; SAM, S-adenosylmethionine; SAH, S-adenosylhomocysteine; SD, standard deviation; SEM, standard error of the mean.
Figures 6A to 6C are a set of three error bar graphs, plotting (Figure 6A) percentage of Glutamate, ranging from 10 to 100 in increments of 90 and 100 to 1,000 in increments of 900; (Figure 6B) percentage of gamma-aminobutyric acid, ranging from 10 to 100 in increments of 90 and 100 to 1,000 in increments of 900; and (Figure 6C) percentage of glycine to gamma-aminobutyric acid ratio, ranging from 0.1 to 1 in increments of 0.9 and 1 to 10 in increments of 9 (y-axis) across Chromodomain helicase D N A binding protein 8 homozygous positive and Chromodomain helicase D N A binding protein 8 heterozygous knockout with dimethyl sulfoxide, chlorpyrifos, and oxon-metabolite (x-axis) for discovery of effects by exposure, discovery of effect by genetics, and discovery of effect by genetics, respectively.
Figure 6.
Excitatory/inhibitory neurotransmitters detection in CHD8+/+ and CHD8+/ BrainSpheres after CPF/CPO exposure. (A) Glutamate and (B) GABA levels and (C) their ratio in CHD8+/ vs. CHD8+/+ BrainSpheres treated with CPF (dark gray), CPO (light gray), or vehicle (white) were assessed by LC-MS/MS. Data from three independent experiments (12 technical replicates in total) normalized to DMSO vehicle-treated CHD8+/+ controls is shown. Discovery of effect by genetics or by exposure was based on a two-way ANOVA with posttest multiple comparisons to *CHD8+/+ DMSO or #CHD8+/ DMSO by the two-stage linear step-up procedure of Benjamini, Krieger, and Yekutieli and a desired false discovery rate of 0.01. *,#p<0.01, ****p<0.0001. Summary data (mean, SD, SEM, N) are shown in Table S10. Note: ANOVA, analysis of variance; CPF, chlorpyrifos; CPO, oxon-metabolite of chlorpyrifos; DMSO, dimethyl sulfoxide; E, discovery of effect by exposure; G, discovery of effect by genetics; GABA, gamma-aminobutyric acid; Glu, Glutamate; Gly, glycine; LC, liquid chromatography; MS/MS, tandem mass spectrometry; SD, standard deviation; SEM, standard error of the mean.
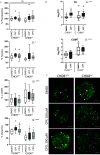
Figure 7A is a set of four error bar graphs, plotting percentage of Phenylalanine, ranging from 0 to 250 in increments of 50, percentage of Tyrosine, ranging from 0 to 250 in increments of 50, percentage of Levodopa, ranging from 0 to 400 in increments of 100, and percentage of dopamine, ranging from 0 to 200 in increments of 50 (y-axis) across Chromodomain helicase D N A binding protein 8 homozygous positive and Chromodomain helicase D N A binding protein 8 heterozygous knockout with Dimethyl sulfoxide, chlorpyrifos, and oxon-metabolite (x-axis) for not significant, discovery of effects by exposure, discovery of effect by genetics, and discovery of effect by genetics, respectively. Figure 7B is a set of two error bar graphs titled tyrosine hydroxylase and catechol-O-methyltransferase, plotting log to the base 2 of (uppercase f c), ranging from negative 5 to 10 in increments of 5 and from negative 2 to 4 in unit increments (y-axis) across Chromodomain helicase D N A binding protein 8 homozygous positive and Chromodomain helicase D N A binding protein 8 heterozygous knockout with Dimethyl sulfoxide, chlorpyrifos, and oxon-metabolite (x-axis) for discovery of effects by exposure and discovery of effect by genetics, respectively. Figure 7C is a display of two columns, namely, Chromodomain helicase D N A binding protein 8 homozygous positive and Chromodomain helicase D N A binding protein 8 heterozygous knockout and three rows, namely, Dimethyl sulfoxide, chlorpyrifos 100 micromolar, and oxon-metabolite 100 micromolar.
Figure 7.
Perturbations of the dopaminergic system in CHD8+/+ vs. CHD8+/ BrainSpheres after CPF/CPO treatment. (A) Levels of phenylalanine, tyrosine, l-DOPA, and dopamine were measured by LC-MS/MS. Data from three independent experiments (12 technical replicates in total) normalized to DMSO vehicle-treated CHD8+/+ controls is shown. Discovery of effect by genetics or by exposure was based on a two-way ANOVA with posttest multiple comparisons to CHD8+/+ DMSO by the two-stage linear step-up procedure of Benjamini, Krieger, and Yekutieli and a desired false discovery rate (FDR) of 0.01. *p<0.01, ****p<0.0001. (B) RT-PCR of tyrosine hydroxylase (TH) and catechol-O-methyltransferase (COMT) in both cell lines treated with CPF. Data represent log2(2ΔΔCt) of at least three independent experiments with 11 to 16 technical replicates in total. Discovery of effect by genetics or by exposure was based on a two-way ANOVA with posttest multiple comparisons to CHD8+/+ DMSO by the two-stage linear step-up procedure of Benjamini, Krieger, and Yekutieli and a desired FDR of 0.05. *p<0.05, ***p<0.001, ****p<0.0001. (C) Immunohistochemistry with anti-TH–specific antibody (green) of CHD8+/+ and CHD8+/ BrainSpheres treated with CPF/CPO. White arrowheads indicate neuronal-shaped cells, blue arrows indicate flat clusters of cells. Nuclei were stained with Hoechst 33342 (blue). Scale bar: 100μm. Summary data (mean, SD, SEM, N) are shown in Tables S9 and S10. Note: ANOVA, analysis of variance; CPF, chlorpyrifos; CPO, oxon-metabolite of chlorpyrifos; DMSO, dimethyl sulfoxide; E, discovery of effect by exposure; G, discovery of effect by genetics; LC, liquid chromatography; l-DOPA, 1-3,4-dihydroxypyhenylalanine (or levodopa); MS/MS, tandem mass spectroscopy; ns, not significant; RT-PCR, real-time polymerase chain reaction; SD, standard deviation; SEM, standard error of the mean.

Comment in

References

    1. Aldred S, Moore KM, Fitzgerald M, Waring RH. 2003. Plasma amino acid levels in children with autism and their families. J Autism Dev Disord 33(1):93–97, PMID: 12708584, 10.1023/A:1022238706604. - DOI - PubMed
    1. Aldridge JE, Meyer A, Seidler FJ, Slotkin TA. 2005. Alterations in central nervous system serotonergic and dopaminergic synaptic activity in adulthood after prenatal or neonatal chlorpyrifos exposure. Environ Health Perspect 113(8):1027–1031, PMID: 16079074, 10.1289/ehp.7968. - DOI - PMC - PubMed
    1. Arnold GL, Hyman SL, Mooney RA, Kirby RS. 2003. Plasma amino acids profiles in children with autism: potential risk of nutritional deficiencies. J Autism Dev Disord 33(4):449–454, PMID: 12959424, 10.1023/a:1025071014191. - DOI - PubMed
    1. Astashkina A, Grainger DW. 2014. Critical analysis of 3-D organoid in vitro cell culture models for high-throughput drug candidate toxicity assessments. Adv Drug Deliv Rev 69–70:1–18, PMID: 24613390, 10.1016/j.addr.2014.02.008. - DOI - PubMed
    1. Ayhan F, Konopka G. 2019. Regulatory genes and pathways disrupted in autism spectrum disorders. Prog Neuropsychopharmacol Biol Psychiatry 89:57–64, PMID: 30165121, 10.1016/j.pnpbp.2018.08.017. - DOI - PMC - PubMed

Publication types

MeSH terms