. 2021 Jul 14:10:e67436.
doi: 10.7554/eLife.67436.

Single-cell analysis of the ventricular-subventricular zone reveals signatures of dorsal and ventral adult neurogenesis

Affiliations

Single-cell analysis of the ventricular-subventricular zone reveals signatures of dorsal and ventral adult neurogenesis

Arantxa Cebrian-Silla et al. Elife. .

Abstract

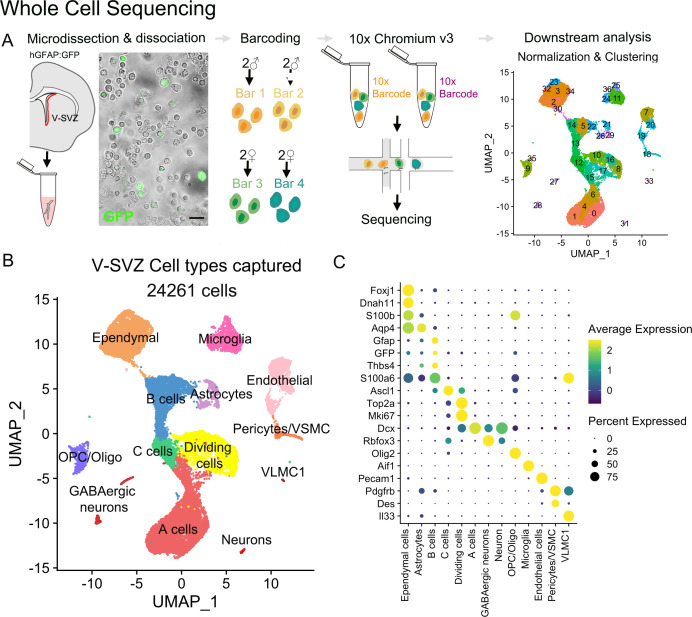
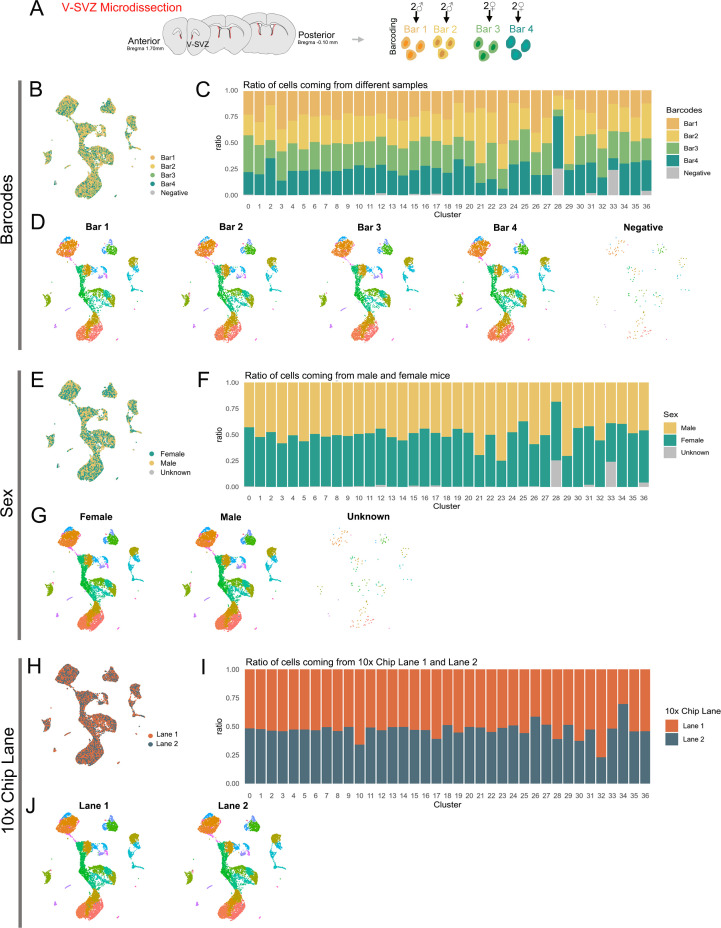
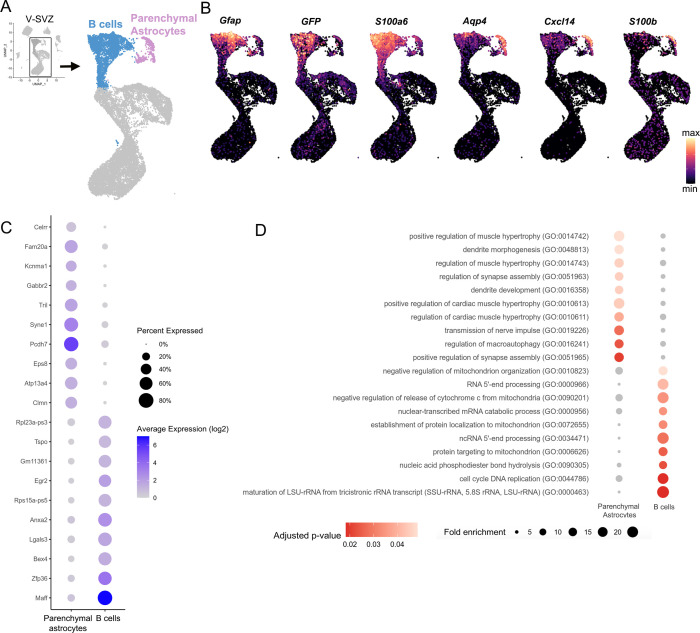
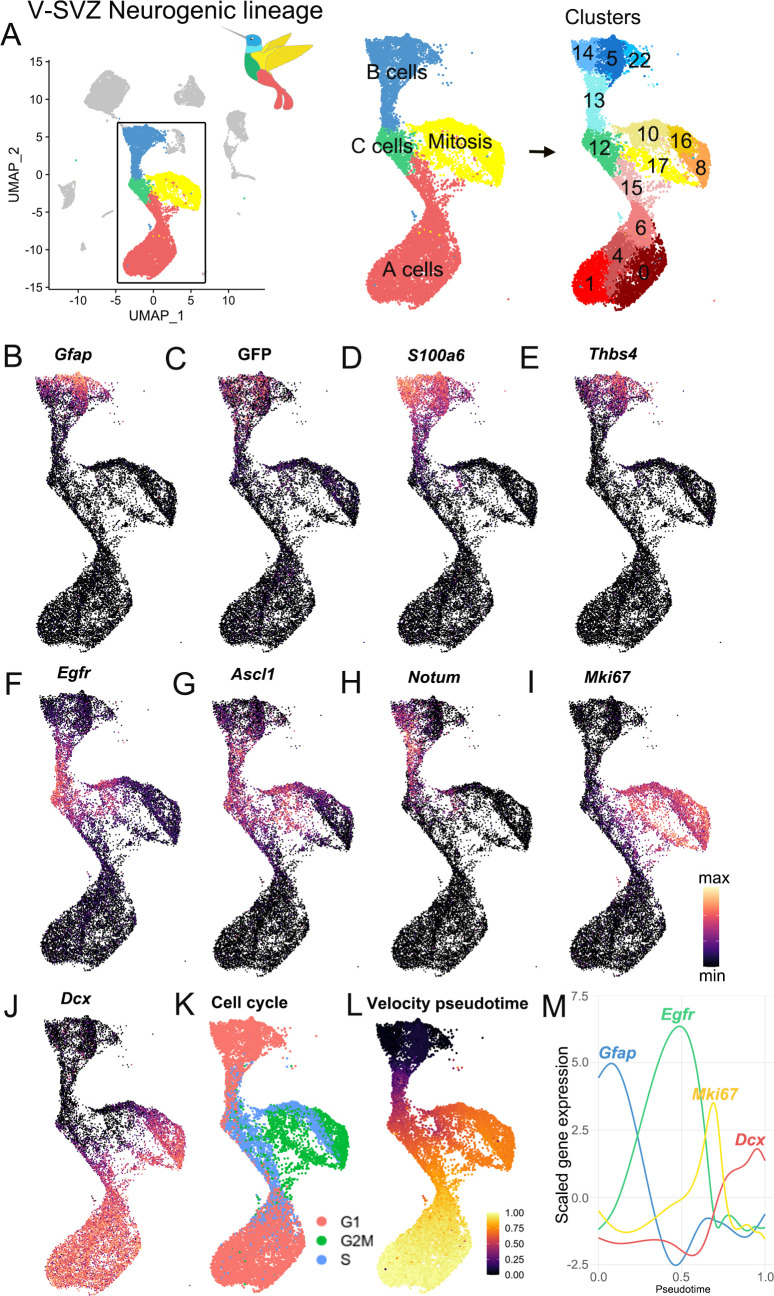
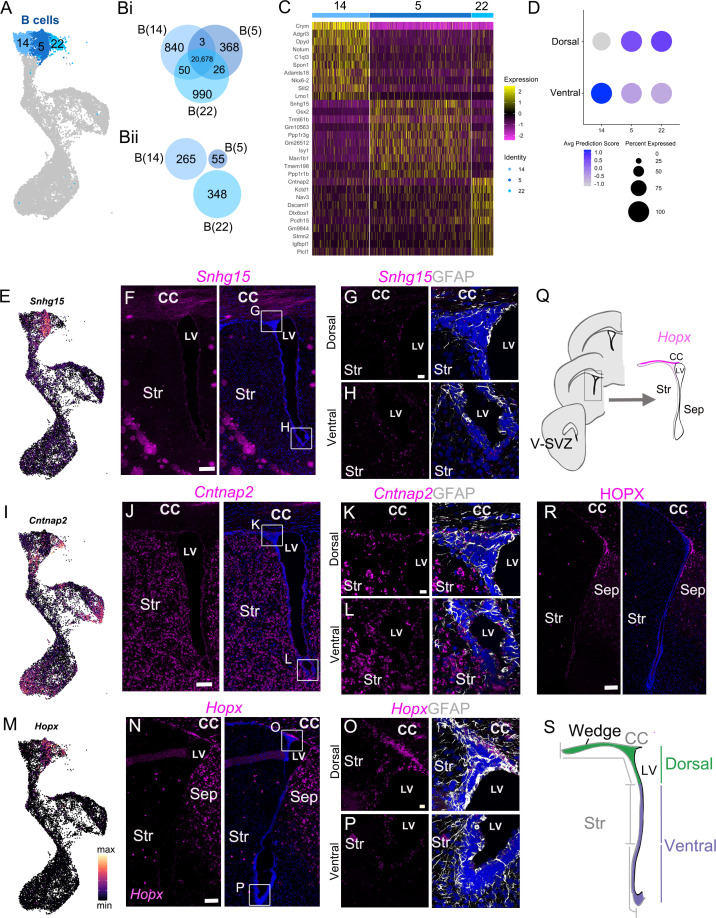
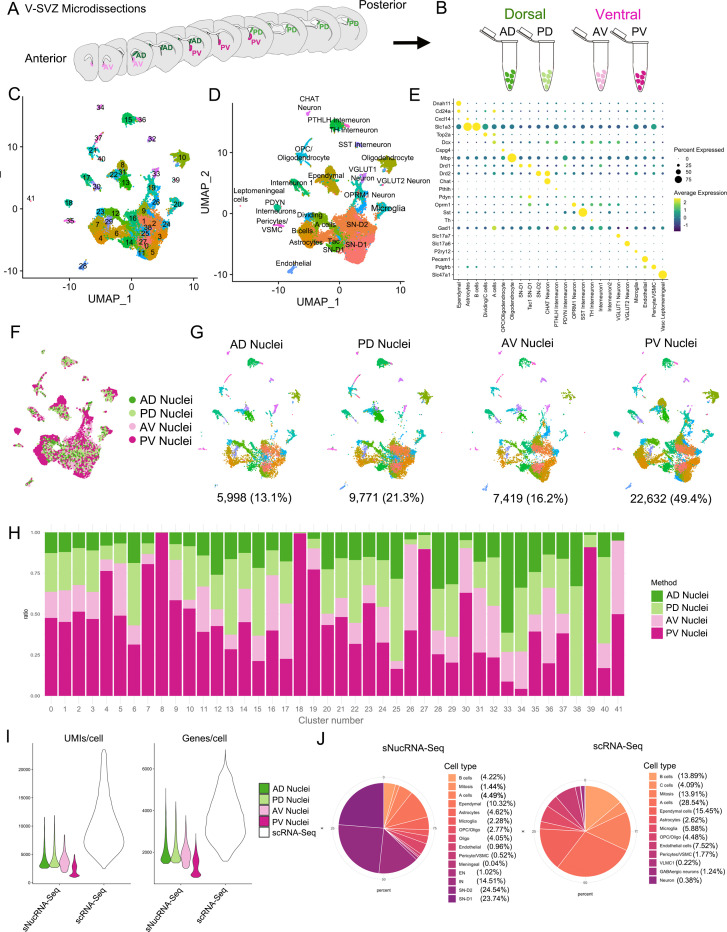
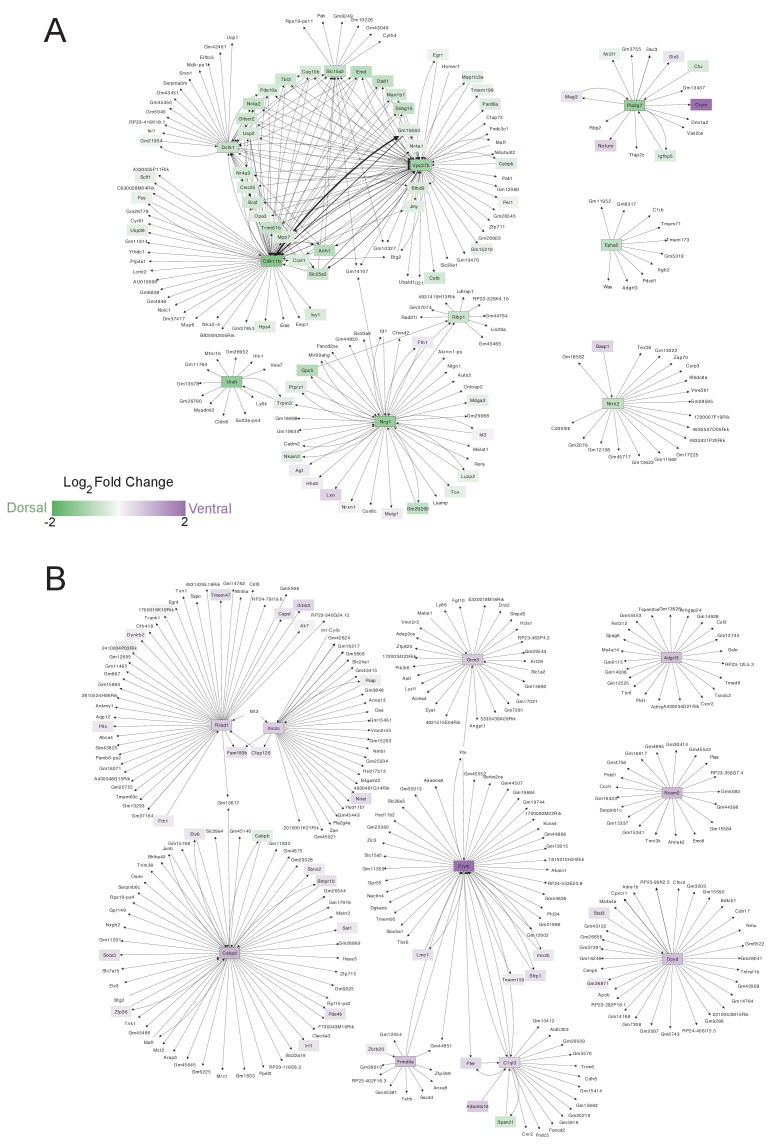
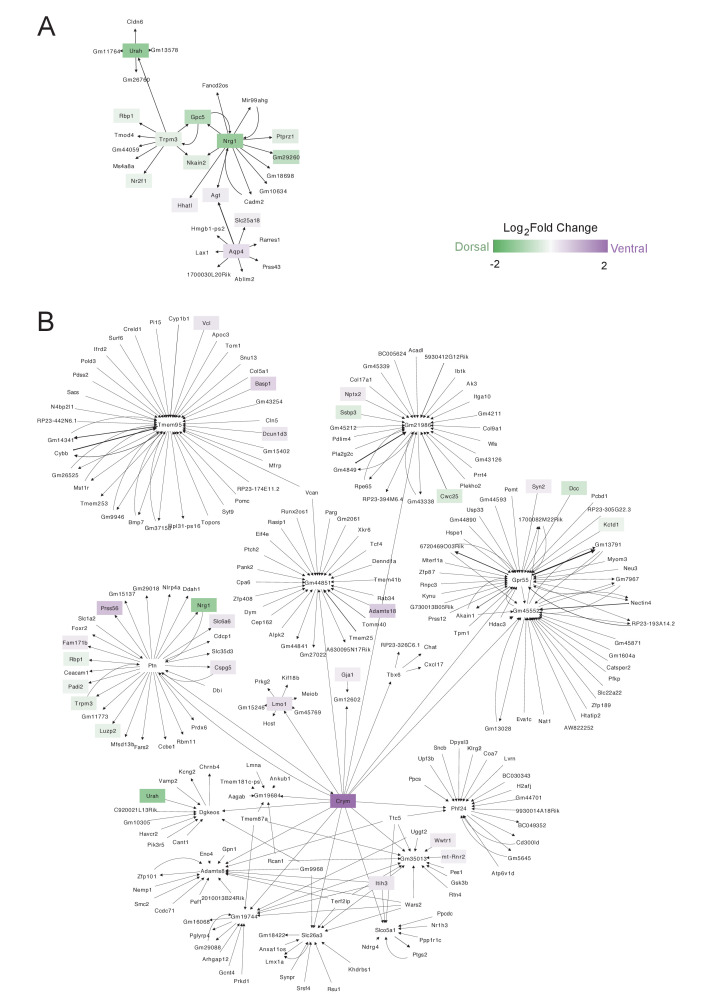
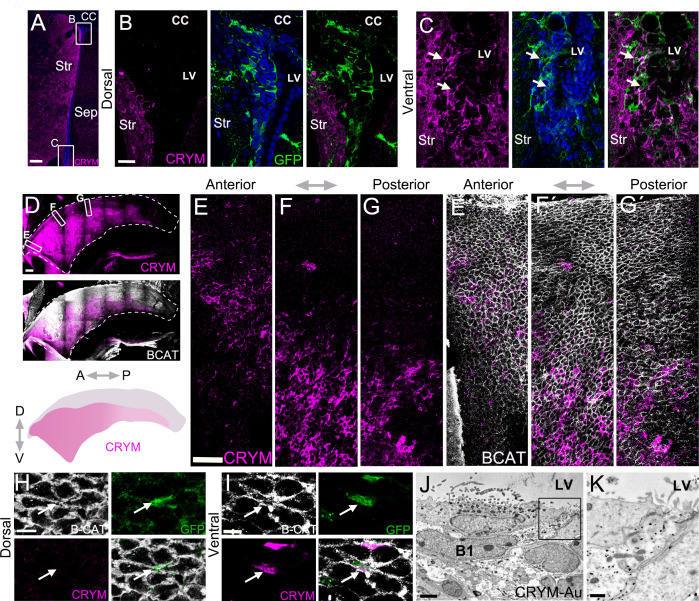
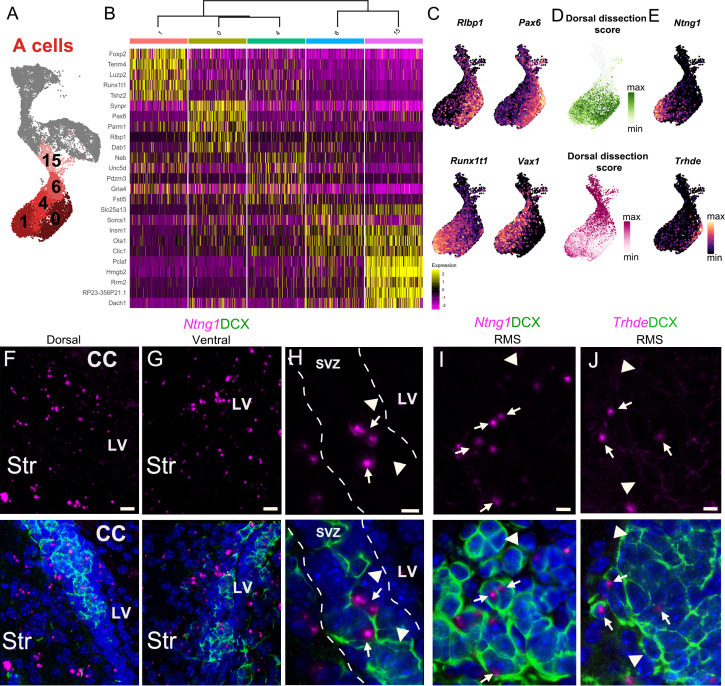
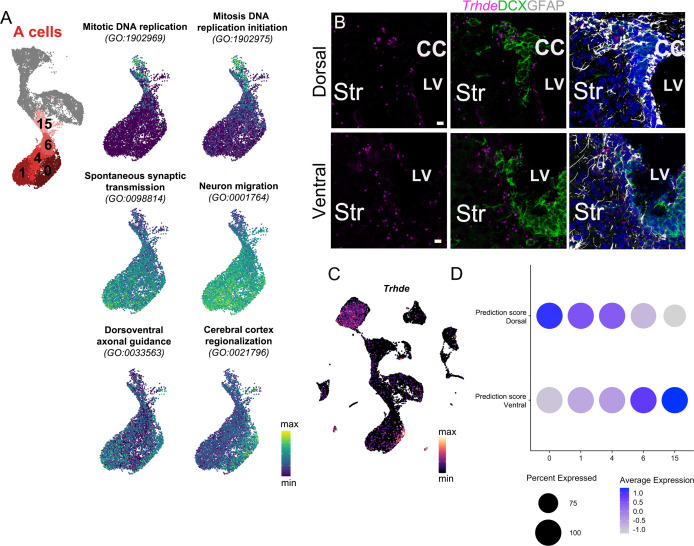
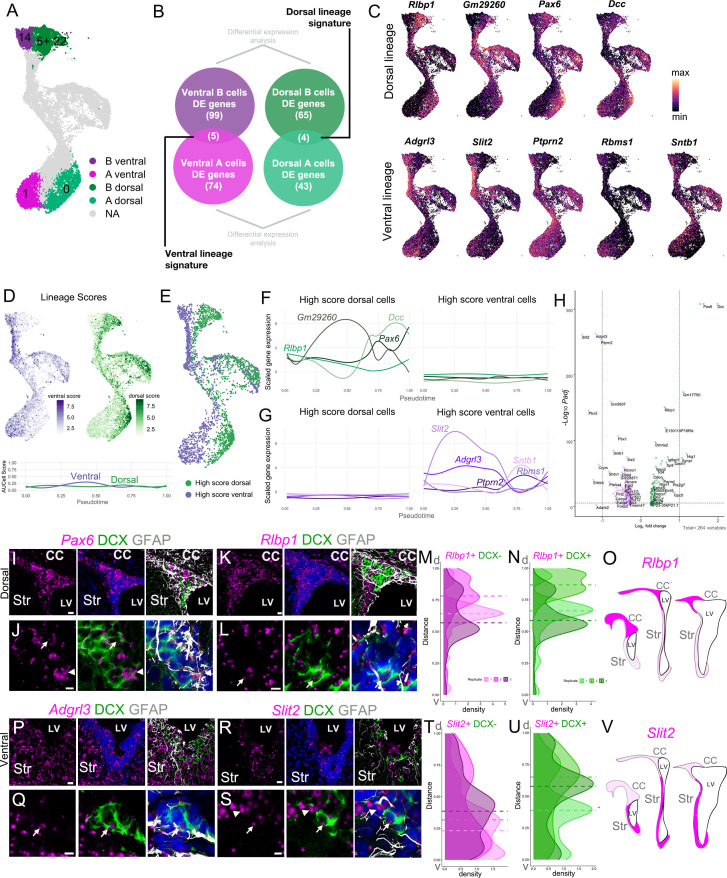
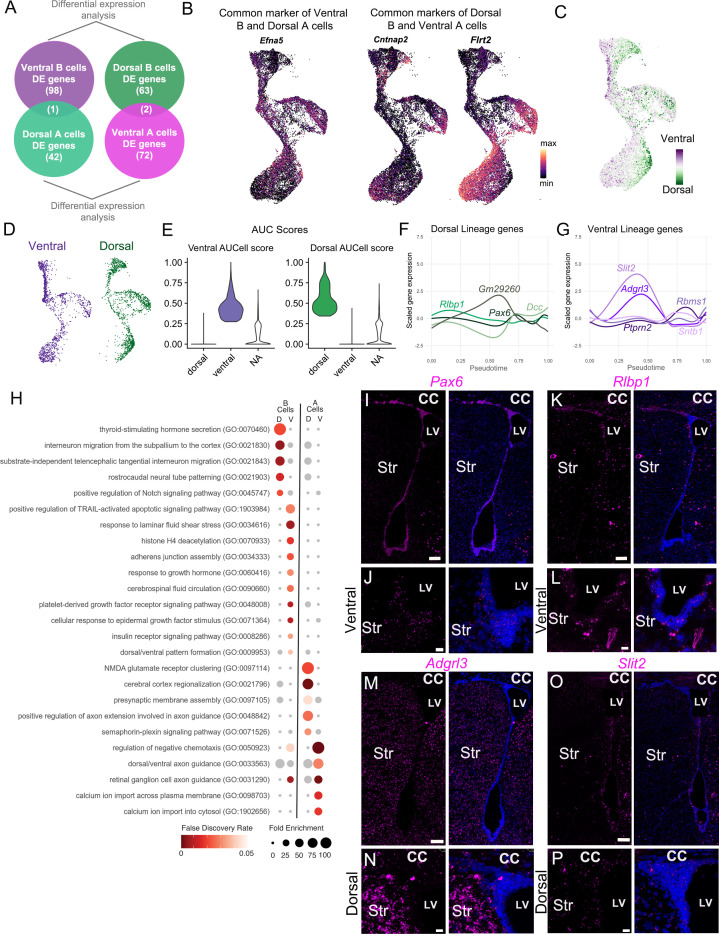
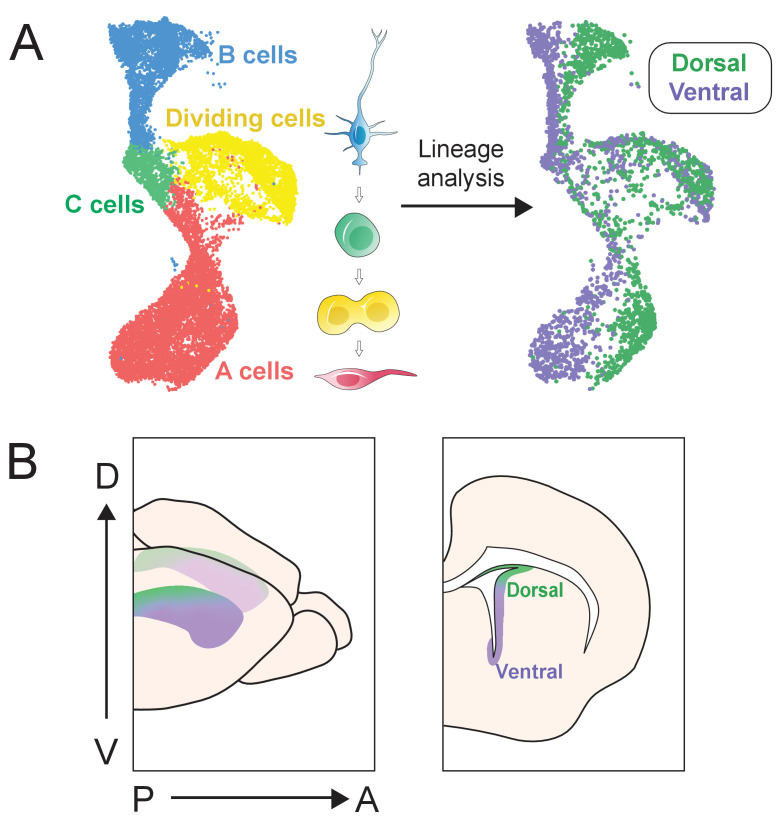
The ventricular-subventricular zone (V-SVZ), on the walls of the lateral ventricles, harbors the largest neurogenic niche in the adult mouse brain. Previous work has shown that neural stem/progenitor cells (NSPCs) in different locations within the V-SVZ produce different subtypes of new neurons for the olfactory bulb. The molecular signatures that underlie this regional heterogeneity remain largely unknown. Here, we present a single-cell RNA-sequencing dataset of the adult mouse V-SVZ revealing two populations of NSPCs that reside in largely non-overlapping domains in either the dorsal or ventral V-SVZ. These regional differences in gene expression were further validated using a single-nucleus RNA-sequencing reference dataset of regionally microdissected domains of the V-SVZ and by immunocytochemistry and RNAscope localization. We also identify two subpopulations of young neurons that have gene expression profiles consistent with a dorsal or ventral origin. Interestingly, a subset of genes are dynamically expressed, but maintained, in the ventral or dorsal lineages. The study provides novel markers and territories to understand the region-specific regulation of adult neurogenesis.

Keywords: adult neurogenesis; mouse; neuroblast; neuroscience; olfactory bulb; regenerative medicine; regional differences; single-cell sequencing; stem cell; stem cells.

Plain language summary

Nerve cells, or neurons, are the central building blocks of brain circuits. Their damage, death or loss of function leads to cognitive decline. Neural stem/progenitor cells (NSPCs) first appear during embryo development, generating most of the neurons found in the nervous system. However, the adult brain retains a small subpopulation of NSPCs, which in some species are an important source of new neurons throughout life. In the adult mouse brain the largest population of NSPCs, known as B cells, is found in an area called the ventricular-subventricular zone (V-SVZ). These V-SVZ B cells have properties of specialized support cells known as astrocytes, but they can also divide and generate intermediate ‘progenitor cells’ called C cells. These, in turn, divide to generate large numbers of young ‘A cells’ neurons that undertake a long and complex migration from V-SVZ to the olfactory bulb, the first relay in the central nervous system for the processing of smells. Depending on their location in the V-SVZ, B cells can generate different kinds of neurons, leading to at least ten subtypes of neurons. Why this is the case is still poorly understood. To examine this question, Cebrián-Silla, Nascimento, Redmond, Mansky et al. determined which genes were expressed in B, C and A cells from different parts of the V-SVZ. While cells within each of these populations had different expression patterns, those that originated in the same V-SVZ locations shared a set of genes, many of which associated with regional specification in the developing brain. Some, however, were intriguingly linked to hormonal regulation. Salient differences between B cells depended on whether the cells originated closer to the top (‘dorsal’ position) or to the bottom of the brain (‘ventral’ position). This information was used to stain slices of mouse brains for the RNA and proteins produced by these genes in different regions. These experiments revealed dorsal and ventral territories containing B cells with distinct ‘gene expression’. This study highlights the heterogeneity of NSPCs, revealing key molecular differences among B cells in dorsal and ventral areas of the V-SVZ and reinforcing the concept that the location of NSPCs determines the types of neuron they generate. Furthermore, the birth of specific types of neurons from B cells that are so strictly localized highlights the importance of neuronal migration to ensure that young neurons with specific properties reach their appropriate destination in the olfactory bulb. The work by Cebrián-Silla, Nascimento, Redmond, Mansky et al. has identified sets of genes that are differentially expressed in dorsal and ventral regions which may contribute to regional regulation. Furthering the understanding of how adult NSPCs differ according to their location will help determine how various neuron types emerge in the adult brain.


Conflict of interest statement

AC, MN, SR, BM, DW, KO, RR, SG, JG, DL No competing interests declared, AÁ Cofounder and on the Scientific Advisory Board of Neurona Therapeutics.

Figures

Figure 1.
Figure 1.. Whole-cell sequencing captures the cellular diversity and activation cascade of the adult neurogenic niche.
(A) Schematic of the whole-cell single-cell isolation and sequencing protocol (scRNA-Seq). The lateral wall of the lateral ventricles were microdissected from young adult hGFAP:GFP mouse brains (n=four males, n=four females). Four samples were multiplexed with MULTI-seq barcodes and combined together. Two 10x Chromium Controller lanes were loaded as technical replicates, and cells were sequenced and processed for downstream analysis (Figure 1—figure supplement 1). V-SVZ: Ventricular-Subventricular zone. (B) UMAP plot of scRNA-Seq cell types captured after demultiplexing and doublet removal. (C) Dot plot of cell-type-specific marker expression in the clusters from (B) (Figure 1—figure supplement 2).
Figure 1—figure supplement 1.
Figure 1—figure supplement 1.. Biological and technical replicate metadata of the scRNA-Seq dataset.
(A) Diagram representing V-SVZ microdissected areas (red). The V-SVZ was microdissected from 1 mm brain slices from anterior (bregma 1.70) to Posterior bregma (−0.10 mm) regions. Single-cell suspensions from two female samples and two male samples were multiplexed with MULTI-seq barcodes (Bar1-4). (B) UMAP plot of sequenced cells after demultiplexing and quality control filtering, color-coded by MULTI-seq barcode. Cells with no detectable barcode are labeled ‘Negative’. (C) Ratio of cells within each cluster (see Figure 1A, right panel) coming from each Barcode sample. (D) UMAP plots of cells separated by Barcode number and color-coded by cluster number (see Figure 1A, right panel). (E) UMAP plot of sequenced cells color-coded by animal sex: Female cells (green) correspond to Barcodes 3 and 4 combined, male cells (tan) correspond to Barcodes 1 and 2 combined. Cells with no detectable barcode are labeled ‘Unknown’ (gray). (F) Ratio of cells within each cluster (see Figure 1A, right panel) coming from male (tan) or female (green) mice, or of unknown origin (gray). (G) UMAP plots of cells separated by animal sex and color-coded by cluster number (see Figure 1A, right panel). (H) UMAP plot of sequenced cells color-coded by 10x Chromium Controller Chip lane (equivalent to ‘batch’, or technical replicate): Lane 1 (orange) or Lane 2 (navy). (I) Ratio of cells within each cluster (see Figure 1A, right panel) coming from Lane 1 (orange) or Lane 2 (navy). (J) UMAP plots of cells separated by Lane and color-coded by cluster number (see Figure 1A, right panel).
Figure 1—figure supplement 2.
Figure 1—figure supplement 2.. Transcriptomic profile of B cells versus Parenchymal Astrocytes.
(A) UMAP plot of V-SVZ neurogenic lineage cells (blue) and parenchymal astrocytes (purple) isolated from the scRNA-Seq dataset (inset, boxed area). (B) Gene expression of B cell-enriched markers Gfap, GFP, S100a6, and parenchymal astrocyte-enriched markers Aqp4, Cxcl14, S100b. (C) Dot plot of the top ten differentially expressed Parenchymal Astrocytes and B cell cluster markers. (D) Dot plot of significantly over-represented Gene Ontology (GO) terms identified by gene set enrichment analysis using differentially expressed Parenchymal astrocytes and B cell genes.
Figure 2.
Figure 2.. Characterization of the scRNA-Seq V-SVZ neurogenic lineage.
(A) The neurogenic lineage has a ‘bird-like’ shape, with B cells forming the head (blue), C cells in the body (green), dividing cells in the wing (yellow), and A cells in the tail (red). These are divisible into 14 distinct clusters, including 4 B cell clusters, 1 C cell cluster, 4 clusters of dividing cells, and 5 A cell clusters (right). (B-J). Gene expression captures progression along the lineage, with canonical markers of each stage expressed in its corresponding region of the UMAP plot. (K) Scoring cells by phase of the cell cycle reveals cells in G2M and S phase occupying the wing of the bird. (L-M). Pseudotime calculated by RNA velocity recapitulates the B to C to A trajectory along the neurogenic lineage. (M) Genes associated with B cells (Gfap), activated B and C cells (Egfr), mitosis (Mki67), and A cells (Dcx) peak in expression at corresponding stages in the lineage.
Figure 3.
Figure 3.. scRNAseq reveals regional heterogeneity among adult neural stem cells.
(A-C) UMAP plots of Nkx2.1 (A), Gsx2 (B), and Emx1 (C) expression in the scRNA-Seq neurogenic lineage (see also Figure 3—figure supplement 1). (D) Schematic of the region identity prediction calculation, where anchor gene sets (dashed gray lines) are calculated between Ventral Dissection (magentas) and Dorsal Dissection (greens) sNucRNA-Seq B cell nuclei and scRNAseq B cells (blues) and each scRNAseq B cell is given a Dorsal or Ventral Dissection predicted identity score (see also Figure 3—figure supplement 2). (E) The net predicted identity scores of each scRNA-Seq B cell plotted in UMAP space, where strongly Dorsal Dissection predicted identity cells are dark green, and strongly Ventral Dissection predicted identities are dark magenta. Dark gray cells were not included in the analysis. (F) Dot plot of the average Dorsal or Ventral Dissection predicted identity scores for scRNA-Seq B cell clusters B(14) and B(5+22). (G) UMAP plot of B cell cluster identities used in the following analysis: B(14) (light blue) and B(5+22) (dark blue). (H) (i) Venn diagram summarizing differential gene expression analysis between clusters B(14) (light blue) and B(5+22) (dark blue). (ii) Numbers of candidate marker genes identified after selecting significantly upregulated genes expressed in no more than 40% of cells of the other cluster. (I) Heatmap depicting expression of the top 10 differentially expressed genes between clusters B(14) (left) and B(5+22) (right). (J) UMAP plot of Dio2 expression in the scRNA-Seq neurogenic lineage. (K - L) Confocal micrographs of Dio2 RNA (magenta), S100b (green), and GFAP (white) protein expression in the dorsal (K) and ventral (L) V-SVZ. (M-N). Quantification of DAPI+, S100ß- Dio2 RNAscope puncta along the length of the V-SVZ (0 = ventral-most extent, 1 = dorso-lateral-most extent of the wedge) with the median puncta distribution location plotted as a horizontal line for each sample (n=3, each indicated by a different shade, ~ bregma 1.18, 0.98 and 0.62 mm). N. Summary schematic of Dio2 expression in three rostro-caudal coronal sections (~bregma 1.50, 0.98 and 0.14 mm); strong expression (magenta); sparse (light magenta). Boxed areas denote locations of dorsal (K) and ventral (L) high-magnification images. (O) UMAP plot of Urah expression in the scRNA-Seq neurogenic lineage. (P - Q) Confocal micrographs of Urah RNA (magenta), S100b (green), and GFAP (white) protein expression in the dorsal (P) and ventral (Q) V-SVZ. (R-S) Quantification of DAPI+, S100ß- Urah RNAscope puncta along the length of the V-SVZ (0 = ventral-most extent, 1 = dorso-lateral-most extent of the wedge) with the median puncta distribution location plotted as a horizontal line for each sample (n=3, each indicated by a different shade, bregma~ 1.34, 1.18 and 0.98 mm). S. Summary schematic of Urah expression in three rostro-caudal coronal sections (~bregma 1.50, 0.98 and 0.14 mm); strong expression (magenta); sparse (light magenta). Boxed areas denote locations of dorsal (P) and ventral (Q) high-magnification images. T UMAP plot of Crym expression in the scRNA-Seq neurogenic lineage. (U-V) Confocal micrographs of Crym RNA (magenta), DCX (green), and GFAP (white) protein expression in the dorsal (U) and ventral (V) V-SVZ. (W-X). Quantification of DAPI+,S100B- Crym RNAscope puncta along the length of the V-SVZ (as in M: 0 = ventral-most extent, 1 = dorso-lateral-most extent of the wedge; n=3, bregma~ 1.42, 1.18 and 0.98 mm). X. Summary schematic of Crym expression in three rostro-caudal coronal sections (~bregma 1.50, 0.98 and 0.14 mm); strong expression (magenta); low expression (white). Boxed areas denote locations of dorsal (U) and ventral (V) high-magnification images. DAPI: blue, LV: lateral ventricle, d: dorsal, v: ventral, CC: corpus callosum, Str: striatum. Scale bars: 10 μm (K, L, P, Q, U, and V).
Figure 3—figure supplement 1.
Figure 3—figure supplement 1.. Identification of quiescent B cell clusters.
(A) UMAP plot of B cell cluster identities used in the following analysis: B(14), B(5), and B(22). (B) i Venn diagram summarizing differential gene expression analysis between clusters B(14), B(5), and B(22). ii Numbers of candidate marker genes identified after selecting significantly upregulated genes expressed in no more than 40% of cells of the other cluster. (C) Heatmap depicting expression of the top 10 differentially expressed genes between clusters B(14) (left), B(5) (center), and B(22) (right). (D) Dot plot of the average Dorsal or Ventral Dissection predicted identity scores for scRNA-Seq B cell clusters B(14), B(5), and B(22). (E) UMAP plot of Snhg15 expression in the scRNA-Seq neurogenic lineage. (F) Confocal micrograph of Snhg15 RNA (magenta) expression in the V-SVZ. Insets denote locations of high magnification images (G) and (H). (G-H) High magnification of dorsal (G) and ventral (H) V-SVZ regions denoted in (F) showing Snhg15 RNA (magenta) and GFAP protein (white) expression. (I) UMAP plot of Cntnap2 expression in the scRNA-Seq neurogenic lineage. (J) Confocal micrograph of Cntnap2 RNA (magenta) expression in the V-SVZ. Insets denote locations of high-magnification images (K) and (L). (K - L) High magnification of dorsal (K) and ventral (L) V-SVZ regions denoted in (J) showing Cntnap2 RNA (magenta) and GFAP protein (white) expression. (M) UMAP plot of Hopx expression in the scRNA-Seq neurogenic lineage. (N) Confocal micrograph of Hopx RNA (magenta) expression in the V-SVZ. Insets denote locations of high magnification images (O) and (P). (O - P) High magnification of dorsal (O) and ventral (P) V-SVZ regions denoted in (N) showing Cntnap2 RNA (magenta) and GFAP protein (white) expression. (Q) Summary schematic of anterior to posterior coronal brain sections analyzed (left) and one of the V-SVZ regions (boxed area on left, enlarged on right). Hopx expression is summarized as strong (magenta), sparse (light magenta), or absent (white) in different subregions of the V-SVZ. (R) Confocal micrograph of HOPX protein expression (magenta) in the V-SVZ. (S) Schematic of a coronal section of the lateral ventricle (LV) showing dorsal (green) and ventral (purple) domains and bins (gray) defined for quantifications. The dorsal bin (1) included the wedge and the dorsal V-SVZ exposed to the ventricle as indicated. The two ventral bins (2 and 3) were defined as the remaining V-SVZ on the lateral wall, equally divided in two. DAPI: blue, LV: lateral ventricle, CC: corpus callosum, Str: striatum. Scale bars: 100 μm (F, J, H, and R) 10 μm (G, H, K, L, O, and P).
Figure 3—figure supplement 2.
Figure 3—figure supplement 2.. Characterization of the sNucRNA-Seq dataset.
(A) Diagram representing the four V-SVZ microdissected regions: Anterior ventral (AV, pink), anterior dorsal (AD, dark green), posterior ventral (PV, magenta), and posterior dorsal (PD, light green). (B) Single nucleus suspensions from each region were processed as separate samples in parallel. (C) UMAP plot of sequenced nuclei after quality control filtering, color-coded by cluster number. (D) UMAP plot of sNucRNA-Seq cell types. (E) Dot plot of cell-type-specific marker expression in the clusters from (D). (F) UMAP plot of sequenced cells color-coded by region: AD (green), PD (light green), AV (pink), and PV (magenta). (G) UMAP plots of nuclei separated by region and color-coded by cluster number (see panel C). Below each plot is the number of nuclei and the percent of the total dataset originating from each region. (H) Ratio of nuclei within each cluster (see panel C) coming from each region sample. (I) Violin plot of the number of unique molecular identifiers (UMIs) detected per nucleus or cell (left panel), and number of genes detected per cell (right panel) in each sNucRNA-Seq region and in the scRNA-Seq dataset (white). Median UMIs: 9181scRNA-Seq/3,062sNucRNA-Seq, a threefold difference. Median genes: 3549scRNA-Seq/1,679sNucRNA-Seq, a 2.1-fold difference). (J) Pie charts of cell types represented in sNucRNA-Seq (left) and scRNA-Seq datasets (right). The scRNA-Seq dataset contains 60.4% neurogenic lineage cells (shades of orange; 14,660/24,261 total cells), compared to 10.6% in the sNucRNA-Seq dataset (4859/45,820 total nuclei). Conversely, the sNucRNA-Seq dataset contains 61.5% neurons (shades of purple; 28,185 nuclei, 13 subtypes (panel D), while the scRNA-Seq contains only 1.6% (395 cells, three subtypes; Figure 1A–B). The scRNA-Seq and sNucRNA-Seq datasets each contain 37.9% (9206 cells) and 25.1% (11,480 nuclei) glial cells, respectively (shades of plum). Cell types listed in each pie chart legend are plotted in order, clockwise from coordinate 0.
Figure 3—figure supplement 3.
Figure 3—figure supplement 3.. Gene Regulatory networks of dorsal and ventral B cell markers.
(A-B) Networks of predicted regulatory relationships (by GENIE3, visualized with Cytoscape) between (A) the top 10 markers of putative dorsal B cells (B(5+22)) and all transcripts expressed in B(5+22) or (B) the top 10 markers of putative ventral cells (B(14)) and all transcripts expressed in B(14). Color scale represents log2 fold change between B(5+22) and B(14), with genes upregulated in B(5+22) in green and genes upregulated in B(14) in purple. Black outlines demarcate the top 10 differentially expressed genes used to construct each network. Arrow thickness corresponds to the weight of the link between each pair of nodes. (A) The core dorsal network contains highly connected nodes including cell-cycle gene Cdk11b and Vps37b, as well as all three members of the nuclear receptor subfamily 4a (Nr4a1, Nr4a2, Nr4a3), steroid-thyroid hormone receptors. Interestingly, Pla2g7 in dorsal cells is predicted to (likely negatively) regulate the ventral marker Crym. (B) In the ventral network, two genes related to ciliary positioning (Cfap186) and neuronal survival (Fam183b) link two ventral markers and their corresponding regulatory modules. Three smaller, isolated networks are predicted to form around ventral marker genes. One large network forms around Crym, which we analyze in greater detail in Figure 3—figure supplement 4.
Figure 3—figure supplement 4.
Figure 3—figure supplement 4.. Urah and Crym-associated gene regulatory networks in dorsal and ventral B cells.
(A-B) Network of predicted regulatory relationships between (A) Urah and all genes in putative dorsal B cells or (B) Crym and all genes in putative ventral cells. Color scale represents log2 fold change in B(5+22) vs. B(14) for significantly differentially expressed genes. Arrow thickness corresponds to the weight of the link between each pair of nodes. Color scale represents log2 fold change between B(5+22) and B(14), with genes upregulated in B(5+22) in green and genes upregulated in B(14) in purple. Black outlines demarcate the top 10 differentially expressed genes used to construct each network. Arrow thickness corresponds to the weight of the link between each pair of nodes. (A) The main Urah-associated regulatory network forms around channel-related genes including Trpm3, Nkain2, and Nrg1. (B) Crym is predicted to regulate ventral marker Lmo1. Additionally, Ptn is at the center of a regulatory module that contains both dorsally and ventrally enriched genes, indicating that it may have a role in balancing the expression of genes important to both dorsal and ventral B cells.
Figure 4.
Figure 4.. Whole mounts reveal CRYM expression in a wide ventral domain.
(A-C) Confocal micrograph of a hGFAP:GFP coronal mouse brain section, where the V-SVZ is immunostained for GFP (green) and CRYM (magenta). B. High-magnification image of the dorsal wedge region of the V-SVZ. (C) High-magnification image of the ventral V-SVZ. (D-G) Immunostaining of CRYM (magenta) in a whole-mount preparation of the lateral wall of the V-SVZ, co-stained with β-CATENIN (white), with a summary schematic depicting the extent of the CRYM+ domain. (E–G) Higher magnification images of boxed regions in (D) showing the distribution of CRYM+ (magenta) in V-SVZ cells outlined by β-CATENIN (white). (H-I) High-magnification images of GFP+ (green) B1 cell-containing pinwheels in the dorsal (H) and ventral (I) V-SVZ outlined by β-CATENIN (white), also immunostained for CRYM (magenta). Quantifications showed that 95.11% ± 2.65 (SD) of the GFP+ B1 cells were CRYM+ in the ventral domain of the V-SVZ. In contrast, only 4.71% ± 1.38 (SD) of the GFP+ B1 cells in the dorsal region were CRYM+ (n=3; T-test, p<0.0001). (J-K) Immunogold transmission electron micrographs of CRYM+ B1 cell in the V-SVZ. K. High magnification of B1 cell apical contact with the lateral ventricle. A: anterior, P: posterior, D: dorsal, V: ventral. Scale bars: 150 μm (A), 20 μm (B and C), 200 μm (D), 50 μm (E, F and G), 10 μm (H and I), 2 μm (J), and 500 nm (K).
Figure 5.
Figure 5.. A cell cluster heterogeneity is linked to regionally organized dorsal/ventral domains.
(A) A cells are organized in five distinct clusters (1, 0, 4, 6, and 15). (B) Heatmap showing the top five differentially expressed genes for each of the five clusters. (C) The expression patterns of Rlbp1 and Runx1t1 are similar to Vax1 and Pax6, respectively, which are genes known to be enriched in ventral and dorsal domains of the V-SVZ. (D) The predicted regional dissection scores of each scRNA-Seq A cell plotted in UMAP space: cells with strong Dorsal Dissection prediction scores are green and strong Ventral Dissection prediction scores are dark magenta. (E) Expression patterns of marker genes Ntng1 and Trhde in A cells. (F-H) Expression of Ntng1 RNA (magenta) and DCX protein (green) in the dorsal (F) and ventral (G) V-SVZ, and high magnification of Ntng1-positive A cells (arrows) and Ntng1-negative A cells (arrowheads) in the V-SVZ (dotted lines) (see also Figure 5—figure supplement 1). (I) High magnification of Ntng1 puncta in DCX+ A cells (arrows), and Ntng1-negative A cells (arrowheads) in the RMS. (J) High-magnification image of Thrde RNA (magenta) in DCX+ A cells (arrows), along with Thrde-negative DCX+ A cells (arrowheads) in the RMS. DAPI: blue, RMS: rostral migratory stream, LV: lateral ventricle, CC: corpus callosum, Str: striatum. Scale bars: 10 μm (F and G), 5 μm (H, I, and J).
Figure 5—figure supplement 1.
Figure 5—figure supplement 1.. Characterization of A cell clusters.
(A) UMAP plot of A cell clusters, and UMAP plots of only A cell clusters labeled with AUCell scores of combined gene expression of genes contained in each of the six GO categories shown. (B) Trhde expression (magenta) in the dorsal (top row) and ventral (bottom row) V-SVZ, co-labeled with DCX (green) and GFAP (white) immunostaining. (C) Trhde expression in the full scRNA-Seq dataset. (D) Dot plot of the average Dorsal and Ventral Dissection prediction scores for each of the A cell clusters 0, 1, 4, 6, and 15. DAPI: blue, LV: lateral ventricle, CC: corpus callosum, Str: striatum. Scale bar: 10 μm (B).
Figure 6.
Figure 6.. Regional transcriptional signatures are maintained along the neurogenic lineage.
(A) UMAP plot highlighting the putative dorsal and ventral B and A cell clusters. (B) Schematic illustrating the approach to identify genes that are differentially enriched in dorsal B and A, and ventral B and A cells, comparing B(14) to A(1) and B(5) and B(22) to A(0). (C) Expression patterns of dorsal (top row) and ventral markers (bottom row) identified as differentially enriched throughout the B-C-A lineage. (D) Cell scores based on the combined expression of genes in the ventral lineage signature (ventral score; purple) and genes in the dorsal lineage signature (dorsal score; green) throughout the neurogenic lineage. Lineage scores, as the combined expression of genes of the dorsal and ventral signatures, remain relatively constant throughout all cells along the neurogenic lineage. (E) High Score (top quartile of each lineage score) dorsal (green) and ventral (purple) cells in the neurogenic lineage. (F) Expression of dorsal signature genes in High Score dorsal (left) and High Score ventral cells (right) along the neurogenic lineage progression, assessed by pseudotime (see also Figure 6—figure supplement 1). (G) Expression of ventral signature genes in High Score dorsal (left) and High Score ventral cells (right) along the neurogenic lineage progression, assessed by pseudotime. (H) Volcano plot of significantly differentially expressed genes between High Score dorsal and High Score ventral neurogenic lineages. (I - J) RNAscope validation of dorsal lineage marker Pax6 (magenta) with DCX (green) and GFAP (white) immunostaining. High-magnification images of the V-SVZ dorsal wedge (I). J. High-magnification image of the V-SVZ where Pax6 colocalizes with an A cell (arrow) and B cell (arrowhead) (see also Figure 6—figure supplement 1). (K- L) RNAscope validation of dorsal lineage marker Rlbp1 (magenta) in the dorsal wedge (K). L. High-magnification images of Rlbp1 in the dorsal V-SVZ, where puncta are visible in a DCX-positive A cell (arrow). (M-O) Quantifications of DAPI+,DCX- (M) or DAPI+,DCX+ (N) Rlbp1 RNAscope puncta along the length of the V-SVZ (0 = ventral-most extent, 1 = dorso-lateral-most extent of the wedge) with the median puncta distribution location plotted as a horizontal line for each sample (n=3, each indicated by a different shade, ~ bregma 1.34, 1.18, and 0.98 mm). (O) Summary schematic of Rlbp1 expression in three rostro-caudal coronal sections (~bregma 1.50, 0.98, and 0.14 mm); strong expression (magenta); sparse (light magenta). Note that Pax6 showed a similar distribution. (P-Q) RNAscope validation of ventral lineage marker Adgrl3 (magenta) in the ventral V-SVZ. (Q) High-magnification image of Adgrl3 in the ventral V-SVZ, colocalizing with an A cell (arrow). (R-S). RNAscope validation of ventral lineage marker Slit2 (magenta) in the ventral V-SVZ. S. High-magnification image of the ventral V-SVZ, where Slit2 puncta colocalize with an A cell (arrow) and B cell (arrowhead). (T-V). Quantifications of DAPI+,DCX- (T) or DAPI+,DCX+ (U) Slit2 RNAscope puncta along the length of the V-SVZ (0 = ventral-most extent, 1 = dorso-lateral-most extent of the wedge) with the median puncta distribution location plotted as a horizontal line for each sample (n=3, each indicated by a different shade, ~ bregma 1.34, 1.18, and 0.62 mm). V. Summary schematic of Slit2 expression in three rostro-caudal coronal sections (~bregma 1.50, 0.98, and 0.14 mm); strong expression (magenta); sparse (light magenta). Note that Adgrl3 showed a similar distribution. CC: corpus callosum, Str: striatum, LV: lateral ventricle. Scale bars: 15 μm (K, P, and R), 10 μm (I), and 5 μm (J, L, Q, and S).
Figure 6—figure supplement 1.
Figure 6—figure supplement 1.. Characterization of dorsal and ventral neurogenic lineages.
(A) Schematic illustrating the control comparison to identify genes enriched in both ventral B and dorsal A cells, or in dorsal B and ventral A cells. (B) UMAP plots showing expression of the three genes identified in the analysis in (A), including Efna5, Cntnap2, and Flrt2. (C) UMAP plot colored by position score, based on net ventral (purple) and dorsal (green) AUCell scores. (D) UMAP of the neurogenic lineage split by classification into the ventral (purple) or dorsal (green) lineage. (E) Violin plots of AUCell score distribution of dorsal and ventral cells shown in (D). NA: cells not assigned. (F) Expression of dorsal signature genes in all cells along the neurogenic lineage progression represented by pseudotime. (G) Expression of ventral signature genes in all cells along the neurogenic lineage progression represented by pseudotime. (H) Gene ontology analysis on differentially expressed genes between High Score dorsal and ventral B cells and High Score dorsal and ventral A cells reveal overrepresented gene categories. (I-O) Low-magnification images of the entire V-SVZ in a coronal section, labeled with RNAscope probes (magenta) against Pax6 (J); Rlbp1 (L); Adgrl3 (N), and Slit2 (P). (J-L) High magnification of the ventral V-SVZ from panels I (J) and K (L). (N-P) High magnification of the dorsal V-SVZ from panel M (N) and O (P). Scale bars: 100 μm (I, K, M, and O) and 15 μm (J, L, N, and P).
Figure 7.
Figure 7.. scRNA-Seq reveals dorsal and ventral neurogenic lineage domains in the V-SVZ.
(A) A summary of cell types in the neurogenic lineage identified by scRNA-Seq and their classification into dorsal and ventral transcriptional identities. (B) Schematic depicting the dorsal and ventral domains newly identified by scRNA-Seq and snucRNA-Seq, and confirmed by staining and RNAscope.

References

    1. Aibar S, González-Blas CB, Moerman T, Huynh-Thu VA, Imrichova H, Hulselmans G, Rambow F, Marine JC, Geurts P, Aerts J, van den Oord J, Atak ZK, Wouters J, Aerts S. SCENIC: single-cell regulatory network inference and clustering. Nature Methods. 2017;14:1083–1086. doi: 10.1038/nmeth.4463. - DOI - PMC - PubMed
    1. Batista-Brito R, Machold R, Klein C, Fishell G. Gene expression in cortical interneuron precursors is prescient of their mature function. Cerebral Cortex. 2008;18:2306–2317. doi: 10.1093/cercor/bhm258. - DOI - PMC - PubMed
    1. Bergen V, Lange M, Peidli S, Wolf FA, Theis FJ. Generalizing RNA velocity to transient cell states through dynamical modeling. Nature Biotechnology. 2020;38:1408–1414. doi: 10.1038/s41587-020-0591-3. - DOI - PubMed
    1. Bernal J, Guadaño-Ferraz A, Morte B. Thyroid hormone transporters--functions and clinical implications. Nature Reviews. Endocrinology. 2015;11:406–417. doi: 10.1038/nrendo.2015.66. - DOI - PubMed
    1. Borrett MJ, Innes BT, Jeong D, Tahmasian N, Storer MA, Bader GD, Kaplan DR, Miller FD. Single-Cell profiling shows murine forebrain neural stem cells reacquire a developmental state when activated for adult neurogenesis. Cell Reports. 2020;32:108022. doi: 10.1016/j.celrep.2020.108022. - DOI - PubMed

Publication types

Associated data