. 2021 Jul 14:10:e69767.
doi: 10.7554/eLife.69767.

A locomotor neural circuit persists and functions similarly in larvae and adult Drosophila

Affiliations

A locomotor neural circuit persists and functions similarly in larvae and adult Drosophila

Kristen Lee et al. Elife. .

Abstract

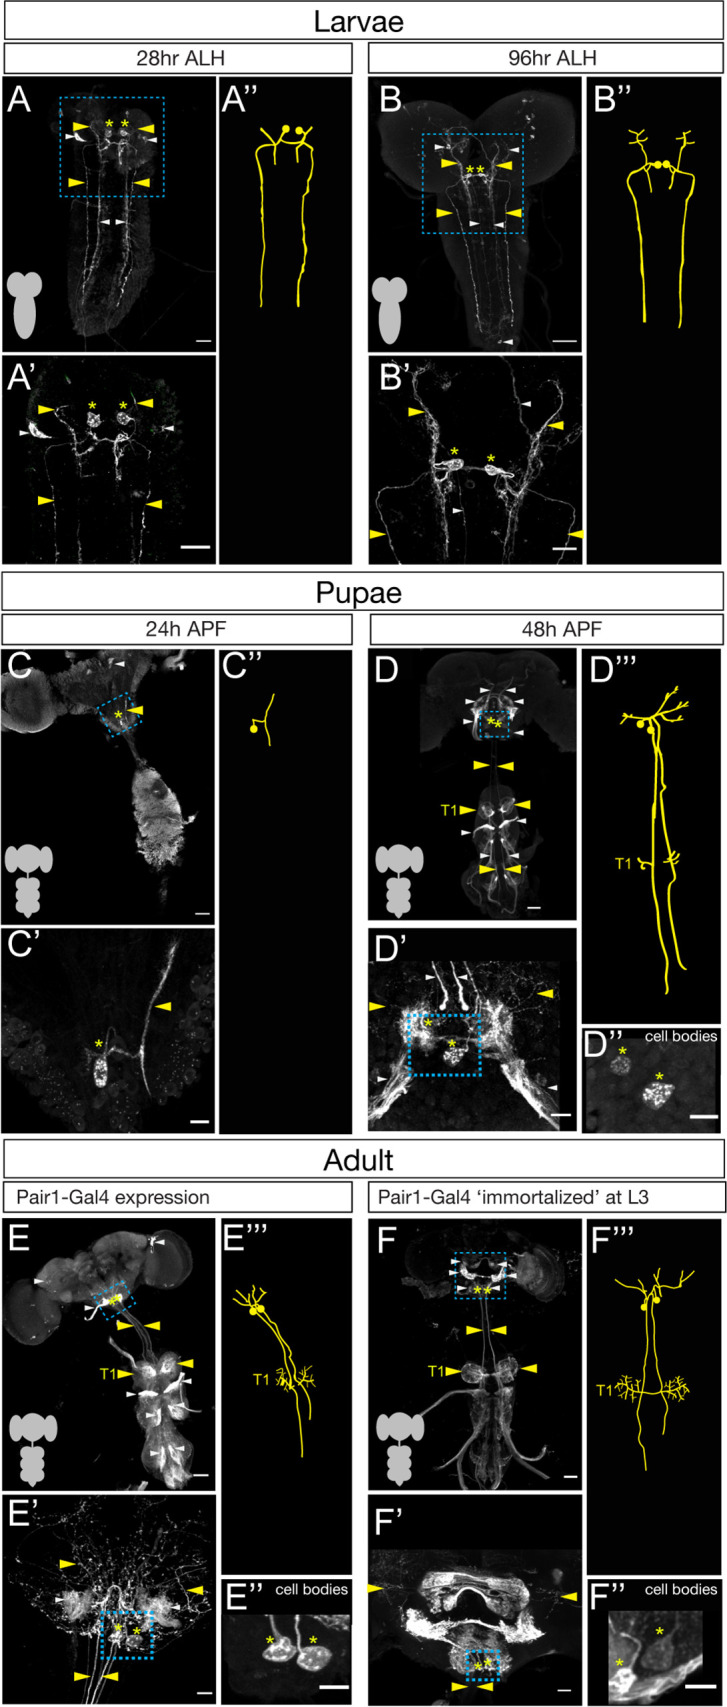
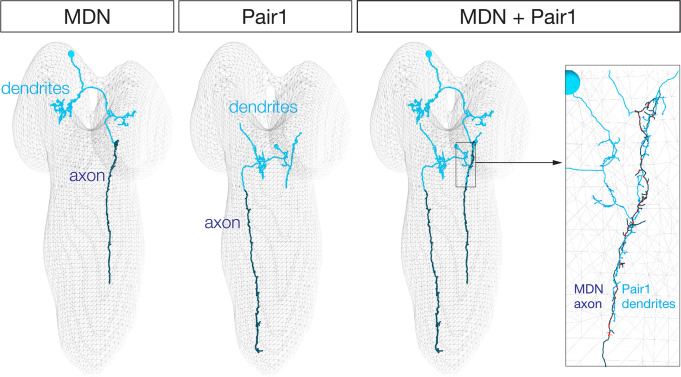
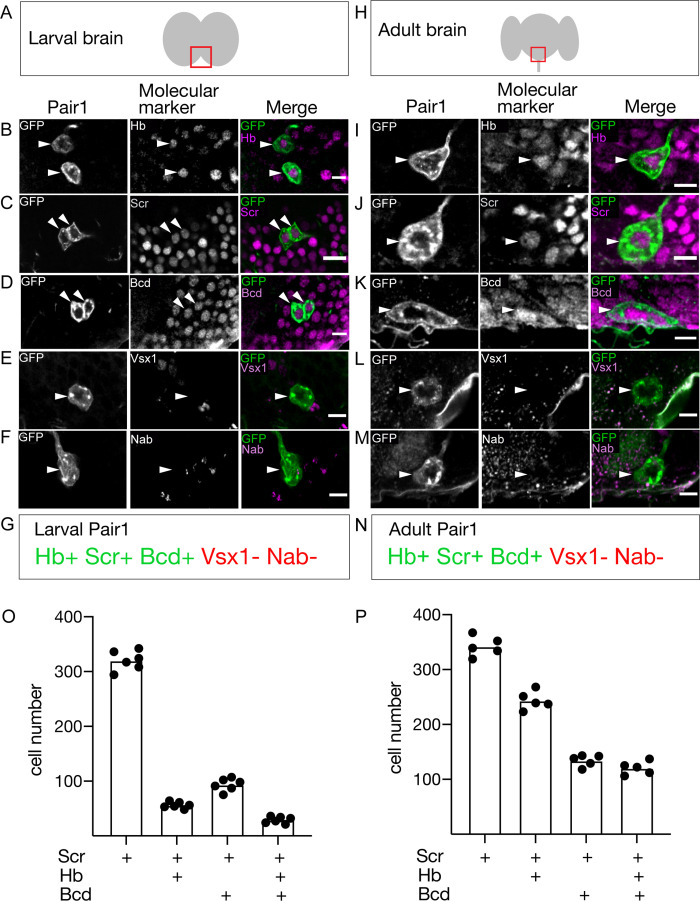
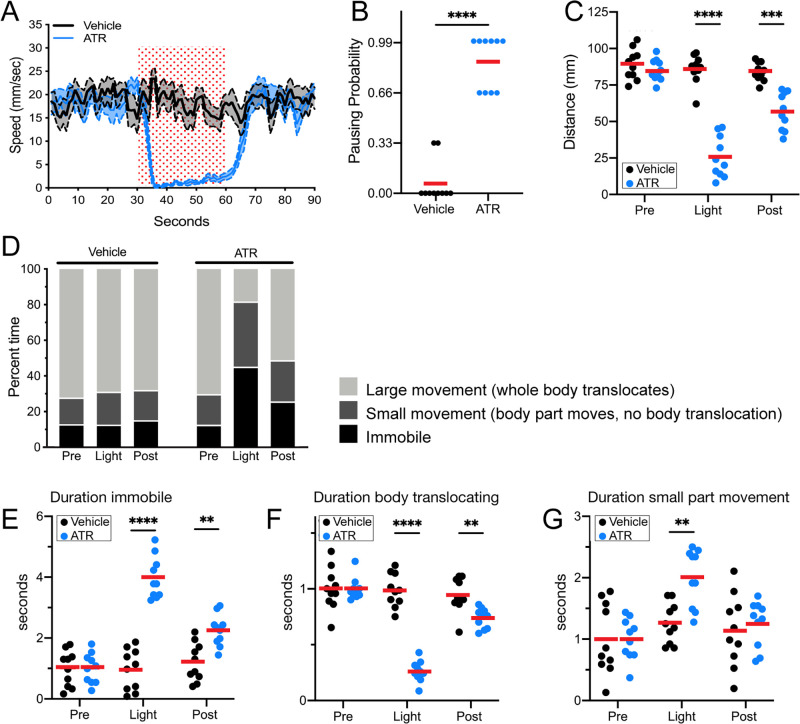
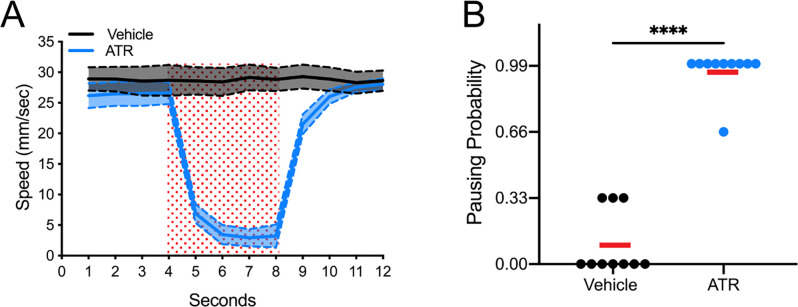
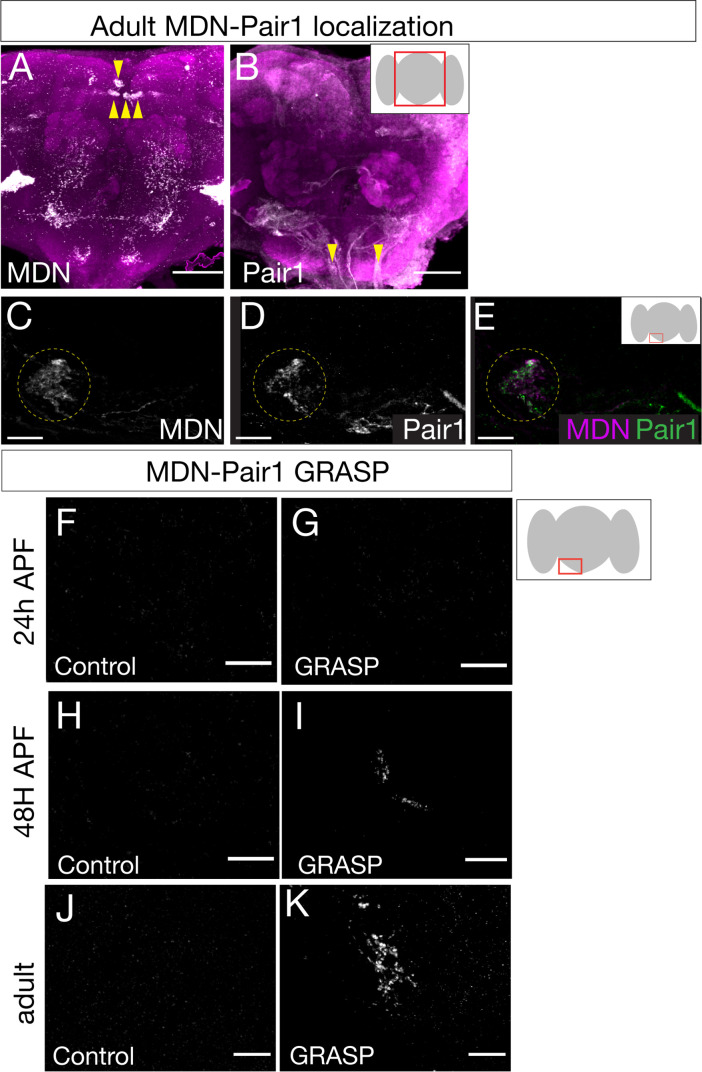
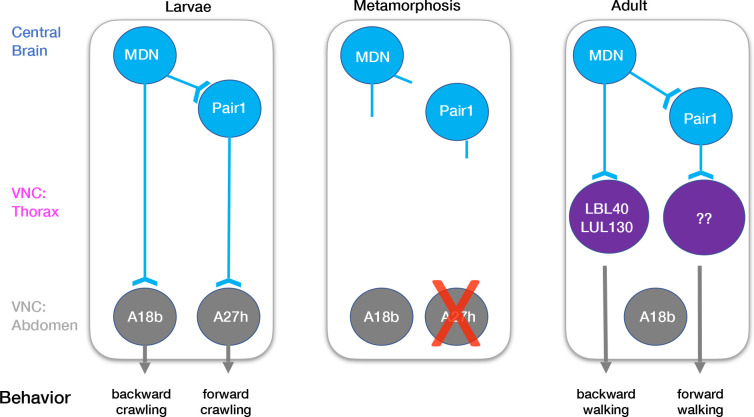
Individual neurons can undergo drastic structural changes, known as neuronal remodeling or structural plasticity. One example of this is in response to hormones, such as during puberty in mammals or metamorphosis in insects. However, in each of these examples, it remains unclear whether the remodeled neuron resumes prior patterns of connectivity, and if so, whether the persistent circuits drive similar behaviors. Here, we utilize a well-characterized neural circuit in the Drosophila larva: the moonwalker descending neuron (MDN) circuit. We previously showed that larval MDN induces backward crawling, and synapses onto the Pair1 interneuron to inhibit forward crawling (Carreira-Rosario et al., 2018). MDN is remodeled during metamorphosis and regulates backward walking in the adult fly. We investigated whether Pair1 is remodeled during metamorphosis and functions within the MDN circuit during adulthood. We assayed morphology and molecular markers to demonstrate that Pair1 is remodeled during metamorphosis and persists in the adult fly. MDN-Pair1 connectivity is lost during early pupal stages, when both neurons are severely pruned back, but connectivity is re-established at mid-pupal stages and persist into the adult. In the adult, optogenetic activation of Pair1 resulted in arrest of forward locomotion, similar to what is observed in larvae. Thus, the MDN-Pair1 neurons are an interneuronal circuit - a pair of synaptically connected interneurons - that is re-established during metamorphosis, yet generates similar locomotor behavior at both larval and adult stages.

Keywords: D. melanogaster; locomotion; metamorphosis; motor circuit; neuroscience.


Conflict of interest statement

KL No competing interests declared, CD Reviewing editor, eLife

Figures

Figure 1.
Figure 1.. The Pair1 neuron persists from larval to adult stages.
(A–B) Pair1 neurons (cell body: yellow asterisk; neurites: yellow arrowhead) in the larval CNS (gray outline) at 28 hr after larval hatching (ALH) (A) and 96 hr ALH (B). Here and in subsequent panels are maximum intensity projections of confocal sections containing the Pair1 neurons; anterior, up; dorsal view. Significant ‘off-target’ expression marked with white arrowheads. Scale bar, 50 μm. (A’–B’) Enlargement of the brain regions boxed in A,B. Scale bar, 20 μm. (A”–B”) Tracing to show Pair1 neuron morphology. Genotype: +; UAS-myr::GFP; R75C02-Gal4. (C–D) Pair1 neurons (cell body: yellow asterisk; neurites: yellow arrowhead) in the pupal CNS (gray outline) at 24 hr after pupal formation (APF) (C) and 96 hr APF (D). Significant ‘off-target’ expression marked with white arrowheads. Scale bar, 50 μm. (C’–D’) Enlargement of the brain regions boxed in C, D; cell body: yellow asterisk, neurites: yellow arrowhead. Scale bar, 10 μm. (C”) Tracing to show Pair1 neuron morphology. (D”) Focal plane showing Pair1 cell bodies (region boxed in D’, cell body marked with yellow asterisks). Scale bar, 10 μm. (D”’) Tracing to show Pair1 neuron morphology. Note that Pair1 can be followed to T1 in the 3D confocal stack but is difficult to represent here due to fasciculation of Pair1 with off-target neurons. Genotype: +; UAS-myr::GFP; R75C02-Gal4. (E) Pair1 neurons (cell body: yellow asterisk; neurites: yellow arrowhead) in the 4-day adult CNS (gray outline) Significant ‘off-target’ expression marked with white arrowheads. Scale bar, 50 μm. (E’) Enlargement of the brain region boxed in E. Scale bar, 10 μm. (E”) Focal plane showing Pair1 cell bodies (region boxed in E’, cell body marked with yellow asterisks). Scale bar, 10 μm. (E”’) Tracing to show Pair1 neuron morphology. Genotype: +; UAS-myr::GFP; R75C02-Gal4. (F) Pair1 neurons (cell body: yellow asterisk; neurites: yellow arrowhead) permanently labeled at 96 hr ALH and visualized in the 4-day old adult. See Materials and methods for details. Significant ‘off-target’ expression marked with white arrowheads. Scale bar, 50 μm. (F’) Enlargement of the brain region boxed in F; Pair1 cell body: yellow asterisk; Pair1 neurites: yellow arrowhead. Scale bar, 10 μm. (F”) Focal plane showing Pair1 cell bodies (region boxed in F’, cell body marked with yellow asterisks). Scale bar, 10 μm. (F”’) Tracing to show Pair1 neuron morphology. Genotype: Hs-KD,3xUAS-FLP; 13xLexAop(KDRT.Stop)myr:smGdP-Flag/+; 13xLexAop(KDRT.Stop)myr:smGdP-V5, 13xLexAop(KDRT.Stop)myr:smGdP-HA, nSyb(FRT.Stop)LexA::p65.
Figure 1—figure supplement 1.
Figure 1—figure supplement 1.. Moonwalker descending neuron (MDN) axon and Pair1 dendrite target the same neuropil in the larval brain.
The TEM volume of the newly hatched larva ‘Seymore’ showing the axon (green) and dendrite (blue) domains of a single MDN and Pair1 neuron defined by the location of pre- and post-synapses. Left: MDN axon and dendrite domains. Middle: Pair1 axon and dendrite domains. Right: MDN axon and Pair1 dendrite are closely entwined the same region of neuropil (white bracket).
Figure 2.
Figure 2.. The Pair1 neuron expresses the same molecular markers at larval and adult stages.
(A) Schematic of the larval brain showing region of Pair1 neurons (red box) enlarged in panels below. Anterior up, dorsal view. (B–G) Larval Pair1 neurons (left column), indicated markers (middle column), and merge (right column) at 28 hr after larval hatching (ALH). In some cases the second Pair1 neuron is out of the focal plane, but both Pair1 neurons always have the same gene expression profile. Markers detect the following transcription factors: Hb, Hunchback; Scr, Sex combs reduced; Bcd, Bicoid; Vsx1, Visual system homeobox 1; and Nab. Scale bar, 5 μm. (G) Summary: marker expression matches that in adults. Genotype: +; UAS-myr::GFP; R75C02-Gal4. (H) Schematic of the adult brain showing region of Pair1 neurons (red box) enlarged in panels below. Anterior up, dorsal view. (I–N) Adult Pair1 neurons (left column), indicated markers (middle column), and merge (right column) in 4-day old adult. Scale bar, 5 μm. (N) Summary: marker expression matches that in larvae. Genotype: +; UAS-myr::GFP; R75C02-Gal4. (O–P) The number of cells expressing Scr (first column), Scr/Hb (second column), Scr/Bcd (third column), and Scr/Hb/Bcd (fourth column) in larvae (O) and adults (P). n = 5–6 whole brains.
Figure 3.
Figure 3.. Pair1 activation for 30 s arrests forward locomotion but does not cause paralysis in adults.
(A) Speed (mm/s) of adult flies expressing Chrimson in Pair1 neurons following neuronal activation (+ATR [all-trans retinal] , blue) or no activation (vehicle control, black) in a closed loop arena. Speed was recorded for the 30 s prior to activation, the 30 s light-induced activation (red stipple), and 30 s after activation. Mean ± SEM, n = 10. Genotype for this and all subsequent panels: UAS-CsChrimson::mVenus; +; R75C02-Gal4. (B) Probability of forward locomotion pausing upon light-induced Pair1 activation (ATR treatment, blue) compared to vehicle control (black). Statistics: t-test, p < 0.001; n = 10. (C) Total distance traveled pre-light stimulus (‘pre’), during the light stimulus (‘light’) and post-light stimulus (‘post’) (terminology used here and in subsequent panels) of flies fed ATR (Pair1 activation, blue) compared to controls (fed vehicle, no Pair1 activation, black). Statistics: two-way ANOVA: drug treatment, F(1, 18) = 111.3, p < 0.0001; time, F(1.867, 33.61) = 47.03, p < 0.0001; interaction F(2, 26) = 38.24, p < 0.001; Bonferroni’s multiple comparisons between drug treatments within each timepoint: pre, p > 0.9999; light, p < 0.0001; post, p = 0.0001; n = 10. (D) Percent time doing large movements (whole body translocation, light gray), small movements (body part movement but no translocation, dark gray) or no movements (immobile, black) of flies fed vehicle (left side) or ATR (right side) during each time phase (pre, light, post). (E) Normalized duration of time spent immobile during each timepoint (pre, light, post) for flies fed ATR (Pair1 activation, blue) compared to controls fed vehicle (black). Statistics: two-way ANOVA: drug treatment, F(1, 18) = 112.8, p < 0.0001; time, F(1.930, 34.74) = 25.55, p < 0.0001; interaction, F(2, 36) = 27.81, p < 0.0001; Bonferroni’s multiple comparisons between drug treatments within each timepoint: pre, p > 0.9999; light, p < 0.0001; post, p = 0.0022; n = 10. (F) Normalized duration of time spent doing small movements during each timepoint (pre, light, post) for flies fed ATR (Pair1 activation, blue) compared to controls fed vehicle (black). Statistics: two-way ANOVA: drug treatment, F(1, 18) = 5.111, p = 0.036; time, F(1.923, 34.62) = 10.82, p = 0.0003; interaction, F(2, 36) = 4.225, p = 0.0225; Bonferroni’s multiple comparisons between drug treatments within each timepoint: pre, p > 0.9999; light, p = 0.0022; post, p > 0.9999; n = 10. (G) Normalized duration of time spent doing large movements during each time phase (pre, light, post) for flies fed ATR (Pair1 activation, blue) compared to controls fed vehicle (black). Statistics: two-way ANOVA: drug treatment, F(1, 18) = 53.56, p < 0.0001; time, F(1.869, 33.64) = 53.44, p < 0.0001; interaction, F(2, 36) = 52.20, p < 0.0001; Bonferroni’s multiple comparisons between drug treatments within each timepoint: pre, p > 0.9999; light, p < 0.0001; post, p = 0.0074; n = 10.
Figure 3—figure supplement 1.
Figure 3—figure supplement 1.. Pair1 activation for 4 s arrests forward locomotion but does not cause paralysis in adults in an open field arena.
(A) Speed (mm/s) of adult flies in an open field arena. Flies were fed food supplemented with all-trans retinal (ATR) (blue) or ethanol (vehicle, black). Red square represents the presentation of the light stimulus. (B) Probability of pausing upon light activation of Pair1 (ATR treatment, blue) compared to controls (vehicle treatment, black) (t-test, p < 0.001; n = 12).
Figure 4.
Figure 4.. Moonwalker descending neurons (MDN) and Pair1 are synaptic partners in adults.
(A–E) MDN and Pair1 show close membrane apposition. (A, B) MDN neurons (A) and Pair1 neurons (B) in the adult central brain. Neurons are in white, nc82 counterstain in magenta for whole brain orientation; cell bodies marked by yellow arrowheads. Here and in subsequent panels shows maximum intensity projection of volume; anterior, up; dorsal view. Scale bar, 50 μm. Genotype: UAS-mCD8::RFP, LexAop-mCD8::GFP; VT044845-LexA; R75C02-Gal4. (C–E) MDN neurites (C), Pair1 neurites (D), and merge (E) in the left subesophageal ganglion (red box in schematic). Scale bar, 10 μm. Genotype: UAS-mCD8::RFP, LexAop-mCD8::GFP; VT044845-LexA; R75C02-Gal4. (F–K) t-GRASP (targeted GFP reconstitution across synaptic partners) between MDN and Pair1. In all panels: Scale bar, 10 μm. Genotype:;; LexAop-pre-t-GRASP, UAS-post-t-GRASP/R75C02-Gal4. (F–G) Pupal t-GRASP at 24 hr after pupal formation (APF). (F) No detectable t-GRASP signal was observed in the subesophageal ganglion without expression of the pre-t-GRASP fragment in MDN. (G) t-GRASP signals between MDN and Pair1 were lacking in the subesophageal ganglion. (H–I) Pupal t-GRASP at 48 hr APF. (H) No detectable t-GRASP signal was observed in the subesophageal ganglion without expression of the pre-t-GRASP fragment in MDN. (I) t-GRASP signals between MDN and Pair1 were observed in the subesophageal ganglion. (J–K) Adult t-GRASP. (J) No detectable t-GRASP signal was observed in the subesophageal ganglion without expression of the pre-t-GRASP fragment in MDN. (K) t-GRASP signals between MDN and Pair1 were observed in the subesophageal ganglion.
Figure 5.
Figure 5.. Model describing the moonwalker descending neuron (MDN)-Pair1 circuit in larval and adult stages.
In the larvae, MDN and Pair1 neurons are located in the central brain. MDN and Pair1 neurons are synaptic partners. MDN neurons also extend axons into the abdominal region of the ventral nerve cord (VNC) and synapse onto A18b. A18b subsequently regulates backward crawling by synapsing onto motor neurons. Pair1 synapses onto and inhibits the pre-motor neuron A27h, which generates forward locomotion when activated. During metamorphosis, MDN and Pair1 neurons remain in the central brain, drastically prune their neurites, and survive. The A18b neuron and processes remain in the abdomen of the VNC and survives in the adult. The A27h neuron undergoes apoptosis. In the adult, synapses between MDN and Pair1 are re-established. MDN neurons also extend axons into the thoracic region of the VNC and synapse onto LBL40 and LUL130. Activation of LBL40 and LUL130 generates backward walking. MDN does not extend axons into the abdominal region of the VNC and is no longer synaptic partners with A18b. Pair1 neurons extend axons into the thoracic region of the VNC and synapse onto unknown neurons. Activation of Pair1 generates a pausing behavior, likely through the inhibition of neurons generating forward locomotion. In both larvae and adult, MDN and Pair1 neurons (blue) persist and function as a core circuit to regulate locomotion.

References

    1. Barendse MEA, Simmons JG, Byrne ML, Seal ML, Patton G, Mundy L, Wood SJ, Olsson CA, Allen NB, Whittle S. Brain structural connectivity during adrenarche: associations between hormone levels and white matter microstructure. Psychoneuroendocrinology. 2018;88:70–77. doi: 10.1016/j.psyneuen.2017.11.009. - DOI - PubMed
    1. Bidaye SS, Machacek C, Wu Y, Dickson BJ. Neuronal control of Drosophila walking direction. Science. 2014;344:97–101. doi: 10.1126/science.1249964. - DOI - PubMed
    1. Bidaye SS, Laturney M, Chang AK, Liu Y, Bockemühl T, Büschges A, Scott K. Two brain pathways initiate distinct forward walking programs in Drosophila. Neuron. 2020;108:469–485. doi: 10.1016/j.neuron.2020.07.032. - DOI - PMC - PubMed
    1. Carreira-Rosario A, Zarin AA, Clark MQ, Manning L, Fetter RD, Cardona A, Doe CQ. MDN brain descending neurons coordinately activate backward and inhibit forward locomotion. eLife. 2018;7:e38554. doi: 10.7554/eLife.38554. - DOI - PMC - PubMed
    1. Consoulas C, Duch C, Bayline RJ, Levine RB. Behavioral transformations during metamorphosis: remodeling of neural and motor systems. Brain Research Bulletin. 2000;53:571–583. doi: 10.1016/S0361-9230(00)00391-9. - DOI - PubMed

Publication types

LinkOut - more resources