An official website of the United States government
The .gov means it’s official.
Federal government websites often end in .gov or .mil. Before
sharing sensitive information, make sure you’re on a federal
government site.
The site is secure.
The https:// ensures that you are connecting to the
official website and that any information you provide is encrypted
and transmitted securely.
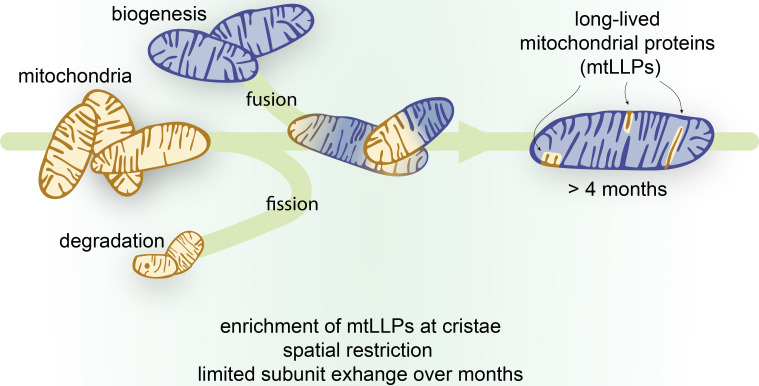
Long-lived proteins (LLPs) have recently emerged as vital components of intracellular structures whose function is coupled to long-term stability. Mitochondria are multifaceted organelles, and their function hinges on efficient proteome renewal and replacement. Here, using metabolic stable isotope labeling of mice combined with mass spectrometry (MS)-based proteomic analysis, we demonstrate remarkable longevity for a subset of the mitochondrial proteome. We discovered that mitochondrial LLPs (mt-LLPs) can persist for months in tissues harboring long-lived cells, such as brain and heart. Our analysis revealed enrichment of mt-LLPs within the inner mitochondrial membrane, specifically in the cristae subcompartment, and demonstrates that the mitochondrial proteome is not turned over in bulk. Pioneering cross-linking experiments revealed that mt-LLPs are spatially restricted and copreserved within protein OXPHOS complexes, with limited subunit exchange throughout their lifetimes. This study provides an explanation for the exceptional mitochondrial protein lifetimes and supports the concept that LLPs provide key structural stability to multiple large and dynamic intracellular structures.
Mitochondrial proteins are exceptionally long lived in tissues containing enduring postmitotic cells. (A) …
Figure 1.
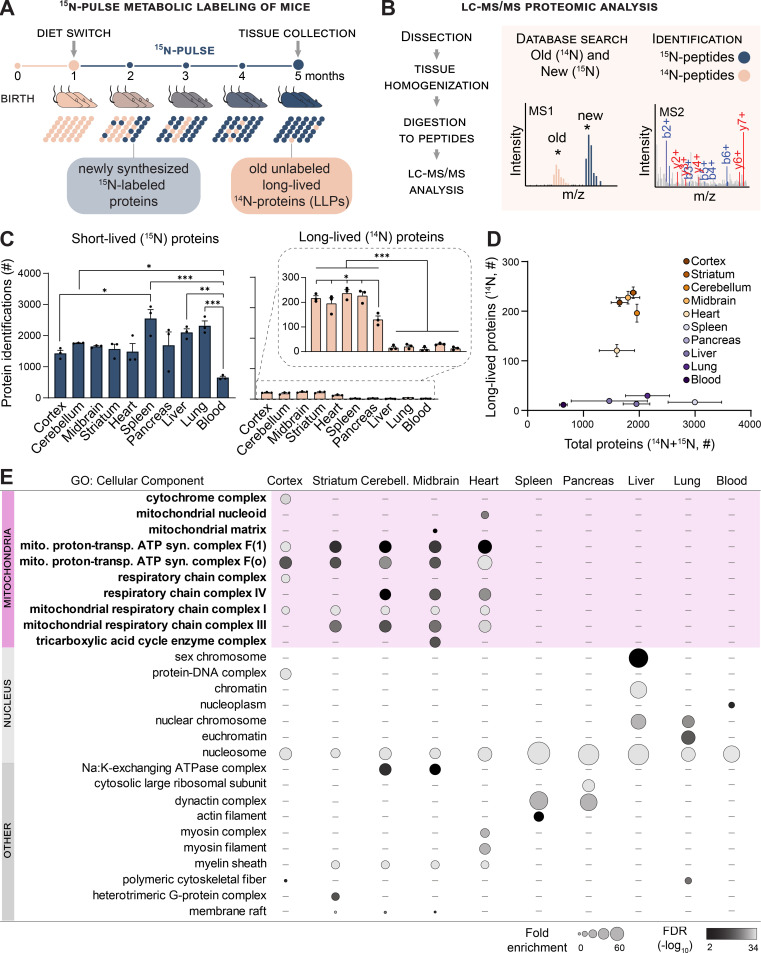
Mitochondrial proteins are exceptionally longlived in tissues containing enduring postmitotic cells. (A) Whole-animal metabolic pulse 15N labeling scheme to identify and measure LLPs (≥4 mo) in mice. (B) Analytical workflow illustrating how the dissected tissues were homogenized and digested to peptides, and 15N and 14N peptides were identified and quantitated with LC-MS/MS–based proteomics. (C) Summary of protein identifications. Left plot indicates the number of 15N proteins identified (i.e., new, ≤4 mo old), right plot indicates 14N proteins identified (i.e., ≥4 mo old). (D) Tissues enriched with long-lived cells selectively harbor LLPs despite a similar number of total proteins identified in most tissues. (E) GO analysis of the LLPs in tissues that contain enduring postmitotic cells revealed that terms related to mitochondria (mito.) are significantly enriched. syn., synthesis; trans., transport. Data in C and D are mean ± SEM; in C–E, n = three mice for each tissue analyzed. *, P < 0.05; **, P < 0.01; ***, P < 0.001 by Kruskal–Wallis ANOVA with Tukey’s multiple comparisons test. See also Fig. S1 and Table S1.
Figure S1.
Mitochondrial proteins are exceptionally long …
Figure S1.
Mitochondrial proteins are exceptionally long lived in tissues containing postmitotic cells. Related to…
Figure S1.
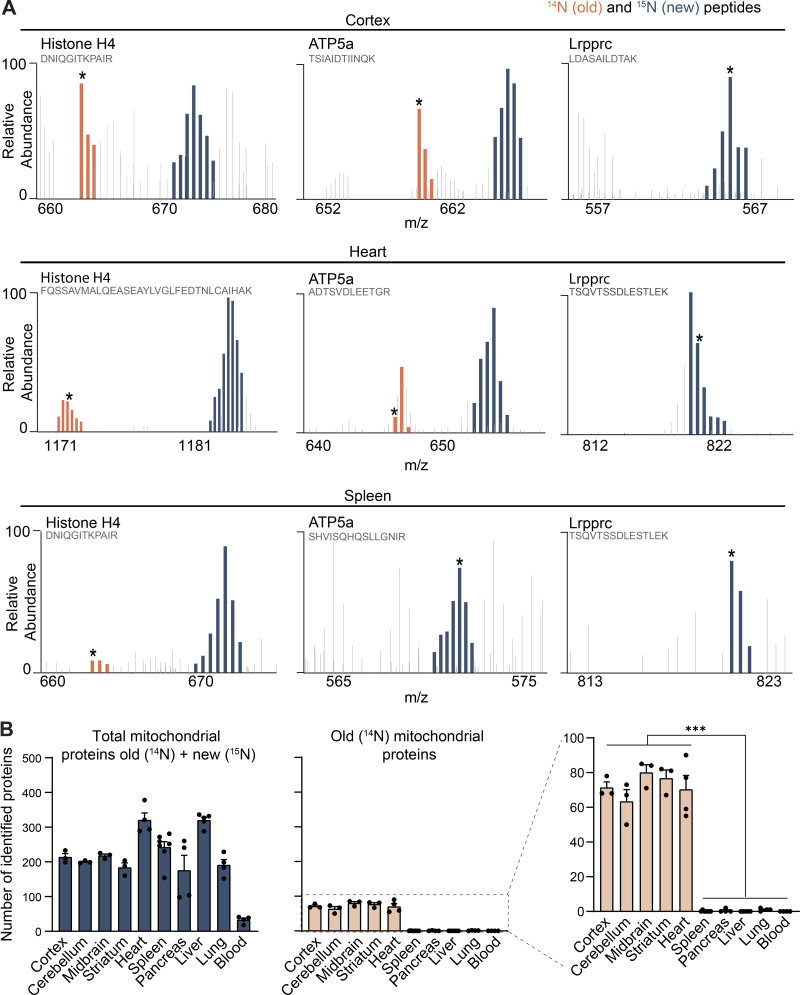
Mitochondrial proteins are exceptionally longlived in tissues containing postmitotic cells. Related to Fig. 1. (A) Annotated representative raw MS1 scans across the indicated m/z ranges after 4 mo of 15N-dynamic pulse. Distinct peptides for indicated proteins; dark blue, 15N peptide peaks; orange, 14N; gray, other peptides. Starred peaks (*) were identified by MS/MS. (B) Number of identified mitochondrial proteins (blue) along with mt-LLPs (orange), based on MitoCarta3.0; mt-LLPs are only present in the brain and heart tissues. Data are mean ± SEM; three to five biological replicates per tissue. ***, P < 0.001 by Kruskal–Wallis ANOVA with Tukey’s multiple comparisons test.
Figure 2.
LLPs are preferentially associated with…
Figure 2.
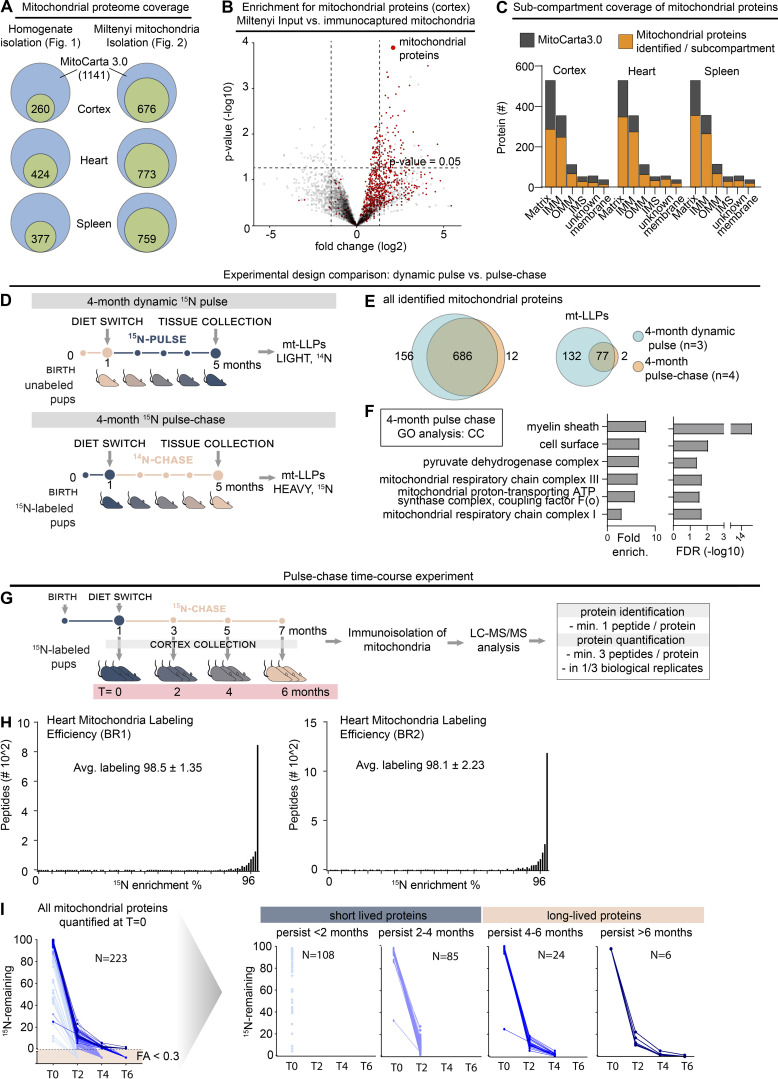
LLPs are preferentially associated with the IMM. (A) Schematic illustrating mitochondrial subcompartmentalization and…
Figure 2.
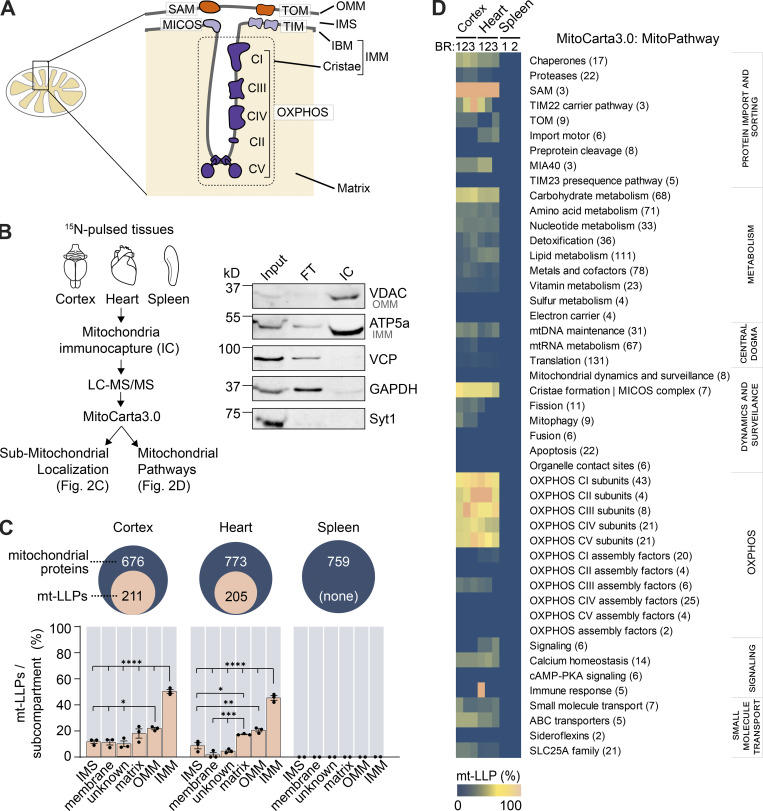
LLPs are preferentially associated with the IMM. (A) Schematic illustrating mitochondrial subcompartmentalization and relevant protein complexes. (B) Workflow to immune-capture mitochondria. Cortex, heart, and spleen from 15N-pulsed mice were homogenized using a gentleMACS system, and dissociated mitochondria were purified by immuno-capture using anti-Tom20 antibodies (Miltenyi Biotec). Purified mitochondria were analyzed using LC-MS/MS, mitochondrial proteins were filtered using MitoCarta 3.0, and mt-LLPs were grouped and examined based on their submitochondrial localization and Mitochondrial Pathway assignments. FT, flow through; IC, immunocapture; IBM, inner boundary membrane. (C) The total number of mitochondrial proteins identified based on 15N and 14N MS/MS spectral matches per tissue (blue) along with the number of identified 14N mt-LLPs (tan). mt-LLPs are enriched at IMM in both heart and cortical extracts, but not in the other subcompartments. None of the mitochondrial proteins in spleen were identified as mt-LLPs. (D) MitoPathway analysis of mt-LLPs. mt-LLPs are enriched in several protein complexes including OXPHOS, Tim22, TOM, SAM, and the cristae formation (i.e., MICOS complex). BR, biological replicate. Data in C are mean ± SEM; for C and D, n = 3 mice for cortex and heart, 2 for spleen. *, P < 0.05; **, P < 0.01; ***, P < 0.001; ****, P < 0.0001 by Kruskal–Wallis ANOVA with Tukey’s multiple comparisons test. See also Fig. S2 and Table S2.
Figure S2.
LLPs are preferentially associated with…
Figure S2.
LLPs are preferentially associated with the IMM. Related to Fig. 2. (A) Coverage…
Figure S2.
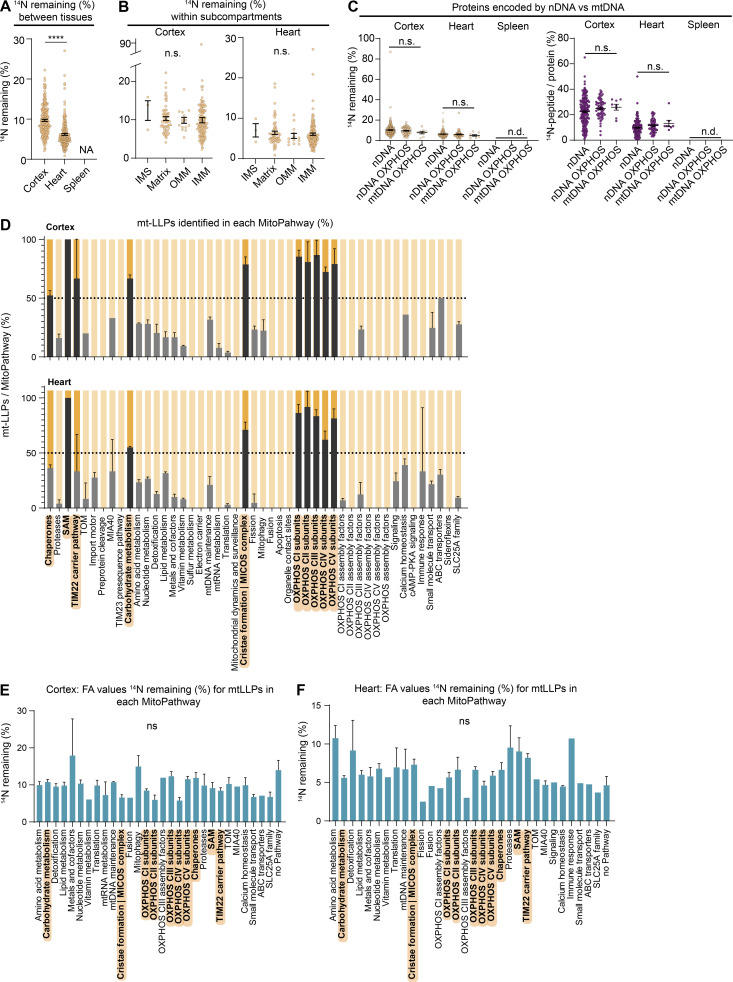
LLPs are preferentially associated with the IMM. Related to Fig. 2. (A) Coverage of mitochondrial proteome across immuno-isolated mitochondria. Cumulative number of proteins identified shown. n = 2–4 mice. (B) Immuno-isolated mitochondria are substantially enriched in mitochondrial proteins. n = 4 mice. (C) Submitochondrial distribution of identified mitochondrial proteins from cortical, heart, and spleen tissue extracts. Identified proteins are shown in orange; MitoCarta3.0 proteins are shown in gray. n = 3 mice. (D) Schematic illustrating two-generation whole-animal metabolic 15N-dynamic pulse compared with 14N pulse-chase experiment design. (E) Venn diagram comparing proteins identified in the 15N-dynamic pulse and 14N pulse-chase experiments. enrich., enrichment. (F) GO analysis of the mt-LLPs identified after 4 mo of 14N pulse-chase showing an enrichment for terms related to mitochondria. See also Table S1. (G) Time course pulse-chase experiment of 15N-labeled mice (born to 15N-labeled females) that were chased with 14N diet for 0, 2, 4, and 6 mo. Note that the 4-mo 14N pulse chase time point shown here represents the same dataset as in panels D and E. (H) Metabolic labeling efficiency of second-generation pups analyzed at t = 0 (at weaning) in the 14N pulse-chase experiments. Average peptide labeling percentage is indicated ± SD. (I) Summary of protein degradation trends across chase periods. Only proteins identified at t = 0 which were then tracked through the time course are shown. n = 3–4 mice.
Figure S3.
Exceptional longevity of mitochondrial cristae-associated…
Figure S3.
Exceptional longevity of mitochondrial cristae-associated proteins. Related to Fig. 3. (A) Overall FA…
Figure S3.
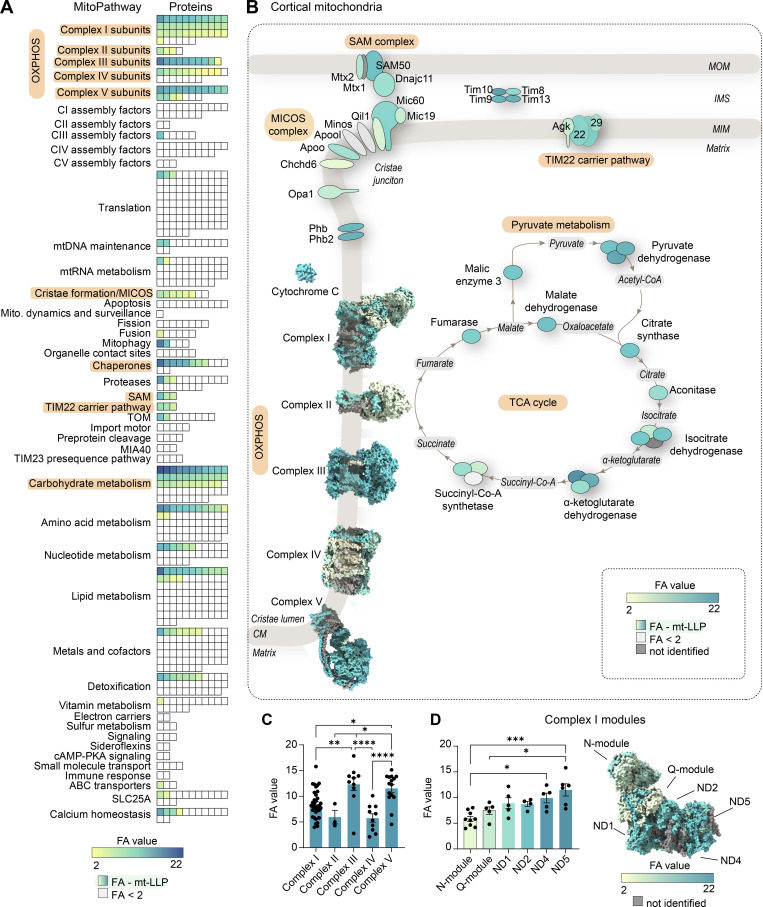
Exceptional longevity of mitochondrial cristae-associated proteins. Related to Fig. 3. (A) Overall FA values of cortical, heart, and spleen mt-LLPs. (B) Mt-LLP FA values do not vary significantly within mitochondrial subcompartments. (C) Comparison of FA values and spectral counts for mt-LLPs encoded by nDNA versus mtDNA. (D) Average number of mt-LLPs identified per MitoPathway in cortex and heart, represented as percentage ± SEM. MitoPathways with enrichment of ≥50% (dotted line) of mt-LLPs are highlighted in hard gray/orange. (E and F) Average FA values for mt-LLPs identified in MitoPathway. Only MitoPathways for which mt-LLPs were identified are shown. Data points in A–F, n = 4 mice; mean ± SEM. ****, P < 0.0001 by Kruskal–Wallis ANOVA with Tukey’s multiple comparisons test.
Figure 3.
Exceptional longevity of mitochondrial cristae-associated…
Figure 3.
Exceptional longevity of mitochondrial cristae-associated proteins. (A) All mitochondrial (mito.) proteins identified in…
Figure 3.
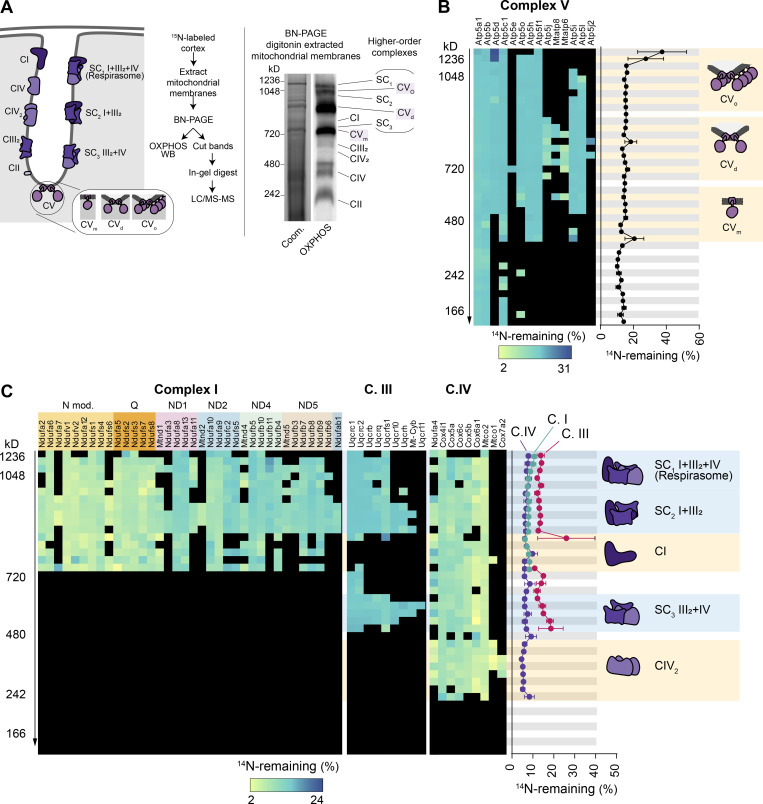
Exceptional longevity of mitochondrial cristae-associated proteins. (A) All mitochondrial (mito.) proteins identified in cortical extracts sorted according to their assigned MitoPathway. For proteins that were identified as mt-LLPs in the 14N search, we calculated the average FA values, shown in yellow-to-blue scale. For proteins that were not identified in light search, FA values could not be computed, and these proteins are displayed with white boxes. The lowest calculated FA value was 2.11; non–long-lived proteins are indicated with FA <2. (B) Illustration of major pathways, which showed enrichment of ≥50% in mt-LLPs (orange) with coloring based on FA, in cortex. (C) The pools of long-lived complex III and V are significantly larger than those of complexes I, II, and IV. Each dot represent a protein: complex I, 34; complex II, 3; complex III, 10; complex IV, 10; complex V, 15 subunits. (D) N- and Q-modules of complex I are turned over more rapidly than the rest of the complex. Each dot represent a protein: N-module, 9; Q-module, 5; ND1, 5; ND2, 4; ND4, 5; ND5, 6 subunits. Data in C and D are mean ± SEM; n = 3 mice. *, P < 0.05; **, P < 0.01; ***, P < 0.001; ****, P < 0.0001 by Kruskal–Wallis ANOVA with Tukey’s multiple comparisons test. See also Table S2 and Fig. S3.
Figure S4.
Long-lived subunits of OXPHOS complexes…
Figure S4.
Long-lived subunits of OXPHOS complexes integrate into individual and higher-order complexes. (A) Solubilized…
Figure S4.
Long-lived subunits of OXPHOS complexes integrate into individual and higher-order complexes. (A) Solubilized cortical mitochondria extracts isolated from 15N-pulsed mice separated by BN-PAGE to resolve mitochondrial complexes and supercomplexes. Representative Coomassie (Coom.)-stained BN-PAGE gel and Western blot probed with an OXPHOS antibody cocktail. Mitochondrial complexes and supercomplexes are annotated. (B and C) 40 gel slices excised from each gel lane were subjected to in-gel trypsin digestion and LC-MS/MS analysis. FA values were calculated for each protein in a given complex and plotted. C.I, complex I; C.II, complex II; C.III, complex III; C.IV, complex IV; CVm, complex V monomer; CVd, complex V dimer; CVo, complex V oligomer; SC, supercomplex. Data points in B and C, n = 4 mice; mean ± SEM.
Figure 4.
Limited mixing and exchange of…
Figure 4.
Limited mixing and exchange of mt-LLPs. (A) Schematic illustrating DSSO cross-linking of mitochondria…
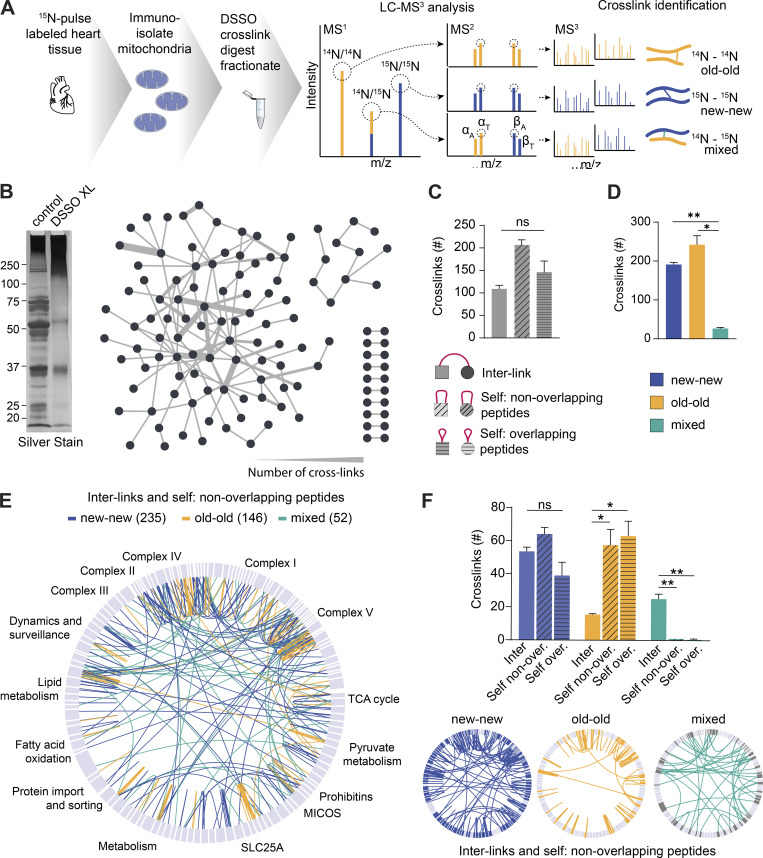
Figure 4.
Limited mixing and exchange of mt-LLPs. (A) Schematic illustrating DSSO cross-linking of mitochondria isolated from 15N-pulse–labeled heart tissue extracts, sample processing, and MS1/MS2/MS3 analysis. (B) Silver-stained gel of control and cross-linked heart mitochondrial isolations. DSSO was added at a concentration of 1 mM; control was treated with DMSO only. Overview of cross-links between different mitochondrial proteins identified in the heart. (C) Number of cross-links identified in heart mitochondria according to the cross-link type. (D) Number of cross-links identified in heart mitochondria according to the peptide isotope build. (E) Map of the mitochondrial protein cross-links. 15N-15N (new-new) peptide cross-links are shown in blue; 14N-14N (old-old) peptide cross-links are shown in yellow; mixed 15N-14N (new-old) peptide cross-links are shown in green. (F) Summary of identified cross-linked peptides broken down by cross-link type and nitrogen isotype. Maps illustrating cross-linked peptides according to nitrogen isotype. In B, E, and F, maps were generated in XiView proteins categorized based on MitoCarta3.0. Data in C, D, and F are mean ± SEM; n = 2 mice. *, P < 0.05; **, P < 0.01, by Kruskal–Wallis ANOVA with Tukey’s multiple comparisons test. See also Fig. S5.
Figure S5.
Limited mixing and exchange of…
Figure S5.
Limited mixing and exchange of mt-LLPs. Related to Figs. 4 and 5. (A) …
Figure S5.
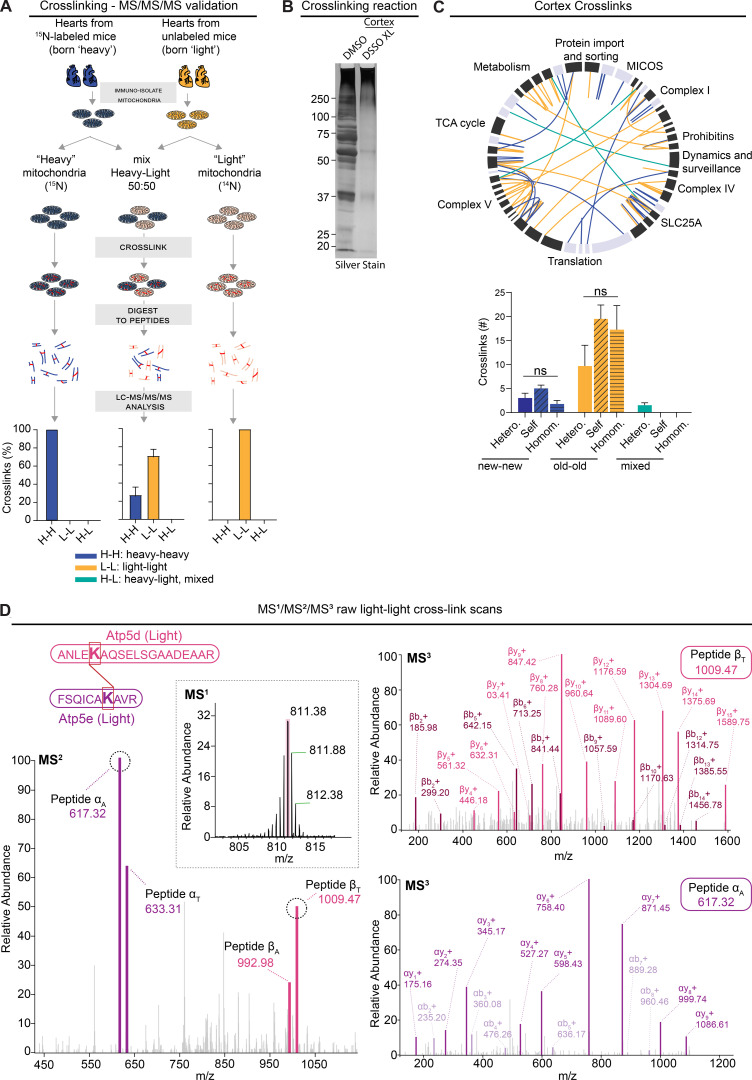
Limited mixing and exchange of mt-LLPs. Related to Figs. 4 and 5. (A) Schematic illustrating control experiments used to assess the rigor of our new method of cross-link analysis of 15N dynamic-labeling experiments. Plot indicates percentage of heavy-heavy, light-light, or heavy-light. (B) Silver-stained gel of cross-linked cortical and heart mitochondrial isolations showing a shift toward higher molecular weights after cross-linking with 1 mM DSSO. (C) XiView map of cortical cross-links. Bar graph indicates identified cross-linked peptides broken down by class and nitrogen isotype. Hetero., interlink; self, self-link (nonoverlapping peptide); homom., self-link (overlapping peptides). (D) Representative example of high-resolution MS2 and MS3 spectra used to identify 14N-14N cross-linked ≥4-mo-old Atp5d and Atp5e peptides. Mean ± SEM; A, n = 2 mice; C, n = 4 mice; data not significant (n.s.) by Kruskal–Wallis ANOVA with Tukey’s multiple comparisons test.
Figure 5.
OXPHOS complexes are copreserved with…
Figure 5.
OXPHOS complexes are copreserved with limited subunit exchange for months. (A) Total cross-links…
Figure 5.
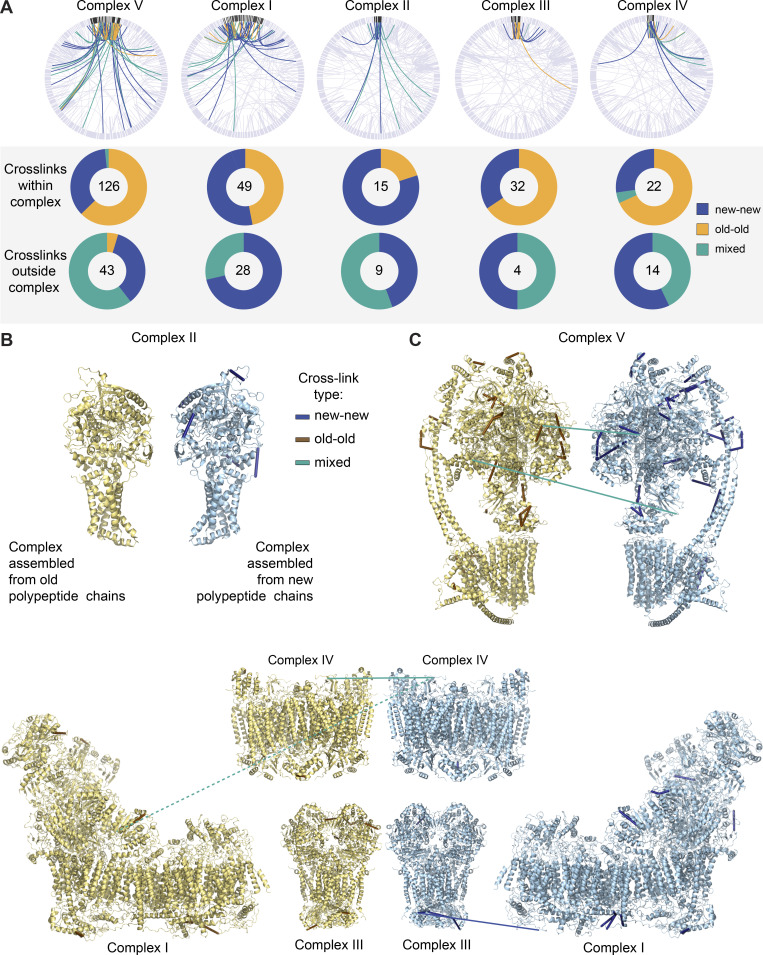
OXPHOS complexes are copreserved with limited subunit exchange for months. (A) Total cross-links within individual OXPHOS complexes are predominantly between two peptides of the same isotope build (new-new or old-old). Cross-links between OXPHOS complexes and other mitochondrial proteins are mostly between new-new or new-old peptides but are rarely formed between two old peptides. (B) Inter- and self- (nonoverlapping peptides) cross-links identified in new and old complex II mapped to high-resolution protein structures (Protein Data Bank [PDB] accession no. 1ZOY). No cross-links were identified between old-old or old-new complex II proteins. Yellow structure illustrates complex build from old, 14N, peptides; blue structure illustrates complex build from new, 15N peptides. (C) Inter- and self- (nonoverlapping peptides) cross-links identified in new and old complex V mapped to high-resolution protein structures (PDB accession no. 6J5I). Only two cross-links of mixed isotypes were identified (teal). (D) PDB structure of complexes I (accession no. 6G2J), III (accession no. 1BGY), and IV (accession no. 3X2Q), which can assemble into respirasome supercomplexes. Inter- and self- (nonoverlapping peptides) cross-links between new or old proteins, as well as intercomplex cross-links, are shown. Blue indicates cross-links between two new peptides, and teal represents cross-links between new and old peptides. Dotted line represents a cross-link between complex I and IV, which is outside of cross-linker constraints. Maps were generated in XIView. n = 2 mice. See also Fig. S6.
Figure S6.
Assembled OXPHOS complexes are copreserved…
Figure S6.
Assembled OXPHOS complexes are copreserved with limited subunit exchange for months. Related to…
Figure S6.
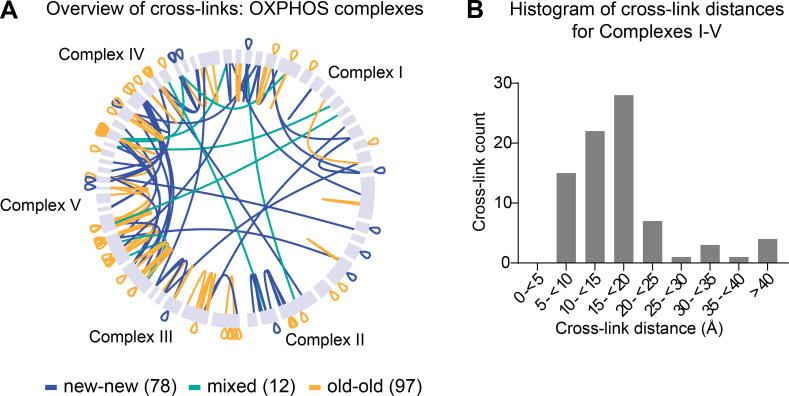
Assembled OXPHOS complexes are copreserved with limited subunit exchange for months. Related to Fig. 5. (A) Overview of inter- and self (overlapping and nonoverlapping) cross-links between subunits of OXPHOS complexes. (B) Histogram of cross-link distances shown in angstroms extracted from cross-links mapped to high-resolution structures of complexes I–V. A and B, n = 2 mice.
Agip, A.A., Blaza J.N., Bridges H.R., Viscomi C., Rawson S., Muench S.P., and Hirst J.. 2018. Cryo-EM structures of complex I from mouse heart mitochondria in two biochemically defined states. Nat. Struct. Mol. Biol. 25:548–556. 10.1038/s41594-018-0073-1
-
DOI
-
PMC
-
PubMed
Callegari, S., Müller T., Schulz C., Lenz C., Jans D.C., Wissel M., Opazo F., Rizzoli S.O., Jakobs S., Urlaub H., et al. . 2019. A MICOS-TIM22 Association Promotes Carrier Import into Human Mitochondria. J. Mol. Biol. 431:2835–2851. 10.1016/j.jmb.2019.05.015
-
DOI
-
PubMed
Camacho, C., Coulouris G., Avagyan V., Ma N., Papadopoulos J., Bealer K., and Madden T.L.. 2009. BLAST+: architecture and applications. BMC Bioinformatics. 10:421. 10.1186/1471-2105-10-421
-
DOI
-
PMC
-
PubMed
Cambridge, S.B., Gnad F., Nguyen C., Bermejo J.L., Krüger M., and Mann M.. 2011. Systems-wide proteomic analysis in mammalian cells reveals conserved, functional protein turnover. J. Proteome Res. 10:5275–5284. 10.1021/pr101183k
-
DOI
-
PubMed