

Shade and salinity responses of two dominant coastal wetland grasses: implications for light competition at the transition zone
- PMID: 34259823
- PMCID: PMC8414928
- DOI: 10.1093/aob/mcab089
Shade and salinity responses of two dominant coastal wetland grasses: implications for light competition at the transition zone
Abstract
Background: Coastal wetlands are threatened by the increased salinity that may result from sea level rise. Salinity stress alters species zonation patterns through changes in competitive outcome between species differing in salinity tolerance. This study therefore aimed to understand how salinity and light affect two dominant and competing coastal wetland grasses that differ in salt tolerance, height and photosynthetic metabolism.
Methods: The C4 species Spartina anglica and the C3 species Phragmites australis were grown at five salinity levels (0, 7, 14, 21 and 28 ppt) and two light fluxes (100 % and 50 % of natural daylight) in an outdoor experimental setup for 102 d with full access to nutrients.
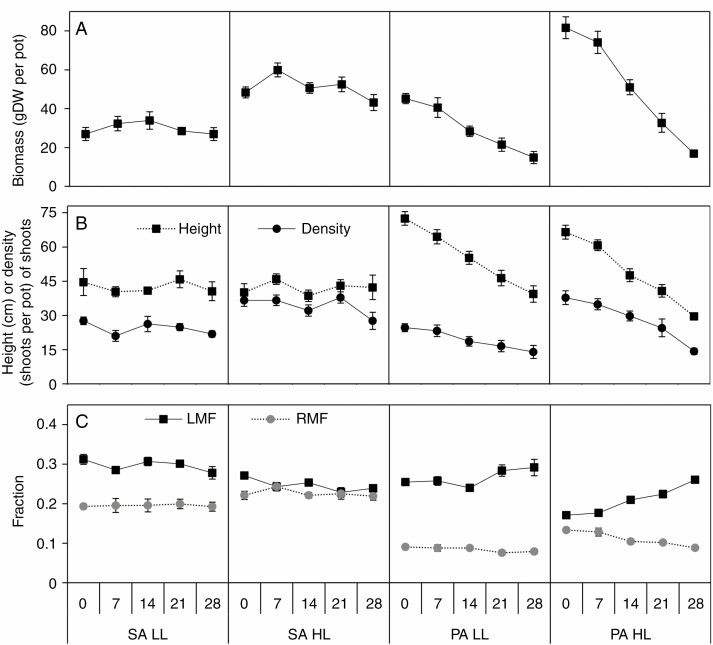
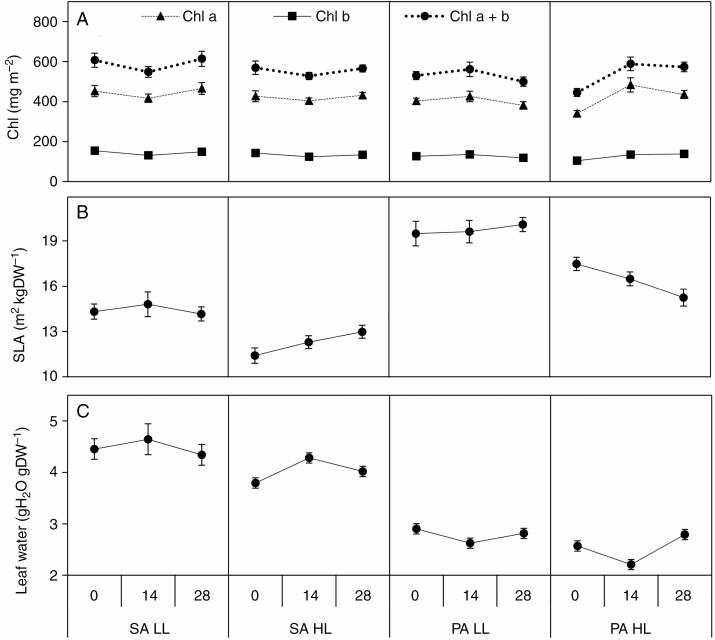
Key results: Salinity reduced the biomass, height and shoot density of P. australis from 81.7 g dry weight (DW), 0.73 m and 37 shoots per pot at a salinity of 0 ppt to 16.8 gDW, 0.3 m and 14 shoots per pot at a salinity of 28 ppt. Biomass, height and shoot density of S. anglica did not respond or were only slightly reduced at the highest salinity of 28 ppt. High salinity also resulted in a higher tissue concentration of N and P in P. australis. Both species had low ability to acclimate to the lower light flux. Shade acclimation in S. anglica occurred via modest changes in specific leaf area, pigment content and biomass allocation.
Conclusions: High salinity reduced traits important for light competition and increased the nutrient concentration in P. australis leaf and root biomass, while this was overall unaffected in S. anglica. This is likely to reduce the competitive ability of P. australis over S. anglica for light because at high salinities the former cannot effectively shade the lower-growing S. anglica. Neither species effectively acclimates to shade, which could explain why S. anglica does not occur in the understorey of P. australis at low salinities.
Keywords: Phragmites australis; Spartina anglica; C4 photosynthesis; Salt tolerance; ion regulation; light competition; salt exclusion; shade acclimation; sodium.
© The Author(s) 2021. Published by Oxford University Press on behalf of the Annals of Botany Company. All rights reserved. For permissions, please e-mail: journals.permissions@oup.com.
Figures


References
-
- Adler PB, Fajardo A, Kleinhesselink AR, Kraft NJB. 2013. Trait-based tests of coexistence mechanisms. Ecology Letters 16: 1294–1306. - PubMed
-
- Alvarez-Rogel J, Hernandez J, Silla RO, Alcaraz F. 1997. Patterns of spatial and temporal variations in soil salinity: Example of a salt marsh in a semiarid climate. Arid Soil Research and Rehabilitation 11: 315–329.
-
- Awad AS, Edwards DG, Campbell LC. 1990. Phosphorus enhancement of salt tolerance of tomato. Crop Science 30: 123–128.
-
- Barbier EB, Hacker SD, Kennedy C, Koch EW, Stier AC, Silliman BR. 2011. The value of estuarine and coastal ecosystem services. Ecological Monographs 81: 169–193.
-
- Bazzano M, Elmer W. 2017. Interactions and consequences of silicon, nitrogen, and Fusarium palustre on herbivory and DMSP levels of Spartina alterniflora. Estuarine Coastal and Shelf Science 198: 106–113.
Publication types
MeSH terms
LinkOut - more resources
Full Text Sources
Miscellaneous
