. 2021 Sep 9;95(19):e0086221.
doi: 10.1128/JVI.00862-21. Epub 2021 Sep 9.

SARS-CoV-2 Disrupts Proximal Elements in the JAK-STAT Pathway

Affiliations

SARS-CoV-2 Disrupts Proximal Elements in the JAK-STAT Pathway

Da-Yuan Chen et al. J Virol. .

Abstract

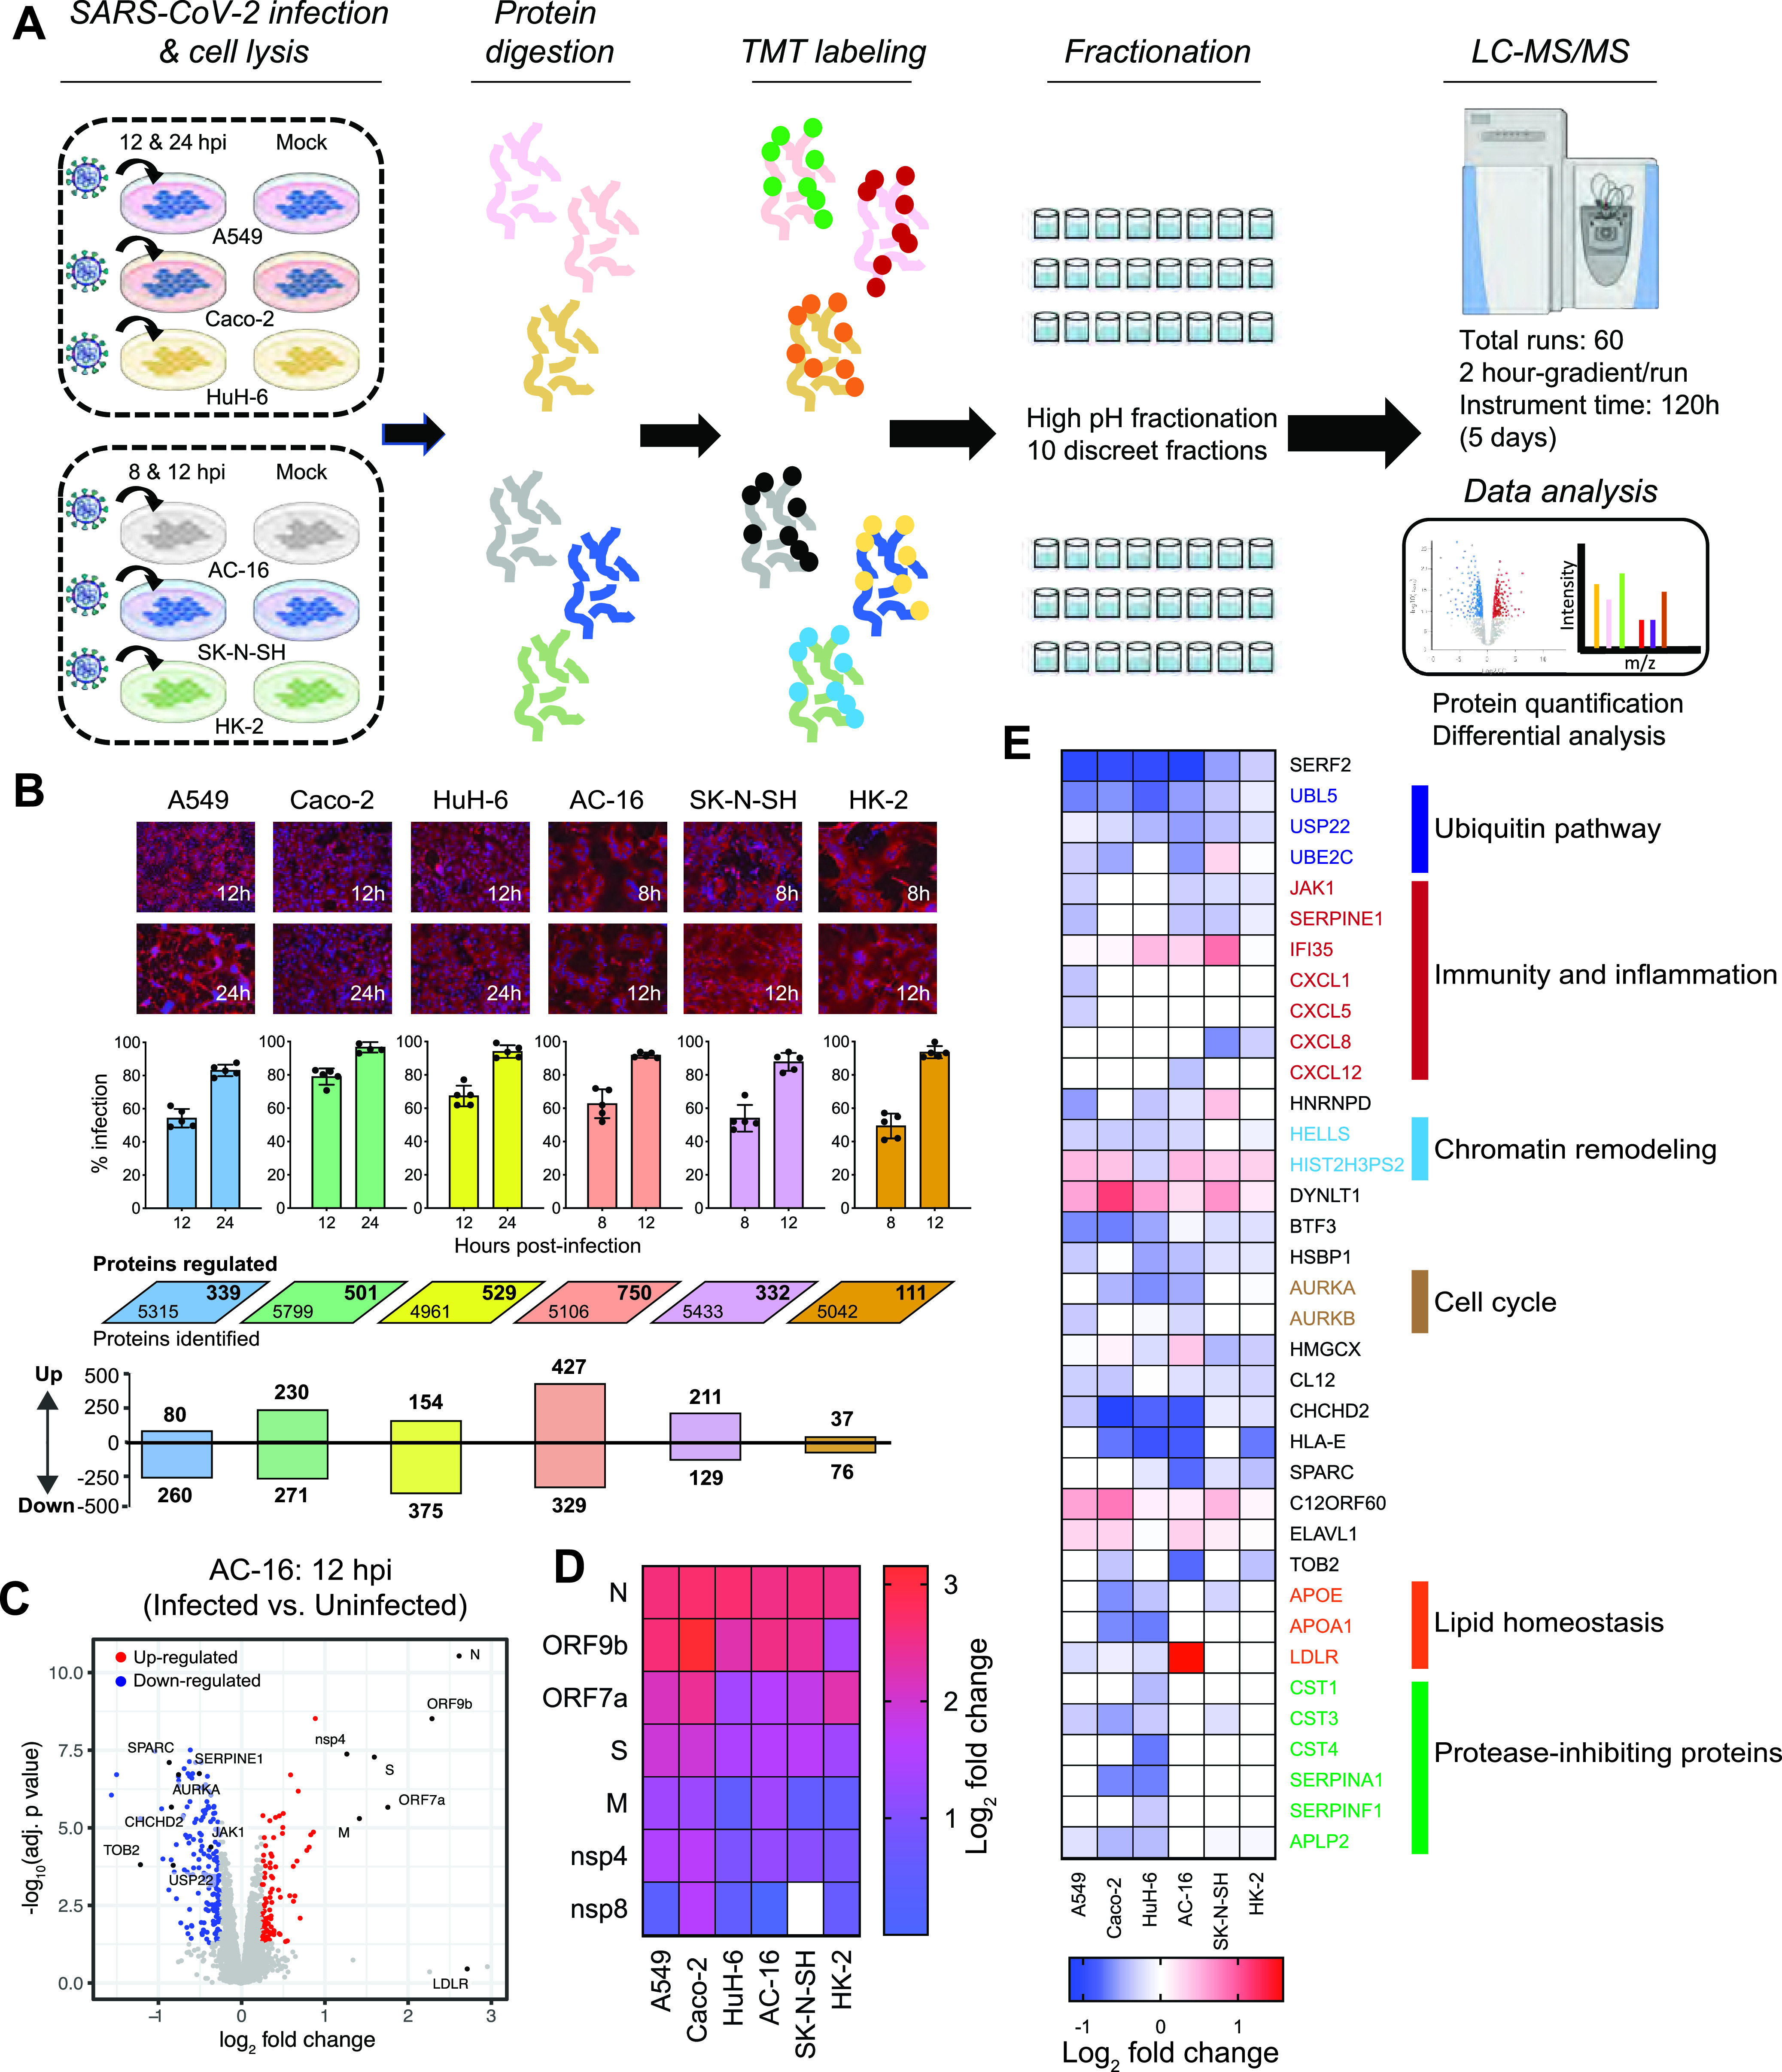
SARS-CoV-2 can infect multiple organs, including lung, intestine, kidney, heart, liver, and brain. The molecular details of how the virus navigates through diverse cellular environments and establishes replication are poorly defined. Here, we generated a panel of phenotypically diverse, SARS-CoV-2-infectible human cell lines representing different body organs and performed longitudinal survey of cellular proteins and pathways broadly affected by the virus. This revealed universal inhibition of interferon signaling across cell types following SARS-CoV-2 infection. We performed systematic analyses of the JAK-STAT pathway in a broad range of cellular systems, including immortalized cells and primary-like cardiomyocytes, and found that SARS-CoV-2 targeted the proximal pathway components, including Janus kinase 1 (JAK1), tyrosine kinase 2 (Tyk2), and the interferon receptor subunit 1 (IFNAR1), resulting in cellular desensitization to type I IFN. Detailed mechanistic investigation of IFNAR1 showed that the protein underwent ubiquitination upon SARS-CoV-2 infection. Furthermore, chemical inhibition of JAK kinases enhanced infection of stem cell-derived cultures, indicating that the virus benefits from inhibiting the JAK-STAT pathway. These findings suggest that the suppression of interferon signaling is a mechanism widely used by the virus to evade antiviral innate immunity, and that targeting the viral mediators of immune evasion may help block virus replication in patients with COVID-19. IMPORTANCE SARS-CoV-2 can infect various organs in the human body, but the molecular interface between the virus and these organs remains unexplored. In this study, we generated a panel of highly infectible human cell lines originating from various body organs and employed these cells to identify cellular processes commonly or distinctly disrupted by SARS-CoV-2 in different cell types. One among the universally impaired processes was interferon signaling. Systematic analysis of this pathway in diverse culture systems showed that SARS-CoV-2 targets the proximal JAK-STAT pathway components, destabilizes the type I interferon receptor though ubiquitination, and consequently renders the infected cells resistant to type I interferon. These findings illuminate how SARS-CoV-2 can continue to propagate in different tissues even in the presence of a disseminated innate immune response.

Keywords: IFN antagonism; IFN signaling; JAK-STAT pathway; SARS-CoV-2; human cell lines; immune evasion; proteomics; virus-host interactions.


Figures

FIG 1
FIG 1
Susceptibility of human cells to SARS-CoV-2 infection. (A) Description of each cell line used in this study. (B) The indicated cells were infected with SARS-CoV-2 at an MOI of 1 or 5 and stained with the viral nucleocapsid (N) protein (red) at 24 hpi. The nuclei were counterstained with DAPI. The mean percentage of positive cells ± standard deviation from three biological replicates is shown. (C) Total abundance of ACE2 in cells and its cell surface-associated fraction was measured by Western blotting (left) and flow cytometry (right), respectively. (D) Cell surface expression of ACE2 in cells transduced to express ACE2 and TMPRSS2. (E) The cells were infected with SARS-CoV-2 at an MOI of 1, followed by IF analysis of the viral N-protein (red). The nuclei were stained with DAPI. The mean percentage of positive cells ± standard deviation from three biological replicates is shown.
FIG 2
FIG 2
Global proteomic analysis of SARS-CoV-2-infected cells. (A) Schematics of the proteomics pipeline. Total protein was extracted from the SARS-CoV-2-infected and uninfected cells, trypsinized, and isotope (TMT) labeled. The peptides for each cell line were separately pooled, fractionated, sequenced, and quantified by liquid chromatography-tandem mass spectrometry (LC-MS/MS). (B) The cells were infected with SARS-CoV-2 at an MOI of 1 and processed at 12 and 24 hpi (A549, Caco-2, and HuH-6) or at 8 and 12 hpi (AC-16 and SK-N-SH) for IF and proteomic analysis. The top panel shows the IF images (red color, viral N protein; blue color, DAPI). The percentage of positive cells was measured and plotted as the mean ± standard deviation from five microscopic fields. The rhomboids show the total number of proteins identified in uninfected and infected cells (lower left corner) as well as the total number of regulated proteins in each cell line across both time points following SARS-CoV-2 infection (upper right corner). Numbers of distinct proteins up- or downregulated after infection are shown in the bottom panel. In certain cases, the total numbers of up- and downregulated proteins do not match the numbers shown in rhomboids. This is due to some proteins downregulated at one time point and upregulated at the other time point. (C) Volcano plot of proteins regulated in AC-16 cells upon SARS-CoV-2 infection. Proteins enriched in infected cells are shown in red, while those depleted are in blue. Black color is used for the proteins labeled with their names. (D) Heat map showing the abundance of viral proteins in different cell lines. (E) Heatmap visualization of cellular proteins found to be differentially regulated in more than one cell line. The pathways to which some of these proteins belong are shown on the right.
FIG 3
FIG 3
Validation of proteomic results by Western blotting. (A) ACE2/TMPRSS2-expressing A549, Caco-2, HuH-6, AC-16, and SK-N-SH cells were infected with freshly prepared SARS-CoV-2. As a control, Huh-6 cells were infected with YFV 17D virus containing the NeonGreen reporter (MOI of 1) and Caco-2 cells with CVB3 containing the GFP reporter. The cells were fixed at the indicated times and processed for IF and/or imaging. (B) The cells were lysed in RIPA buffer followed by Western blot analysis of the indicated proteins. An equal amount of total protein (25 μg), as quantified by the BCA assay, was loaded in each lane. The black arrows indicate the protein bands of expected sizes. M, mock. The numbers indicate band intensities, with the uninfected cell values arbitrarily set at 1. The experiment was done only once; however, different cell lines were infected at different times to ensure the rigor and reproducibility of our results. (C) The SARS-CoV-2 numbers from panel B were pooled and plotted as a graph. *, P value between 0.01 and 0.05; **, P ≤ 0.01, as calculated by a two-tailed, unpaired t test with Welch’s correction.
FIG 4
FIG 4
SARS-CoV-2 disrupted the expression of IFNAR1 and JAK proteins. All cells used in this figure were engineered to overexpress ACE2 and TMPRSS2. (A) A549, Caco-2, and HuH-6 cells were infected with SARS-CoV-2 at an MOI of 1 for 24 h and AC-16 and SK-N-SH for 12 h, followed by Western blotting. The numbers indicate band intensities, with the uninfected cell values arbitrarily set at 1. The black arrows indicate the protein bands of expected sizes. The experiment was performed once; however, different cell lines were infected at different times to ensure reproducibility of our results. (B) Caco-2 cells were infected with either the Washington isolate (two replicates) or the New York isolate (one replicate) of SARS-CoV-2 (MOI of 1) for 24 h, and the expression of JAK1, Tyk2, and β-actin was analyzed by Western blotting. The band intensities relative to uninfected cells are shown. The numbers from these independently performed Western blots, representing three biological replicates (two with the Washington isolate and one with a New York isolate), were pooled and plotted as a graph in the bottom panel. ****, P = 0.0009; ***, P = 0.004; calculated by a two-tailed, unpaired t test with Welch’s correction. (C and D) Caco-2 (C) and SK-N-SH (D) cells were infected with SARS-CoV-2 at an MOI of 1, followed by detection of the indicated proteins by Western blotting. The band intensities relative to uninfected cells are shown. Representative images from two experimental repeats are shown. (E and F) hiPSC-CMs were infected with SARS-CoV-2 at an MOI of 5 (calculated based on virus titration in Vero E6 cells) for 72 h, followed by IF (E) and Western blotting (F). The relative band intensities are shown. The experiment was only performed once.
FIG 5
FIG 5
SARS-CoV-2 inhibited IFN signaling. (A) Uninfected Caco-2 cells or the ones infected with SARS-CoV-2 (MOI of 1) for 24 h were treated with human IFN-α (1 nM) or, as a negative control, with vehicle (PBS) for 30 min, followed by Western blotting. The band intensities of the phospho-STATs were normalized against the total STATs and plotted in the bottom panel as a percentage of uninfected cells. The data are presented as mean ± standard deviation from two experimental repeats. (B) Uninfected or SARS-CoV-2-infected Caco-2 cells (24 hpi) were treated with 0, 0.01, 0.1, or 1 nM IFN-α for 30 min and subjected to Western blotting. The band intensities from two experimental repeats are presented as mean ± standard deviation on the right. The intensities for untreated cells were set at 100, and the percent increase in IFN-treated cells was measured by calculating the ratio between IFN-treated and untreated cells. (C) Uninfected or SARS-CoV-2-infected Vero E6 cells were treated with 1 nM IFN-α for 30 min and subjected to Western blotting. (D and E) Uninfected or SARS-CoV-2-infected Caco-2 or Vero E6 cells (24 hpi) were treated with 0, 50, or 100 ng/ml IL-6 for 30 min and subjected to Western blotting. The graphs show the mean ± standard deviation band intensities from two experimental repeats. (F) Caco-2 cells infected with SARS-CoV-2 for 24 h were exposed to 0.1 or 1 nM IFN-α for 30 min and stained for the viral N protein (green) and STAT1 (red). The nuclei were stained with DAPI (blue). The nuclear translocation of STAT1 is indicated with white arrowheads. (G) Caco-2 cells, uninfected or infected with SARS-CoV-2 for 24 h, were treated with IFN (1 nM) for 1, 2, 4, or 8 h, and RNA levels of MX1 and Viperin (also called RSAD2) were measured by RT-qPCR. RPS11 served as a housekeeping gene. The data are plotted as mean ± standard deviation from three biological replicates.
FIG 6
FIG 6
SARS-CoV-2 destabilized the IFNAR1 protein. (A) mRNA levels of IFNAR1 were analyzed by RT-qPCR in Caco-2 cells infected with SARS-CoV-2 for the indicated times. RPS11 mRNA levels were used for data normalization. The data are plotted as mean ± standard deviation from three biological replicates. NS, nonsignificant, as calculated by a two-tailed, unpaired t test with Welch’s correction. (B) Ubiquitination of ectopically expressed IFNAR1 was examined in 293T/ACE2/TMPRSS2 cells infected with SARS-CoV-2. Thapsigargin treatment served as a positive control. The numbers indicate band intensities, with the uninfected cell numbers arbitrarily set at 1. (C) Ubiquitination of endogenous IFNAR1 following SARS-CoV-2 infection, as assessed by the binding of TR-TUBE to the IFNAR1 protein. Cells infected with VSV were included as a positive control. A representative image from one of the two experimental repeats is shown. The numbers indicate band intensities, with the uninfected cell numbers arbitrarily set at 1. (D) Uninfected or SARS-CoV-2-infected Caco-2 cells (24 hpi) were treated with 0, 0.01, 0.1, or 1 nM IFN-α for 20 min and subjected to Western blotting with antibodies specific for the indicated phosphoforms of JAK1 and Tyk2. (E) hiPSC-CMs were infected with SARS-CoV-2 at an MOI of 5 in the presence of DMSO or 5 μM compounds. IF was performed at 12, 18, and 24 hpi, and the number of positive cells was counted by Muvicyte (see Materials and Methods). The data are plotted as mean ± standard deviation from five biological replicates from two experimental repeats. **, P = 0.006; **, P = 0.0002; calculated by a two-tailed, unpaired t test with Welch’s correction. (F) Model of the JAK-STAT inhibition by SARS-CoV-2. Proteins and signaling steps disrupted by the virus are indicated with red inhibition arcs.

References

    1. Zhou P, Yang X-L, Wang X-G, Hu B, Zhang L, Zhang W, Si H-R, Zhu Y, Li B, Huang C-L, Chen H-D, Chen J, Luo Y, Guo H, Jiang R-D, Liu M-Q, Chen Y, Shen X-R, Wang X, Zheng X-S, Zhao K, Chen Q-J, Deng F, Liu L-L, Yan B, Zhan F-X, Wang Y-Y, Xiao G-F, Shi Z-L. 2020. A pneumonia outbreak associated with a new coronavirus of probable bat origin. Nature 579:270–273. 10.1038/s41586-020-2012-7. - DOI - PMC - PubMed
    1. Borczuk AC, Salvatore SP, Seshan SV, Patel SS, Bussel JB, Mostyka M, Elsoukkary S, He B, Del Vecchio C, Fortarezza F, Pezzuto F, Navalesi P, Crisanti A, Fowkes ME, Bryce CH, Calabrese F, Beasley MB. 2020. COVID-19 pulmonary pathology: a multi-institutional autopsy cohort from Italy and New York City. Mod Pathol 33:2156–2168. 10.1038/s41379-020-00661-1. - DOI - PMC - PubMed
    1. Qian Q, Fan L, Liu W, Li J, Yue J, Wang M, et al.. 2020. Direct evidence of active SARS-CoV-2 replication in the intestine. Clin Infect Dis 10.1093/cid/ciaa925. - DOI - PMC - PubMed
    1. Lamers MM, Beumer J, van der Vaart J, Knoops K, Puschhof J, Breugem TI, Ravelli RBG, Paul van Schayck J, Mykytyn AZ, Duimel HQ, van Donselaar E, Riesebosch S, Kuijpers HJH, Schipper D, van de Wetering WJ, de Graaf M, Koopmans M, Cuppen E, Peters PJ, Haagmans BL, Clevers H. 2020. SARS-CoV-2 productively infects human gut enterocytes. Science 369:50–54. 10.1126/science.abc1669. - DOI - PMC - PubMed
    1. Wang Y, Liu S, Liu H, Li W, Lin F, Jiang L, Li X, Xu P, Zhang L, Zhao L, Cao Y, Kang J, Yang J, Li L, Liu X, Li Y, Nie R, Mu J, Lu F, Zhao S, Lu J, Zhao J. 2020. SARS-CoV-2 infection of the liver directly contributes to hepatic impairment in patients with COVID-19. J Hepatol 73:807–816. 10.1016/j.jhep.2020.05.002. - DOI - PMC - PubMed

Publication types