. 2021 Jul 13;118(28):e2022960118.
doi: 10.1073/pnas.2022960118.

Prednisolone rescues Duchenne muscular dystrophy phenotypes in human pluripotent stem cell-derived skeletal muscle in vitro

Affiliations

Prednisolone rescues Duchenne muscular dystrophy phenotypes in human pluripotent stem cell-derived skeletal muscle in vitro

Ziad Al Tanoury et al. Proc Natl Acad Sci U S A. .

Abstract

Duchenne muscular dystrophy (DMD) is a devastating genetic disease leading to degeneration of skeletal muscles and premature death. How dystrophin absence leads to muscle wasting remains unclear. Here, we describe an optimized protocol to differentiate human induced pluripotent stem cells (iPSC) to a late myogenic stage. This allows us to recapitulate classical DMD phenotypes (mislocalization of proteins of the dystrophin-associated glycoprotein complex, increased fusion, myofiber branching, force contraction defects, and calcium hyperactivation) in isogenic DMD-mutant iPSC lines in vitro. Treatment of the myogenic cultures with prednisolone (the standard of care for DMD) can dramatically rescue force contraction, fusion, and branching defects in DMD iPSC lines. This argues that prednisolone acts directly on myofibers, challenging the largely prevalent view that its beneficial effects are caused by antiinflammatory properties. Our work introduces a human in vitro model to study the onset of DMD pathology and test novel therapeutic approaches.

Keywords: Duchenne muscular dystrophy; dystrophin; myogenesis; myopathy; pluripotent stem cell.


Conflict of interest statement

Competing interest statement: O.P. and J.C. are founders and shareholders of Anagenesis Biotechnologies. R.B.-D. and E.N.O. are consultants for Exonics Therapeutics/Vertex Genetic Therapies. A.E.C. is a cofounder and Scientific Advisory Board member of Q-State Biosciences. K.K.P. is a shareholder of Emulate.

Figures

Fig. 1.
Fig. 1.
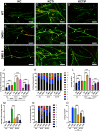
Generation and maturation of iPSC-derived myofibers. (A) Schematic description of the two-step myogenic differentiation protocol. (B) RNA-seq analysis of the myogenic differentiation of WT human iPSCs in vitro. Heat map showing expression levels of selected myogenic markers at different time points during primary differentiation, proliferation in SKGM after replating, and secondary differentiation in KC, KCTi, or KCTiP media. (CE) Fold changes of mRNA expression of MYH1 (C), MYH2 (D), and MYH8 (E) in secondary cultures differentiated for 1 wk in KC, KCTi, and KCTiP (n = 3, paired t test, *P < 0.05, **P < 0.01, ***P < 0.001). Bars show mean ± SD. (FK) Titin antibody staining of secondary cultures differentiated for 1 wk in KC (F and I), KCTi (G and J), and KCTiP (H and K) media. (Scale bars: 100 μm in FH and 25 μm in IK.) (LN) Dystrophin immunocytochemistry analysis following secondary differentiation for 1 wk in KC (L), KCTi (M), and KCTiP (N) media. (Scale bars: 50 μm.) (OQ) Transmission electron microscopy images of secondary cultures differentiated for 10 d in KC (O), KCTi (P), and KCTiP (Q). (Scale bars: 500 nm.) (R) Percentage of myofibers with mature sarcomeres identified by transmission electron microscopy of secondary cultures differentiated for 10 d in KC, KCTi, and KCTiP. Bars show mean ±SD (n = 2). (S) Length of Z-bodies/lines (nanometers) identified by transmission electron microscopy of secondary cultures differentiated for 10 d in KC, KCTi, and KCTiP. Bars show mean ± SD (n = 2, one-way ANOVA followed by Tukey’s multiple comparisons test, ANOVA P value < 0.0001, **P < 0.01, ***P < 0.001).
Fig. 2.
Fig. 2.
Characterization of isogenic DMD mutant human iPSC lines. (A) Western blot analysis with an anti-dystrophin antibody in two independent clones of the exon 52 deletion mutant (DMDI) and the exon 52-point mutation mutant (DMDII). (Bottom) Tubulin loading control. (BD) Dystrophin expression detected by immunocytochemistry in WT (B), DMDI (C), and DMDII (D) mutant lines after secondary differentiation for 1 wk in KCTiP medium. (Scale bars: 100 μm.) (E) Immunocytochemistry analysis of myogenic precursors using myogenin (MYOG) antibody after 2 d of secondary differentiation in SKGM medium in WT (Left), DMDI (Middle), and DMDII (Right) mutant lines. (Scale bars: 200 μm.) (F) Quantification of MYOG-positive cells in myogenic cultures of WT and DMD lines after 2 d of differentiation in SKGM medium (n = 7, paired t test, **P < 0.01, ****P < 0.0001). Bars show mean ± SD. (G) Quantification of PAX7-positive cells in myogenic cultures of WT and DMD lines after 2 d of differentiation in SKGM medium (n = 7, paired t test, **P < 0.01; ns, not significant). Bars show mean ± SD. (HJ) Immunocytochemistry analysis of WT (Left), DMDI (Middle), and DMDII (Right) lines after secondary differentiation in KCTiP medium for 1 wk. (H) Desmin, (I) α-actinin, (J) titin (TTN). (Scale bars: 100 μm.) (KM) Immunocytochemistry analysis of WT (Left), DMDI (Middle), and DMDII (Right) lines after secondary differentiation in KCTiP medium for 1 wk. (K) DAG1, (L) nNOS, (M) Delta-sarcoglycan. (Scale bars: 50 μm.) (N) RNA-seq analysis of the myogenic differentiation of WT and DMDI and DMDII mutant lines in vitro. Heat map showing expression levels of selected myogenic markers after 1 wk of secondary differentiation in KC medium.
Fig. 3.
Fig. 3.
Myofibers differentiated in vitro from dystrophin-deficient iPSC lines exhibit increased branching defects. (AI) Isolated fibers from secondary cultures WT (A, D, and G), DMDI (B, E, and H), and DMDII (C, F, and I) iPSC lines labeled with membrane GFP (green) and mCherry (red) signals differentiated for 1 wk in KC (AC), KCTi (DF), or KCTiP (GI) medium. Yellow arrowheads indicate branching points. (Scale bars: 20 µm.) (J and K) Quantitative analysis of the number (#) of branching points in WT and DMD isogenic lines in the different culture media. ***P < 0.0001, NS: P > 0.05. Bars show mean ± SEM. (L) Quantitative analysis of the number of nuclei per fiber in WT and DMD isogenic lines in the different culture media. ***P < 0.0001, NS: P > 0.05. Bars show mean ± SEM. (M and N) Quantitative analysis of the number of branching points in TX1-Unc and TX1-Cor isogenic lines in the different culture media. ***P < 0.0001. Bars show mean ± SEM. No data are shown for TX1-Unc in KC medium (NA) as myogenic differentiation from these lines was poorly efficient in this condition. (O) Quantitative analysis of the number of nuclei per fiber in TX1-Unc and TX1-Cor isogenic lines in the different culture media. **P < 0.01, ***P < 0.0001. Bars show mean ± SEM. Kruskal–Wallis nonparametric ANOVA test with planned multiple comparisons.
Fig. 4.
Fig. 4.
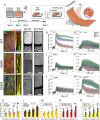
Dystrophin mutant fibers derived in vitro exhibit contractile defects. (A) Experimental protocol and schematic illustration of MTF assay, for measuring contractile force. (BD) Representative immunofluorescent micrograph of skeletal muscles grown on micromolded gelatin substrates, showing aligned confluent tissues (B) WT, (C) DMD I, and (D) DMD II (DAPI: blue, α-actinin: green, actin: red), with high-magnification inset showing sarcomere expression. (Scale bars: 100 μm Left, 10 μm Right.) (EG) Bright-field micrographs of MTF cantilevers (top-down view) for WT (E), DMD I (F), and DMD II (G) myofibers cultured in KCTi (Left) and KCTiP (Right) media after stimulation (99 Hz), showing increased contraction in DMD cells after exposure to prednisolone. (Scale bars: 1 mm.) (HJ) Skeletal muscle contractile force as a function of stimulation time for WT (H), DMDI (I), and DMDII (J) mutant iPSC lines, demonstrating a positive force frequency relationship in the absence of dystrophin disruption (cells stimulated between 1.5 and 8 s at 2 to 99 Hz). (KN) Comparison of peak contractile stresses generated by MTFs paced at 2 to 99 Hz. Showing a stronger contractile phenotype for WT cells (K) but a recovery of contractile phenotype in the presence of prednisolone treatment (KCTiP) (LN). (n > 22; SI Appendix, Table S1; *P < 0.05, **P < 0.01, ***P < 0.001). (OQ) Skeletal muscle contractile force as a function of stimulation time for DMD patient-derived cells (uncorrected in O and Q, corrected in P) in KCTi (O and P) and KCTiP (Q) media (cells were stimulated between 1.5 and 8 s at 2 to 99 Hz). (R) Peak contractile stress generated by patient derived cells paced at 2 to 99 Hz, showing a recovery of contractile phenotype for patient cells treated with prednisolone or corrected with CRISPR-Cas9. (n > 15; SI Appendix, Table S2). (Scale bars: 1 mm.) Pairwise t tests. All error bars given as the SEM.
Fig. 5.
Fig. 5.
All-optical profiling of Ca2+ responses in healthy and dystrophic human iPSC myofibers. (A) Schematic of experimental timeline. Myocyte precursors are plated at low density in growth medium and inoculated with a lentiviral vector encoding CheRiff after 24 h. After 72 h, cells have reached confluence and are switched to differentiation media and cultured for seven additional days in KCTi medium. After 7 d of differentiation, cultures are incubated with the Ca2+-sensitive dye CaSiR-1 AM and measured. (B) Diagram of optical setup. Red Ca2+-sensitive dyes are excited using oblique illumination, and Ca2+-sensitive fluorescence in the near infrared is collected with a high-numerical-aperture widefield objective. CheRiff stimulation is spatially targeted using a digital micromirror device. (C) Example image of blue-light-induced Ca2+ response in a dish of iPSC cell-derived myocytes. (Scale bar: 1 mm.) (D) Profiling Ca2+ response as a function of blue-light drive. Simultaneous differentiations of WT, DMDI, and DMDII cell lines (n = 6 dishes of each) were characterized via their Ca2+ response to optogenetic stimulation across a range of drive frequencies (0.5 Hz to 20 Hz). Average traces reveal statistically significant differences between DMDI and NCRM1 (WT) lines (red asterisks) and between DMDII and NRCM1 (WT) lines (yellow asterisks). DMDI and DMDII lines showed no significant difference in Ca2+ responses. (E) Same experiment as in D, but with parallel differentiations of a patient-derived iPSC line (TX1-Unc) and a corrected comparison (TX1-Cor) (n = 6 dishes of each). For patient-derived cells, n = 6 samples were analyzed for both TX1-Cor and TX1-Unc for the first replicate. (F) Replicate experiment comparing TX1-Cor and TX1-Unc patient-derived cultures, in which Ca2+ signals are imaged with BioTracker 609 and normalized relative to responses to ionomycin application (10 μM). n = 4 samples were analyzed for each condition in the second replicate. Paired two-sample t tests. Confidence intervals of *P < 0.05, **P < 0.01, and ***P < 0.001.

References

    1. Rahimov F., Kunkel L. M., The cell biology of disease: Cellular and molecular mechanisms underlying muscular dystrophy. J. Cell Biol. 201, 499–510 (2013). - PMC - PubMed
    1. Matthews E., Brassington R., Kuntzer T., Jichi F., Manzur A. Y., Corticosteroids for the treatment of Duchenne muscular dystrophy. Cochrane Database Syst. Rev. 2016, CD003725 (2016). - PMC - PubMed
    1. Petrof B. J., Shrager J. B., Stedman H. H., Kelly A. M., Sweeney H. L., Dystrophin protects the sarcolemma from stresses developed during muscle contraction. Proc. Natl. Acad. Sci. U.S.A. 90, 3710–3714 (1993). - PMC - PubMed
    1. Burr A. R., Molkentin J. D., Genetic evidence in the mouse solidifies the calcium hypothesis of myofiber death in muscular dystrophy. Cell Death Differ. 22, 1402–1412 (2015). - PMC - PubMed
    1. Brenman J. E., Chao D. S., Xia H., Aldape K., Bredt D. S., Nitric oxide synthase complexed with dystrophin and absent from skeletal muscle sarcolemma in Duchenne muscular dystrophy. Cell 82, 743–752 (1995). - PubMed

Publication types

MeSH terms

LinkOut - more resources