. 2021 Jul 14;17(7):e1009753.
doi: 10.1371/journal.ppat.1009753. eCollection 2021 Jul.

COVID-19 virtual patient cohort suggests immune mechanisms driving disease outcomes

Affiliations

COVID-19 virtual patient cohort suggests immune mechanisms driving disease outcomes

Adrianne L Jenner et al. PLoS Pathog. .

Abstract

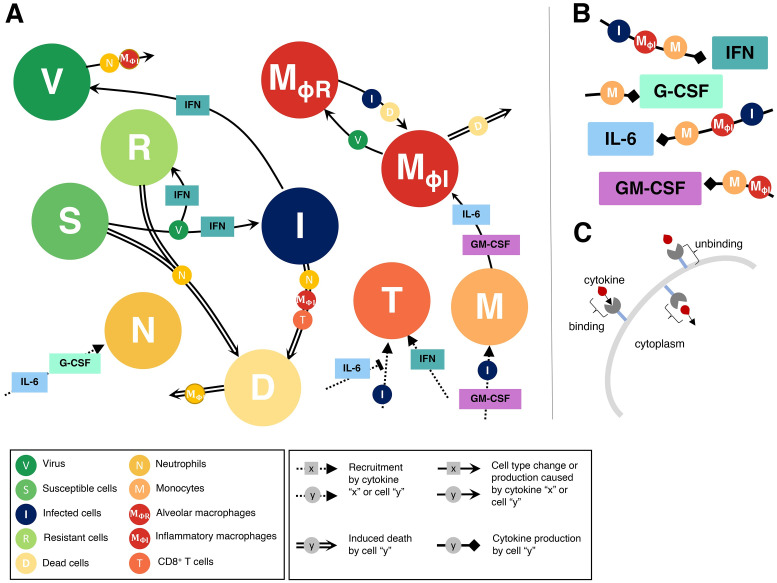
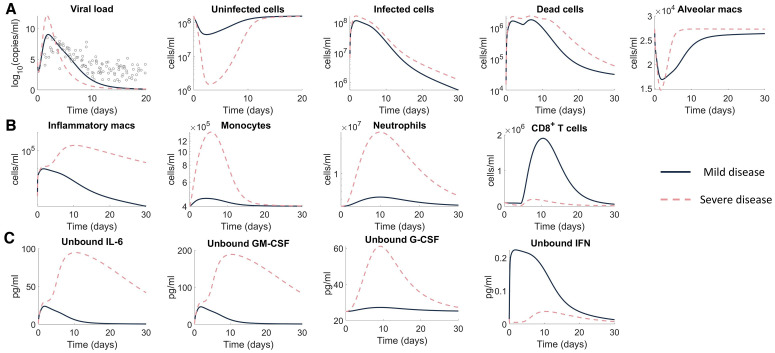
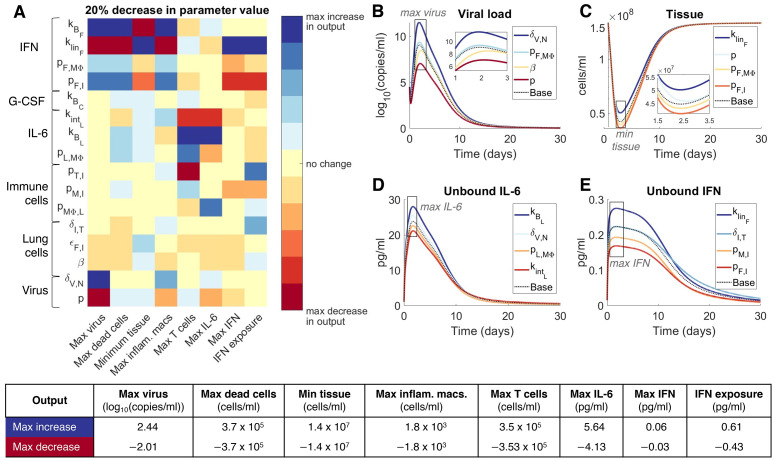
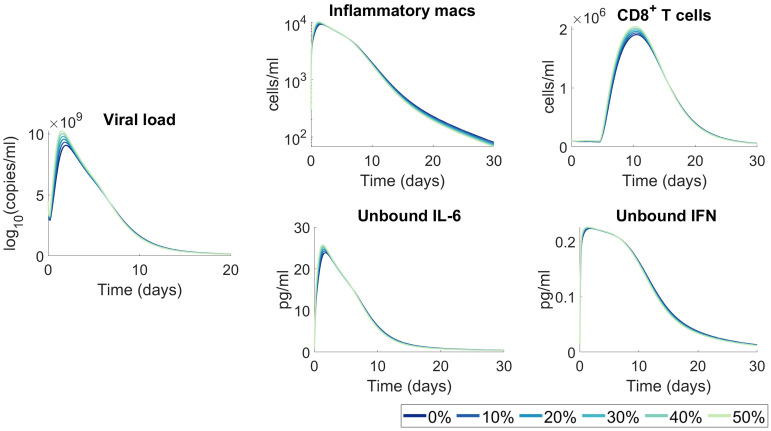
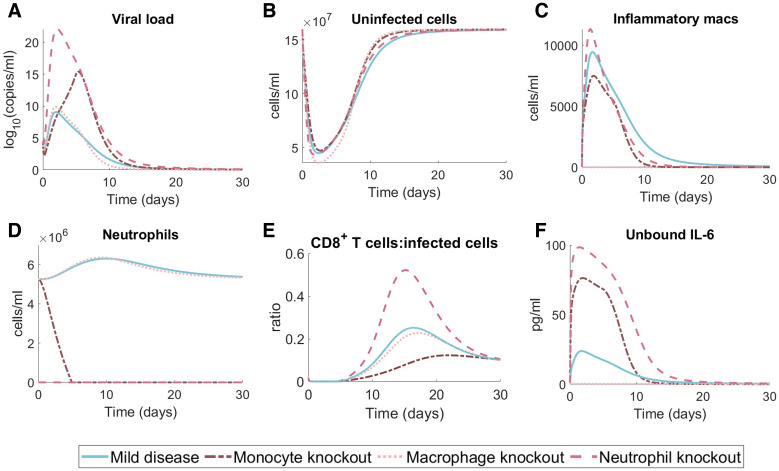
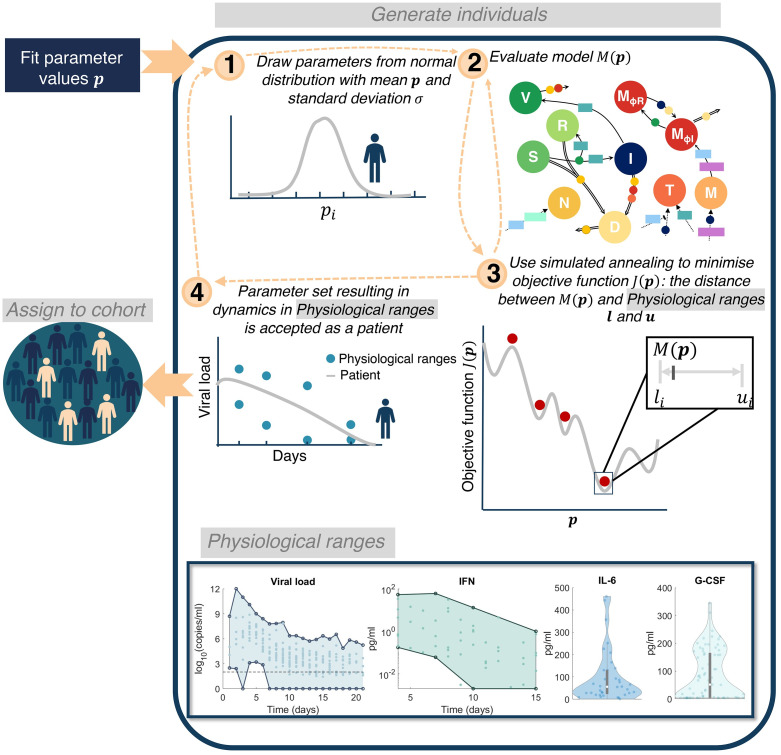
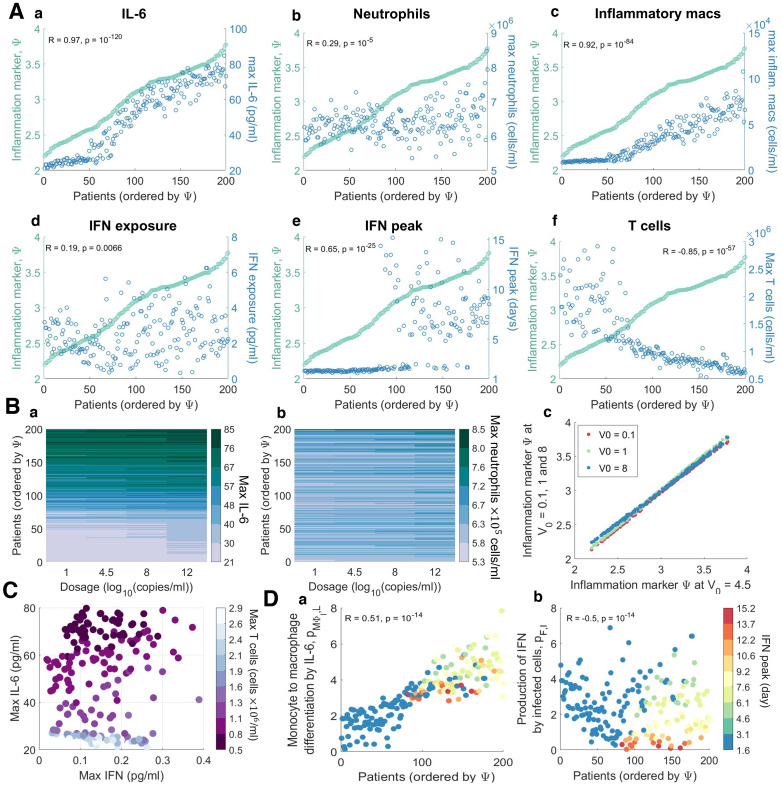
To understand the diversity of immune responses to SARS-CoV-2 and distinguish features that predispose individuals to severe COVID-19, we developed a mechanistic, within-host mathematical model and virtual patient cohort. Our results suggest that virtual patients with low production rates of infected cell derived IFN subsequently experienced highly inflammatory disease phenotypes, compared to those with early and robust IFN responses. In these in silico patients, the maximum concentration of IL-6 was also a major predictor of CD8+ T cell depletion. Our analyses predicted that individuals with severe COVID-19 also have accelerated monocyte-to-macrophage differentiation mediated by increased IL-6 and reduced type I IFN signalling. Together, these findings suggest biomarkers driving the development of severe COVID-19 and support early interventions aimed at reducing inflammation.


Conflict of interest statement

The authors have declared that no competing interests exist.

Figures

Fig 1
Fig 1. Immune response to SARS-CoV-2 infection model schematic.
The model in Eqs. S1-S22 reduced to A) cell dynamics B) cytokine production dynamics and C) cytokine binding kinetics. Unique lines represent induced cell death (double line), recruitment (dashed line), cell type change or production (solid line), and cytokine production (square arrow). Cell and/or cytokines along joining lines denote a causal interaction. A) Virus (V) infects susceptible lung epithelial cells and creates either infected (I) or resistant (R) cells depending on the concentration of type I IFN. Infected cells then either die and produce new virus or are removed via inflammatory macrophages (MΦI) or CD8+ T cells (T) that induce apoptosis to create dead cells (D). Neutrophils (N) cause bystander damage (death) in all epithelial cells and are recruited by individually G-CSF and IL-6 concentrations. CD8+ T cells are recruited by infected cells and their population expands from IFN signalling. T cell recruitment is inhibited by IL-6 concentrations. Monocytes (M) are recruited by infected cells and GM-CSF and differentiate into inflammatory macrophages based on the individual concentrations of GM-CSF and IL-6. Tissue-resident macrophages (MΦR) also become inflammatory macrophages through interaction with dead and infected cells. Dead cells are cleared up by inflammatory macrophages and also cause their death. B) Type I IFN is produced by infected cells, inflammatory macrophages and monocytes. G-CSF is produced solely by monocytes and GM-CSF is produced by monocytes and macrophages. IL-6 is produced by monocytes, inflammatory macrophages and infected cells. C) Cytokine receptor binding, internalization and unbinding kinetics considered for each cell-cytokine interaction.
Fig 2
Fig 2. Viral dynamics model fit to human viral data from hospitalized patients in Singapore and Germany.
A reduced version of the full model (all cytokine and immune cells set to 0, Eqs 6–9) was fit to data from hospitalized patients, after initial estimation from viral loads in macaques [47] (S6 Fig) to estimate preliminary viral kinetic parameters. A) Virus (V) infects susceptible cells (S) making infected epithelial cells (I) which then die to produce dead cells (D) and new virus. B) Viral load data (log10(copies/mL) from eight human patients (three from Singapore S5, S6 and S18, and five from Germany, G1, G2, G5, G6, G7) were digitized from previous results [50], and parameters from the viral dynamics submodel were estimated using a non-linear squares optimization routine. β, dI, V0 and dV were estimated from the reduced viral dynamics model in A) (see Methods and S1 Table). Individual patient measurements are depicted by coloured circles. Solid black line: average model prediction; grey shaded region: predicted standard deviation from average. S (time axis) indicates the day of symptom onset.
Fig 3
Fig 3. Delayed type I IFN response impacts heavily on tissue survival in reduced model.
A) Submodel (Eqs 10–16) with all non-IFN cytokines and immune cell interactions set to zero and only considering interactions between virus (V), type I IFN, and susceptible (S), infected (I), resistant (R), and dead (D) epithelial cells. B) Predictions from the simplified model without delayed IFN production (solid lines) versus with a constant delay (τF = 5 days) (dotted lines). Grey circles (left panel): viral loads from SARS-CoV-2 infection in humans in Singapore [48] and Germany [49], digitized from Goyal et al. [50] overlayed with predicted viral dynamics. C-D) Predicted dynamics of infected and dead cells, and unbound and bound IFN concentrations from the simplified model without delayed IFN production (solid lines) versus with a constant delay (τF = 5 days) (dotted lines).
Fig 4
Fig 4. Predicting mild and severe COVID-19 dynamics.
Mild disease (solid lines) dynamics obtained by using baseline parameter estimates (S1 Table) while severe disease dynamics (dashed lines) were obtained by decreasing the production rate of type I IFN (PF,I) and increasing the production of monocytes (pM,I) and their differentiation to macrophages (ηF,MΦI). A) Viral load and lung cells concentrations (susceptible, resistant, infected, and dead cells). Solid black line with error bars indicates human data [50] (see Fig 2). B) Immune cell concentrations (inflammatory macrophages, monocytes, neutrophils, and CD8+ T cells). C) Unbound cytokine concentrations (free IL-6, GM-CSF, G-CSF, and type I IFN). Time evolution of all model variables is shown in S8 Fig (including bound cytokine and alveolar macrophages).
Fig 5
Fig 5. Parameters driving COVID-19 severity.
A local sensitivity analysis was performed by varying each parameter ±20% from its originally estimated value (mild disease parameters in Fig 4) and simulating the model. Predictions were then compared to baseline considering: Maximum viral load (max(V)), maximum concentration of dead cells (max(D)), minimum uninfected live cells (min(S+R)), maximum concentration of inflammatory macrophages (max(MΦI)), maximum number of CD8+ T cells (max(T)), maximum concentration of IL-6 (max(LU)), maximum concentration of type I IFN (max(FU)) and the total exposure to type I IFN (FU exposure). A) Heat map shows the magnitude of the change of each metric from a 20% decrease in the parameter value compared to baseline (i.e. model simulation with no change in the parameter values), where blue signifies the maximum value observed in the output metric and red signifies the minimum value observed (i.e. maximum decrease in that metric). The most sensitive parameters are shown here, for the complete parameter sensitivity results, see S9 Fig. The explicit value of the maximum increase and maximum decrease of each metric is given in the table below. B)-E) time-series dynamics of viral load, tissue (uninfected cells), and unbound IL-6 and IFN given 20% decreases in the noted parameters. Colours of the curves correspond to the colouring of the heatmap in A. Maximal(minimal) concentrations, as in A, are noted in grey boxes. E) is coloured according to IFN exposure. Base: original mild parameters (Fig 4).
Fig 6
Fig 6. Moderate increases to viral infectivity are not predicted to significantly impact immunological outcomes.
A range of viral infectivity rates (β) from 0% (base) to 50% increase were simulated. All other parameters were fixed to their value in S1 Table. The resulting model dynamics for viral load, inflammatory macrophages, CD8+ T cells, unbound IL-6 and unbound IFN were compared, and no significant changes in kinetics were predicted.
Fig 7
Fig 7. Effects of neutrophil, monocyte, and macrophage knockout on mild disease courses.
We performed in silico knockout experiments in the mild disease scenario (Fig 4, blue solid lines) by considering complete monocyte knockout (i.e. no monocyte recruitment and M(0) = 0; dark pink dash-dot line), complete macrophage knockout (i.e. not inflammatory macrophage creation via antigen stimulation or monocyte differentiation; light pink dotted line) and complete neutrophil knockout (i.e. no neutrophil recruitment and N(0) = 0; pink dashed line). Dynamics of the in silico knockout are plotted for the A) viral load, B) uninfected cells, C) inflammatory macrophages, D) neutrophils, E) CD8+ T cells relative to uninfected cells and F) unbound IL-6.
Fig 8
Fig 8. Algorithm for generating virtual patients.
Parameters in the model were first obtained through fitting to data (S1 Table). 1) Parameters relating to macrophage, IL-6 and IFN production (pMΦI,L, pL,, pF,I, pM,I, ηF,, ϵF,I, and pF,M) were generated from normal distributions with mean equal to their original fitted values and standard deviation informed by experiment observations (see Section S6.1). 2) The model evaluated is then simulated on this parameter set to obtain y(t, p). 3) A simulated annealing algorithm is then used to determine a parameter set that optimises the objective function J(p) (Eq 17). 4) Optimizing the objective function provides a parameter set for which the patient response to SARS-CoV-2 will be within the physiological ranges. This patient is then assigned to the cohort and this process is continued until 200 patients have been generated. Physiological ranges are noted in the bottom box for viral load [37], IFN [51], IL-6 [53] and G-CSF [30].
Fig 9
Fig 9. Virtual cohort of SARS-CoV-2 infected patients.
200 virtual patients were generated by sampling parameters related to macrophage, IL-6, and IFN production (pMΦI,L, pL,, pF,I, pM,I, ηF,, ϵF,I, and pF,M) from normal distributions with mean equal to their original values and standard deviation inferred from clinical observations (Fig 8). Each virtual patient had a distinct parameter set optimized to that patient’s dynamics in response to SARS-CoV-2 infection which corresponded to physiological intervals reported in the literature (see Materials and methods). A) Infection and immune response metrics (blue) in individual patients were compared to inflammatory variable Ψ (green). Each point represents an individual patient, ordered according to Ψ. The correlation coefficient (R) and p-value are indicated for each, with α<0.05 denoting significant correlations. B) The effect of exposure dose V0 on maximum IL-6 (a), maximum neutrophil counts (b) and inflammation marker Ψ (c) for V0 = 0.1, 1, 4.5 and 8 log10(copies/ml). In a and b, rows are coloured according to each virtual patient’s inflammation marker value; virtual patients were ordered by the value of Ψ from the baseline scenario in A (V0 = 4.5 log10(copies/ml)). C) Correlations between maximal IFN, IL-6, and T cell concentrations for each patient (circles). Circle colours correspond to the maximal T cell concentration of each patient. D) Parameters most correlated to the IFN peak time were the rates of macrophage production via a) IL-6 (pMΦI,L) and the b) IFN production by infected cells (pF,I). Individual patient values for these parameters are plotted as circles coloured by the patient’s corresponding day of IFN peak (see color bar). Patients were ordered by their inflammation marker Ψ.

Update of

References

    1. Mehta P, McAuley DF, Brown M, Sanchez E, Tattersall RS, Manson JJ. COVID-19: consider cytokine storm syndromes and immunosuppression. Lancet. 2020;395: 1033–1034. doi: 10.1016/S0140-6736(20)30628-0 - DOI - PMC - PubMed
    1. Zhou P, Lou Yang X, Wang XG, Hu B, Zhang L, Zhang W, et al.. A pneumonia outbreak associated with a new coronavirus of probable bat origin. Nature. 2020;579: 270–273. doi: 10.1038/s41586-020-2012-7 - DOI - PMC - PubMed
    1. Qin C, Zhou L, Hu Z, Zhang S, Yang S, Tao Y, et al.. Dysregulation of immune response in patients with coronavirus 2019 (COVID-19) in Wuhan, China. Clin Infect Dis. 2020;71: 762–768. doi: 10.1093/cid/ciaa248 - DOI - PMC - PubMed
    1. Wu F, Zhao S, Yu B, Chen YM, Wang W, Song ZG, et al.. A new coronavirus associated with human respiratory disease in China. Nature. 2020;579: 265–269. doi: 10.1038/s41586-020-2008-3 - DOI - PMC - PubMed
    1. Stebbing J, Phelan A, Griffin I, Tucker C, Oechsle O, Smith D, et al.. COVID-19: combining antiviral and anti-inflammatory treatments. Lancet Infect Dis. 2020;20: 400–402. doi: 10.1016/S1473-3099(20)30132-8 - DOI - PMC - PubMed

Publication types

MeSH terms