

Population-based prevalence surveys during the Covid-19 pandemic: A systematic review
- PMID: 34260777
- PMCID: PMC7883186
- DOI: 10.1002/rmv.2200
Population-based prevalence surveys during the Covid-19 pandemic: A systematic review
Abstract
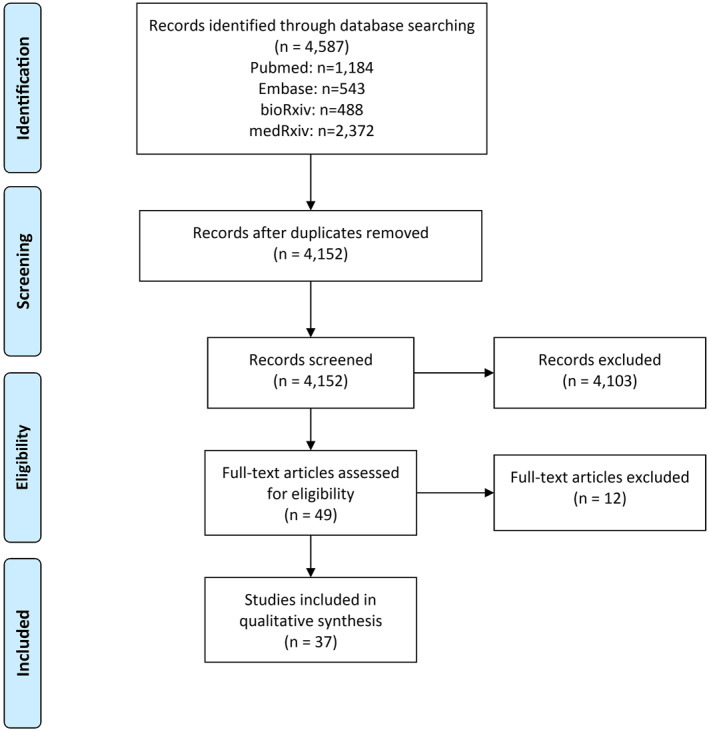
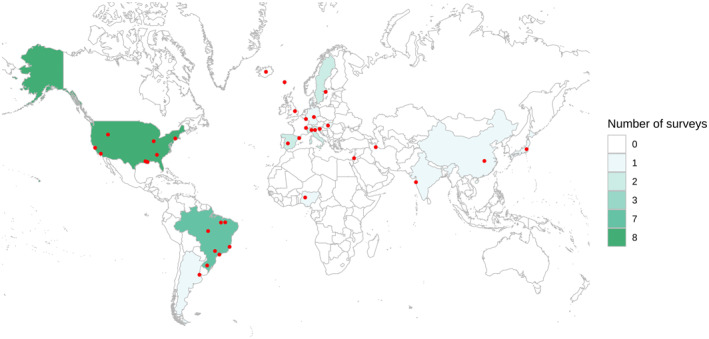
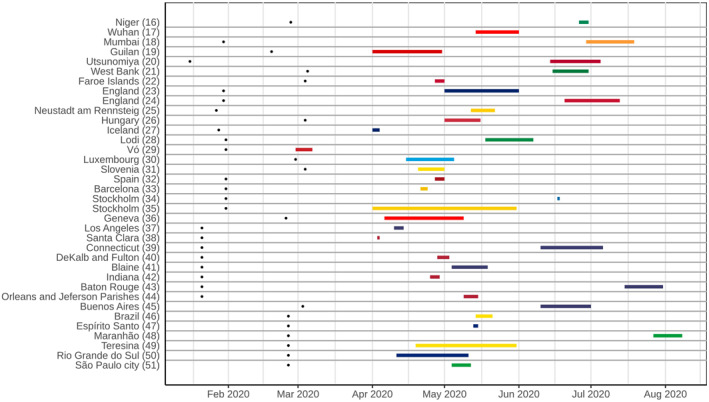
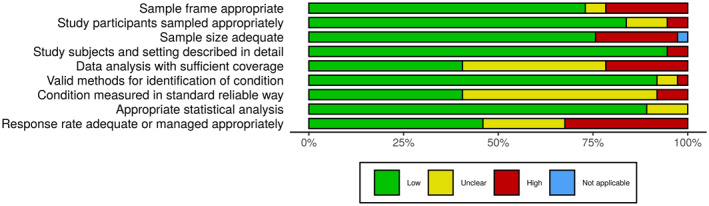
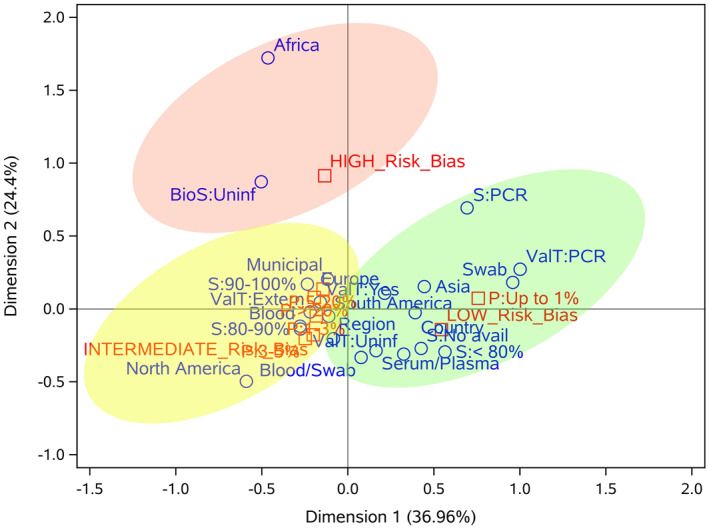
Population-based prevalence surveys of Covid-19 contribute to establish the burden of infection, the role of asymptomatic and mild infections in transmission, and allow more precise decisions about reopen policies. We performed a systematic review to evaluate qualitative aspects of these studies, assessing their reliability and compiling practices that can influence the methodological quality. We searched MEDLINE, EMBASE, bioRxiv and medRxiv, and included cross-sectional studies using molecular and/or serological tests to estimate the prevalence of Covid-19 in the general population. Survey quality was assessed using the Joanna Briggs Institute Critical Appraisal Checklist for Prevalence Studies. A correspondence analysis correlated methodological parameters of each study to identify patterns related to higher, intermediate and lower risks of bias. The available data described 37 surveys from 19 countries. The majority were from Europe and America, used antibody testing, and reached highly heterogeneous sample sizes and prevalence estimates. Minority communities were disproportionately affected by Covid-19. Important risk of bias was detected in four domains: sample size, data analysis with sufficient coverage, measurements in standard way and response rate. The correspondence analysis showed few consistent patterns for high risk of bias. Intermediate risk of bias was related to American and European studies, municipal and regional initiatives, blood samples and prevalence >1%. Low risk of bias was related to Asian studies, nationwide initiatives, reverse-transcriptase polymerase chain reaction tests and prevalence <1%. We identified methodological standards applied worldwide in Covid-19 prevalence surveys, which may assist researchers with the planning, execution and reporting of future population-based surveys.
Keywords: Covid-19; SARS-CoV-2; cross-sectional studies; epidemiology; infectious diseases; prevalence; severe acute respiratory syndrome coronavirus 2.
© 2020 John Wiley & Sons Ltd.
Conflict of interest statement
The authors declare no competing interests.
Figures
References
-
- WHO Director‐General's opening remarks at the media briefing on COVID‐19. 2020. https://www.who.int/director-general/speeches/detail/who-director-genera.... Accessed October 21, 2020.
-
- WHO coronavirus disease (COVID‐19) dashboard. https://covid19.who.int. Accessed October 21, 2020.
-
- COVID‐19 MAP. Johns Hopkins Coronavirus Resource Center. https://coronavirus.jhu.edu/map.html. Accessed October 21, 2020.
Publication types
MeSH terms
LinkOut - more resources
Full Text Sources
Medical
Miscellaneous
