. 2021 Jul 13;36(2):109362.
doi: 10.1016/j.celrep.2021.109362.

Nutritional regulation of oligodendrocyte differentiation regulates perineuronal net remodeling in the median eminence

Affiliations

Nutritional regulation of oligodendrocyte differentiation regulates perineuronal net remodeling in the median eminence

Sara Kohnke et al. Cell Rep. .

Abstract

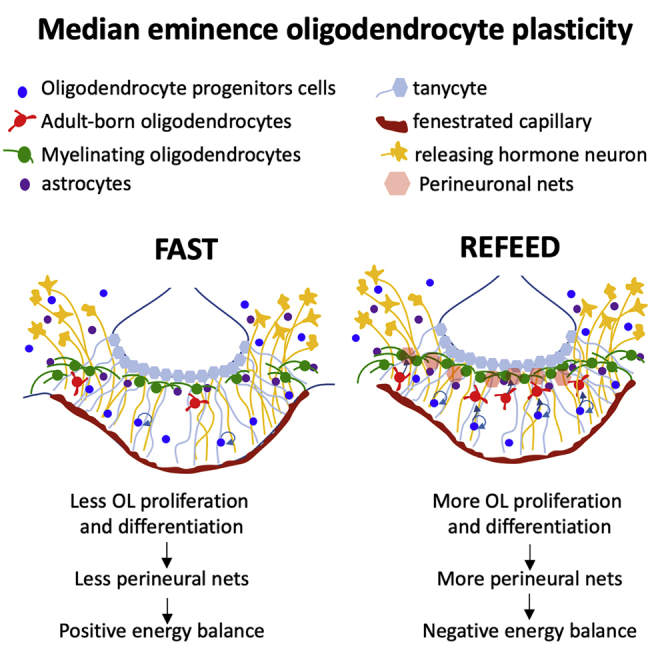
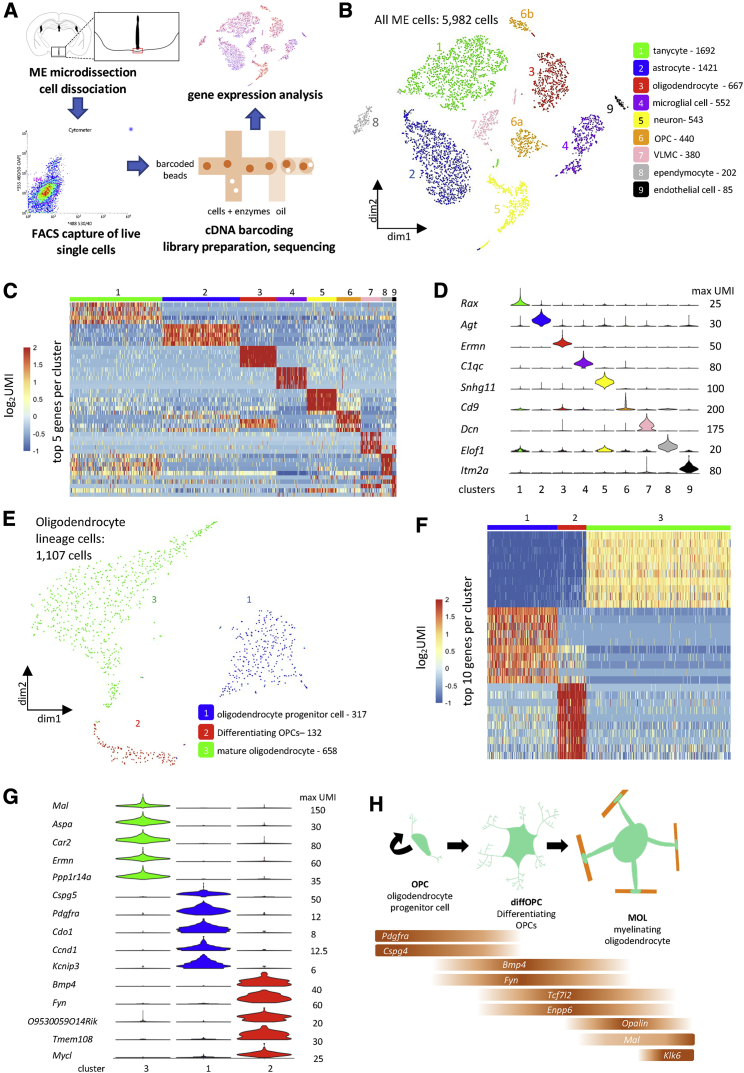
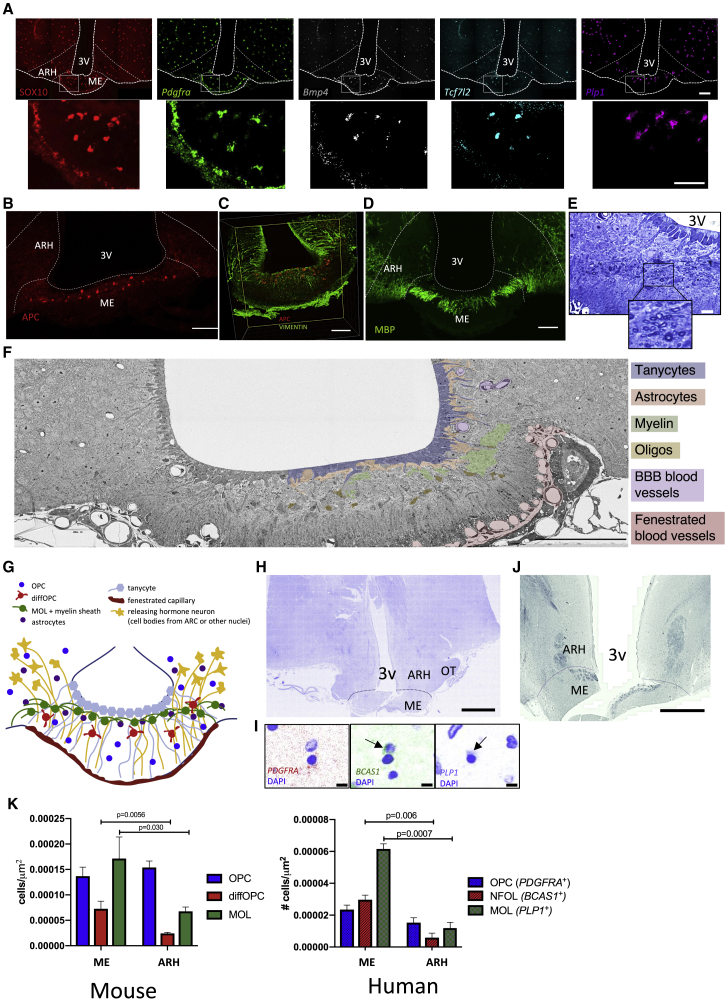
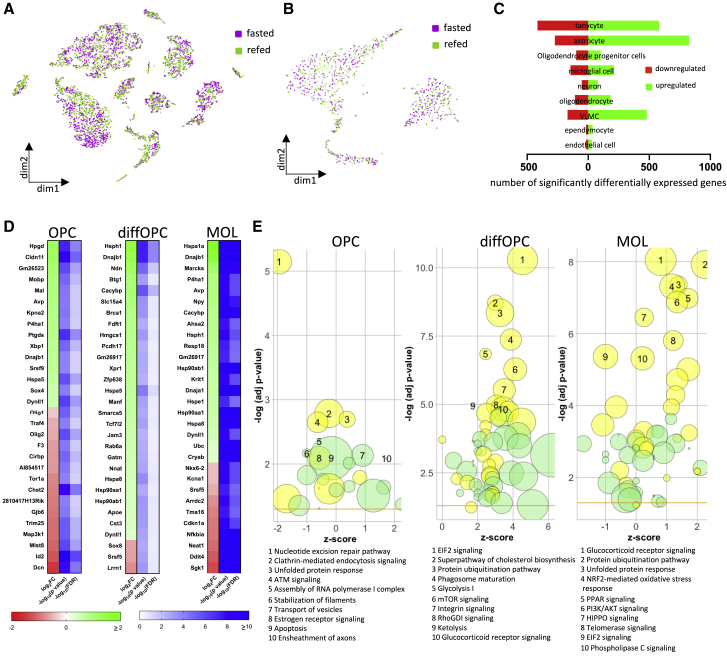
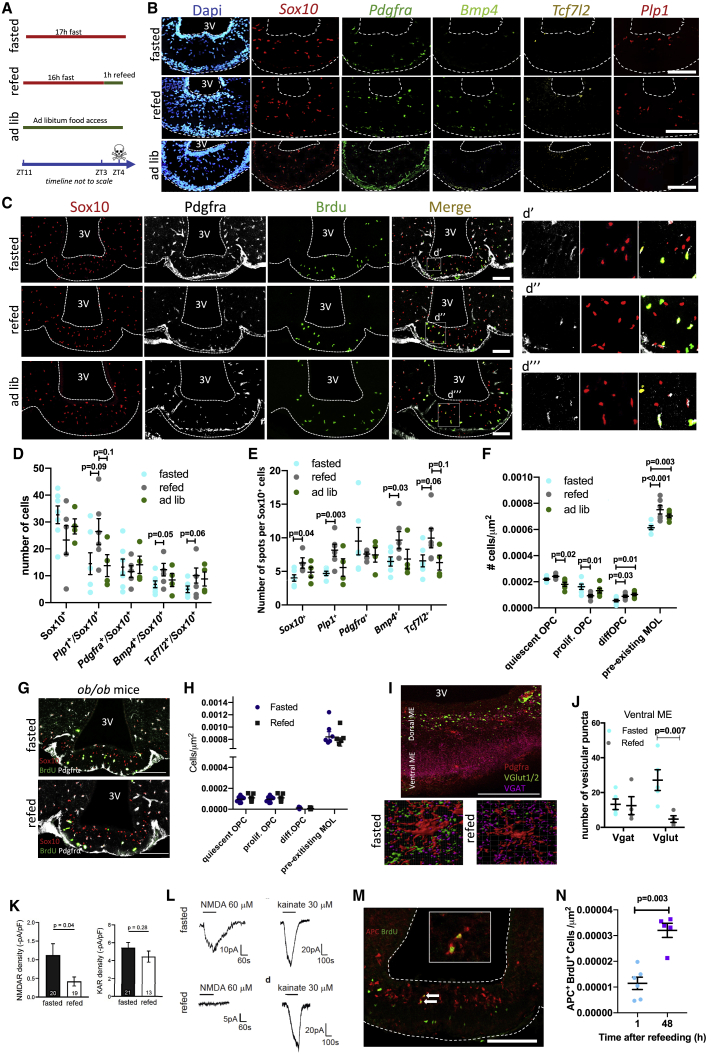
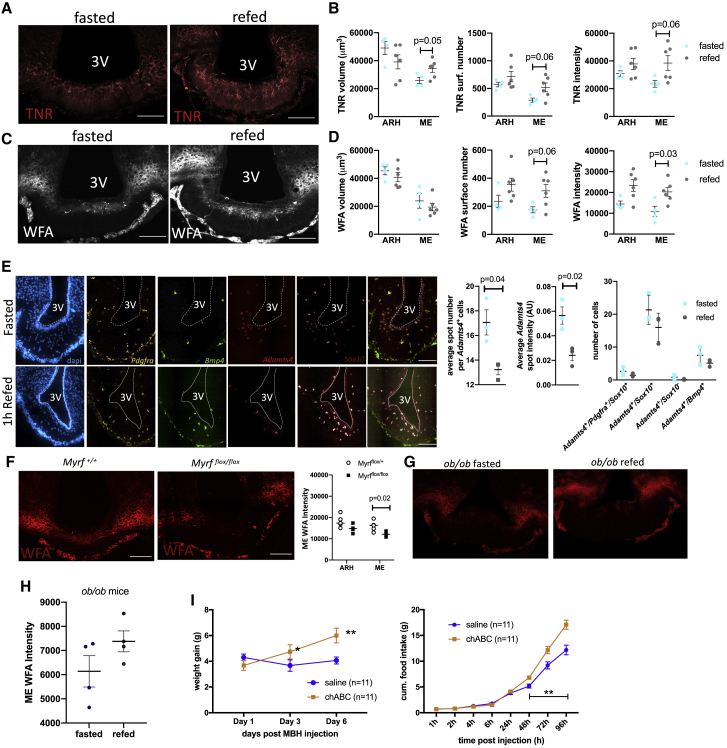
The mediobasal hypothalamus (MBH; arcuate nucleus of the hypothalamus [ARH] and median eminence [ME]) is a key nutrient sensing site for the production of the complex homeostatic feedback responses required for the maintenance of energy balance. Here, we show that refeeding after an overnight fast rapidly triggers proliferation and differentiation of oligodendrocyte progenitors, leading to the production of new oligodendrocytes in the ME specifically. During this nutritional paradigm, ME perineuronal nets (PNNs), emerging regulators of ARH metabolic functions, are rapidly remodeled, and this process requires myelin regulatory factor (Myrf) in oligodendrocyte progenitors. In genetically obese ob/ob mice, nutritional regulations of ME oligodendrocyte differentiation and PNN remodeling are blunted, and enzymatic digestion of local PNN increases food intake and weight gain. We conclude that MBH PNNs are required for the maintenance of energy balance in lean mice and are remodeled in the adult ME by the nutritional control of oligodendrocyte differentiation.

Keywords: energy balance; glucose homeostasis; hypothalamus; median eminence; nutrition; obesity; oligodendrocyte; perineuronal nets; plasticity.


Conflict of interest statement

Declaration of interests The authors declare no competing interests.

Figures

None
Graphical abstract
Figure 1
Figure 1
Single-cell transcriptomic analysis reveals 3 types of oligodendrocyte lineage cells in the ME (A) Workflow for single-cell RNA sequencing experiment. (B) tSNE plot demonstrating 9 groups of ME cells. OPCs, oligodendrocyte progenitor cells; VLMCs, vascular and leptomeningeal cells. (C) Heatmap of log2UMI (unique molecular identifier) counts per cell for the top 5 differentially expressed genes per cluster. (D) Violin plot showing UMI count distribution of one defining gene per cluster (variable scales per gene). (E) tSNE plot demonstrating 3 groups of oligodendrocyte lineage cells. (F) Heatmap of log2UMI counts per cell for the top 10 differentially expressed genes per cluster. (G) Violin plot showing UMI count distribution of the top 5 genes per cluster (variable scales per gene). (H) Schematic of oligodendrocyte differentiation and maturation and expression of validated substage markers in our oligodendrocyte lineage cells.
Figure 2
Figure 2
The diffOPC and MOL populations are concentrated in the dorsal part of the murine and human ME (A) FISH combined to immunohistochemistry for detection of oligodendrocyte lineage cells subtype marker gene expression in mouse brain. Scale bar, 100 μm. (B and C) APC expression in thin coronal sections (left; scale bar, 100 μm) (B) and APC and vimentin in thick cleared ME tissue (C). Scale bar, 100 μm. (D) MBP expression in thin coronal sections (left; scale bar, 100 μm) and in thick cleared ME tissue (right). (E) Toluidine-blue-labeled thin ME sections. 3V, third ventricle; scale bar, 10 μm; box indicates inset. Dark circles are transverse cross sections of myelin ensheathing an axon. (F) Block transmission electron micrograph of the ME. Scale bar, 100 μm. (G) Schematic of different cell types of the ME. (H) DAPI stain in human hypothalamus. OT, optic tract; scale bar, 3.75 mm. (I) PDGFRA, BCAS1, and PLP1 expression in the human hypothalamus. Arrows indicate probe labeling. n = 2 sections from 1 brain. (J) Luxol fast blue Nissl staining of a human hypothalamic section with ME. Scale bar, 2.5 mm. (K) Measurement of densities of OPCs, diffOPCs and MOLs in the mouse ME and ARH. Error bars depict mean ± SEM (ME, n = 6 animals; ARH, n = 9 animals). (H) Measurement of densities of OPCs (PDGFRA+), NFOLs (BCAS1+), and MOLs (PLP1+) in the human ME and ARH. (n = 1 human, 6 sections; scale bar, 10 μm)
Figure 3
Figure 3
Nutritional signals rapidly regulate the transcriptome of oligodendrocyte lineage cells in the adult ME (A and B) Cell sample treatment group (all ME cells, A; oligodendrocyte lineage cells, B) mapped on tSNE plots (n = 5 per condition). (C) Number of genes significantly different between fasted and refed conditions per cluster (p < 0.05; false discovery rate [FDR], <0.25). (D) Top 30 differentially expressed genes between fasted and refed conditions (p < 0.05; FDR, <0.25; −log10(0.05) = 1.3). (E) Graphical representation of top 10 pathways (IPA) changed between fasted and refed conditions. Radius indicates number of differentially expressed genes in current dataset that overlap with IPA gene set; yellow, IPA canonical signaling pathway; green, IPA cellular function; yellow horizontal line, denotes statistical significance threshold (−log(adj pvalue) of 1.3).
Figure 4
Figure 4
Nutritional signals rapidly regulate OPC proliferation and differentiation in the ME (A) Fast-refeed paradigm used in RNAscope studies. (B) Multiplex single-molecule FISH labeling oligodendrocyte lineage cell markers in the ME (scale bar, 100 μm). (C) BrdU labeling in fasted, refed, and ad-libitum-fed mice. Scale bar, 100 μm. (D and E) Number of cells expressing markers (D) and of RNA molecules (“spots”) per cell (averaged per imaged tiles of fixed area) (E) in RNAscope FISH experiment in me sections from fasted (n = 7), 1-h refed (n = 5), or ad-libitum-fed (n = 4) mice. (G) Quantification of subsets of BrdU-labeled cells in the ME. Quiescent OPC, Sox10+/Pdgfra+/BrdU; proliferating OPC, Sox10+/Pdgfra+/BrdU+; diffOPC, Sox10+/Pdgfra/BrdU+; preexisting MOL, Sox10+/Pdgfra/BrdU. (G) BrdU (green) labeling in the ME of fasted and refed ob/ob mice and colocalization with Sox10 and Pdgfra. Scale bar, 100 μm. (H) Quantification of subsets of BrdU-labeled cells in the ME of ob/ob mice. (I) Colocalization of Pdgfra with Vglut1/2 and Vgat in the ME. Single plane and Imaris 3D reconstruction of z stacks from fasted and refed mice (scale bar, 100 μm). (J) Quantification of vesicular puncta on OPCs in the ventral ME from fasted or refed mice. (K) Density of NMDA receptors (NMDARs) and AMPA/kainate receptors (KARs) in OPCs in fasted and refed mice. The numbers shown on bar graphs represent the number of whole-cell patched ME OPCs. (L) NMDA (60 μM)-evoked and kainate (30 μM)-evoked currents in ME OPCs from fasted or 1-h refed mice. (M) Colocalization of BrdU and APC in ME sections from refed mice 48 h after refeeding (scale bar, 100 μm). (N) Quantification of the density of APC+/BrdU+ cells in the ME 48 h post-refeeding. Data are means ± SEM.
Figure 5
Figure 5
Nutritional regulation of oligodendrocyte lineage progression in the ME regulates local perineuronal nets (A–D) Maximum projection stacks of 20 μM ME sections immunolabeled against TNR and WFA (A and B) and volumetric, surface number, and intensity quantification in these stacks (C and D). Scale bar: 100 μm. (E) Multiplex single-molecular FISH labeling of oligodendrocyte lineage cell markers and Adamts4 in the ME of fasted and refed mice. Scale bar, 100 μm. (G) WFA immunolabeling in the ME of mice with adult deletion of Myrf in OPCs (Myrfflox/flox) and controls (Myrf+/+). Scale bar, 100 μm. (G and H) WFA immunolabeling in the ME of ob/ob mice after an overnight fasted or an overnight fast followed by a 1-h refeed. (I) Weight gain and cumulative food intake in mice treated with a local MBH injection of chABC or vehicle (saline). Data are means ± SEM.
Figure 6
Figure 6
mTORC1 signaling is highly active and nutritionally regulated in the ME oligodendrocytes (A) Schematic of mTOR signaling pathway with DEGs labeled in blue. (B) Immunolabeling for phosphorylated mTOR (pmTOR) in the ME. Scale bar, 100 μm. (C) ME colocalization of pmTOR with Sox10, APC, NeuN, or Aldh1l1. Scale bars, 100 μm. (D) pmTOR labeling in ME tissue from oligodendrocyte-specific raptor KO or rictor KO. Scale bars, 100 μm. (E and G) pmTOR immunolabeling in the ME of mice fasted overnight or refed for 1 h. Scale bar, 100 μm. (G–I) pmTOR immunolabeling in the ME of mice fed a low or high protein diet. Scale bars, 25 μm. Data are mean ± SEM.

References

    1. Alonge K.M., Mirzadeh Z., Scarlett J.M., Logsdon A.F., Brown J.M., Cabrales E., Chan C.K., Kaiyala K.J., Bentsen M.A., Banks W.A. Hypothalamic perineuronal net assembly is required for sustained diabetes remission induced by fibroblast growth factor 1 in rats. Nat. Metab. 2020;2:1025–1033. - PMC - PubMed
    1. Avey D., Sankararaman S., Yim A.K.Y., Barve R., Milbrandt J., Mitra R.D. Single-Cell RNA-Seq Uncovers a Robust Transcriptional Response to Morphine by Glia. Cell Rep. 2018;24:3619–3629.e4. - PMC - PubMed
    1. Bayraktar O.A., Bartels T., Polioudakis D., Holmqvist S., Haim L.B., Young A.M.H., Prakash K., Brown A., Paredes M.F., Kawaguchi R. Single-cell in situ transcriptomic map of astrocyte cortical layer diversity. bioRxiv. 2018 doi: 10.1101/432104. - DOI
    1. Bibollet-Bahena O., Almazan G. IGF-1-stimulated protein synthesis in oligodendrocyte progenitors requires PI3K/mTOR/Akt and MEK/ERK pathways. J. Neurochem. 2009;109:1440–1451. - PubMed
    1. Bin J.M., Harris S.N., Kennedy T.E. The oligodendrocyte-specific antibody ‘CC1’ binds Quaking 7. J. Neurochem. 2016;139:181–186. - PubMed

Publication types

Substances