. 2021 Jul 20;36(3):109414.
doi: 10.1016/j.celrep.2021.109414. Epub 2021 Jun 29.

Distinctive features of SARS-CoV-2-specific T cells predict recovery from severe COVID-19

Affiliations

Distinctive features of SARS-CoV-2-specific T cells predict recovery from severe COVID-19

Jason Neidleman et al. Cell Rep. .

Abstract

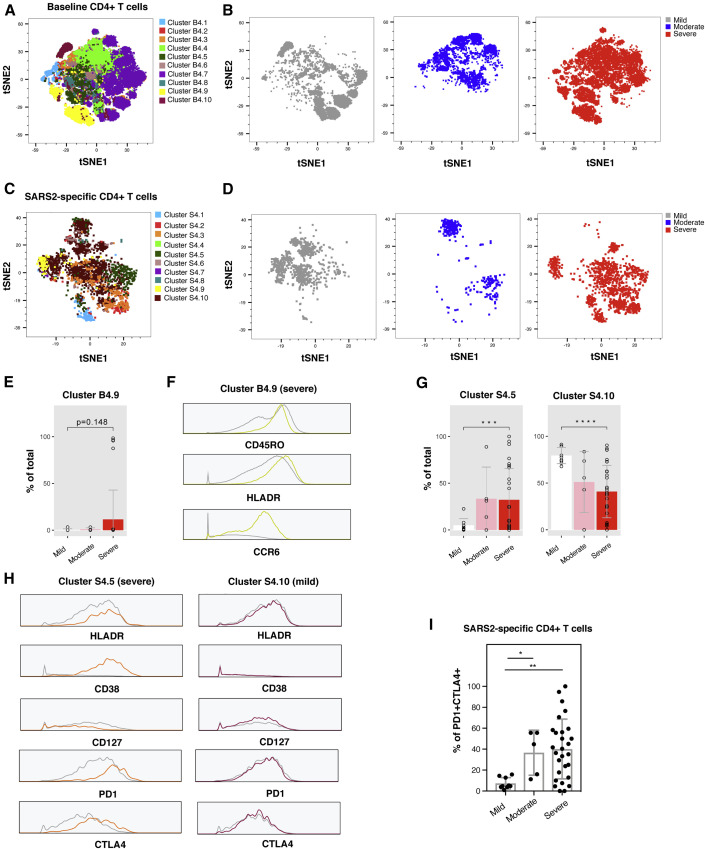
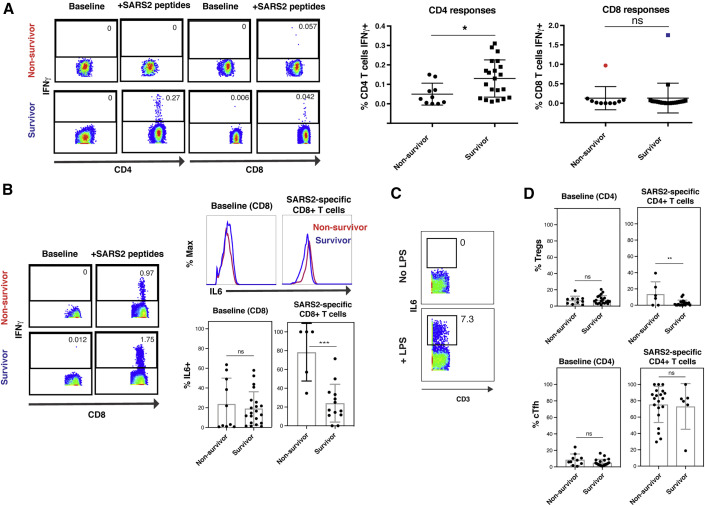
Although T cells are likely players in severe acute respiratory syndrome coronavirus 2 (SARS-CoV-2) immunity, little is known about the phenotypic features of SARS-CoV-2-specific T cells associated with recovery from severe coronavirus disease 2019 (COVID-19). We analyze T cells from 34 individuals with COVID-19 with severity ranging from mild (outpatient) to critical, culminating in death. Relative to individuals who succumbed, individuals who recovered from severe COVID-19 harbor elevated and increasing numbers of SARS-CoV-2-specific T cells capable of homeostatic proliferation. In contrast, fatal COVID-19 cases display elevated numbers of SARS-CoV-2-specific regulatory T cells and a time-dependent escalation in activated bystander CXCR4+ T cells, as assessed by longitudinal sampling. Together with the demonstration of increased proportions of inflammatory CXCR4+ T cells in the lungs of individuals with severe COVID-19, these results support a model where lung-homing T cells activated through bystander effects contribute to immunopathology, whereas a robust, non-suppressive SARS-CoV-2-specific T cell response limits pathogenesis and promotes recovery from severe COVID-19.

Keywords: CD127; COVID-19; CXCR4; SARS-CoV-2; T cells; lung.


Conflict of interest statement

Declaration of interests The authors declare no competing financial interests.

Figures

None
Graphical abstract
Figure 1
Figure 1
De novo IFNγ-producing SARS-CoV-2 spike-specific CD4+ and CD8+ T cells are elicited during mild, moderate, and severe COVID-19 (A) Pseudocolor plots of CyTOF datasets reflecting percentages of CD4+ or CD8+ T cells producing IFNγ at baseline or in response to 6-h stimulation with overlapping peptides from SARS-CoV-2 spike. Results are gated on live, singlet CD4+ or CD8+ T cells. (B) Percentages of CD4+ and CD8+ T cells producing IFNγ in response to spike peptide stimulation in all COVID-19 cases. ns, non-significant as determined by one-way analysis of variance with a Bonferroni post-test. Datapoints in red correspond to individuals with severe disease who did not survive COVID-19 and will be discussed further in subsequent figures. (C) The frequencies of SARS-CoV-2-specific T cells did not significantly correlate with time since initial SARS-CoV-2 PCR+ test. (D) The frequencies of SARS-CoV-2-specific CD4+ and CD8+ T cells did not significantly correlate with each other. The scatterplots in (C) and (D) show the correlation coefficients (R) and p values, which were calculated using t distribution with n-2 degrees of freedom, and the 95% confidence intervals of the regression lines, which are shaded in gray. (E) Evidence of T cell lymphopenia in specimens from moderate and severe COVID-19 relative to mild cases. The frequencies of total CD4+ and CD8+ T cells were determined in the baseline (non-stimulated) specimens. ∗∗p < 0.01 as determined by one-way analysis of variance with a Bonferroni post-test. (F) Proportion of IFNγ-producing cells among T cells from individuals in the ICU with or without SARS-CoV-2 infection. Even in the uninfected specimen with the highest response to spike stimulation (red dot), the proportion of IFNγ-producing cells was only 0.01% (inset), suggesting that the responses we detected in COVID-19 specimens corresponded to de novo SARS-CoV-2-specific T cells. ∗∗∗p < 0.001 as determined by a Student’s unpaired t test. Each datapoint corresponds to a different specimen (biological replicates). See also Figures S1 and S2.
Figure 2
Figure 2
Subset distribution of total and SARS-CoV-2-specific T cells during mild, moderate, and severe COVID-19 by manual gating (A and B) Distribution of baseline and SARS-CoV-2-specific CD4+ (A) and CD8+ (B) T cells from individuals with COVID-19 among memory (CD45RO+CD45RA) and a mixture of Tn, Temra, and Tscm (CD45ROCD45RA+) cells. Breakdown into further subsets was achieved by manually gating on subset marker combinations. Downstream of the CD45RO and CD45RA gates, we defined the subsets as follows: Tcm (CD27+CCR7+), Tem (CD27CCR7), Ttm (CD27+CCR7), Tn (CCR7+CD95), Temra (CCR7), Tscm (CCR7+CD95+). (C) Proportions of Treg (CD45RO+CD45RACD25+CD127low) and cTfh (PD1+CXCR5+) cells among baseline and SARS-CoV-2-specific CD4+ T cells from individuals with COVID-19. (D) The proportion of apoptosis-prone (PD1+CD95+) cells among CD4+ and CD8+ T cells is increased in severe COVID-19 cases for total and SARS-CoV-2-specific T cells. (E) The proportion of exhausted cells (PD1+TIGIT+) among total and SARS-CoV-2-specific CD8+ T is increased in severe COVID-19. p < 0.05, ∗∗p < 0.01, ∗∗∗p < 0.001, ∗∗∗∗p < 0.0001, as determined by one-way analysis of variance with a Bonferroni post-test. Each datapoint corresponds to a different specimen (biological replicates).
Figure 3
Figure 3
Clustering reveals enrichment in activated and exhausted SARS-CoV-2-specific CD4+ T cells during severe COVID-19 (A and C) FlowSOM clustering of total (baseline, A) and SARS-CoV-2-specific (C) CD4+ T cells from all infected groups, visualized as a t-SNE plot. Ten clusters were identified. Each cluster name begins with “B” (for baseline) or “S” (for SARS-CoV-2-specific), followed by “4” (for CD4). (B and D) Total (B) and SARS-CoV-2-specific (D) CD4+ T cells from mild (gray), moderate (blue), and severe (red) COVID-19 map to different areas of the t-SNE, indicating that they have different phenotypes. (A) and (B) share the same t-SNE space, and (C) and (D) share the same t-SNE space. (E) Proportion of total CD4+ T cells in the B4.9 cluster in the three groups. (F) High expression levels of the memory marker CD45RO, activation marker HLADR, and chemokine receptor CCR6 in cells from the B4.9 cluster (yellow trace) relative to total CD4+ T cells (gray trace). (G) Proportion of SARS-CoV-2-specific CD4+ T cells in the S4.5 and S4.10 clusters across the three groups. ∗∗∗p < 0.001 and ∗∗∗∗p < 0.0001 as determined by Student’s unpaired t test and adjusted for multiple testing using Bonferroni for false discovery rate (FDR). (H) Cluster S4.5 cells express elevated levels of the activation markers HLADR and CD38 and the exhaustion markers PD1 and CTLA4 but diminished levels of the IL-7 receptor alpha chain CD127 (orange traces) relative to all SARS-CoV-2-specific CD4+ T cells (gray traces); cluster S4.10 cells (maroon traces) do not. (I) Increased frequencies of exhausted (PD1+CTLA4+) cells among SARS-CoV-2-specific CD4+ T cells in severe COVID-19 samples, as validated by manual gating. p < 0.05 and ∗∗p < 0.01 as determined by one-way analysis of variance with a Bonferroni post-test. Datapoints from graphs with significance tests correspond to individual specimens (biological replicates).
Figure 4
Figure 4
Clustering reveals enrichment of activated, exhausted SARS-CoV-2-specific CD8+ T cells during severe COVID-19 (A and C) FlowSOM clustering of total (baseline, A) and SARS-CoV-2-specific (C) CD8+ T cells from all infected groups, visualized as t-SNE plots. Ten clusters were identified. Each cluster name begins with “B” (for baseline) or “S” (for SARS-CoV-2-specific), followed by “8” (for CD8). (B and D) Total (B) and SARS-CoV-2-specific (D) CD8+ T cells from mild (gray), moderate (blue), and severe (red) COVID-19 map to different areas of the t-SNE, indicating that they have different phenotypes. (E) Clusters B8.5, B8.6, B8.7, and B8.8 of total CD8+ T cells are significantly enriched in the severe group, whereas there is a trend for cluster B8.1 enrichment in the mild group. p < 0.05, ∗∗p < 0.01, and ∗∗∗∗p < 0.0001 as determined by Student’s unpaired t test and adjusted for multiple testing using Bonferroni for FDR. (F) Cells from the B8.5, B8.6, B8.7, and B8.8 (severe-enriched) clusters express high levels of the activation marker HLADR (colored traces) relative to total CD8+ T cells (gray trace), whereas the activation marker CD38 is elevated in only a subset of these clusters (colored traces) relative to total CD8+ T cells (gray trace). Cells from the B8.1 (mild-enriched) cluster express low levels of both activation markers. (G) Cluster S8.4 is enriched in the severe and moderate groups relative to the mild group. ∗∗p < 0.01 as determined by Student’s unpaired t test and adjusted for multiple testing using Bonferroni for FDR. (H) Cluster S8.4 cells express elevated levels of the activation markers HLADR and CD38 and the exhaustion markers PD1 and CTLA4 but diminished levels of the IL-7 receptor alpha chain CD127 (green traces) relative to all SARS-CoV-2-specific CD8+ T cells (gray traces). (I) Increased frequencies of exhausted (PD1+CTLA4+) cells among SARS-CoV-2-specific CD8+ T cells in severe relative to mild COVID-19, validated by manual gating. p < 0.05 as determined by one-way analysis of variance with a Bonferroni post-test. Datapoints from graphs with significance tests correspond to individual specimens (biological replicates).
Figure 5
Figure 5
Distinct features of SARS-CoV-2-specific T cells are associated with recovery from severe COVID-19 (A) Higher frequencies of SARS-CoV-2-specific T cells in individuals with severe COVID-19 who survived (“survivor”) than in those who did not (“non-survivor”). Left: pseudocolor plots reflecting the percentages of SARS-CoV-2-specific T cells from representative infected individuals in the ICU who did or did not survive COVID-19. Right: quantification of the data across all infected ICU individuals. p < 0.05, ns as determined by a Student’s unpaired t test. (B) SARS-CoV-2-specific CD8+ T cells from non-survivors produce elevated levels of IL-6. Left: pseudocolor plots of baseline and spike-stimulated samples from the two individuals harboring the highest levels of SARS-CoV-2-specific CD8+ T cells in (A), only one of whom survived. Top right: histograms showing expression levels of IL-6 in non-survivor and survivor CD8+ T cells. Bottom right: proportion of IL-6-producing cells among total and SARS-CoV-2-specific T cells in all non-survivors and survivors. (C) Positive control for IL-6 detection. Peripheral blood monocytes (CD3CD4dim cells) were stimulated with LPS and analyzed by CyTOF. (D) SARS-CoV-2-specific Treg cells, but not cTfh cells, are significantly more abundant in non-survivors of severe COVID-19. Datapoints from graphs with significance tests correspond to individual specimens (biological replicates). See also Figures S3–S5.
Figure 6
Figure 6
Clustering reveals enrichment of long-lived, activated SARS-CoV-2-specific CD4+ T cells in individuals who successfully recover from severe COVID-19 (A and B) The phenotypes of total (A) and SARS-CoV-2-specific (B) CD4+ T cells differ between non-survivors and survivors of severe COVID-19. Left: t-SNE plot and FlowSOM clusters identified in Figures 3A (A) and 3C (B). Right: distribution of CD4+ T cells from non-survivors (pink), survivors (purple), and mild and moderate groups (gray). (C) Activated memory CD4+ T cells are elevated in survivors of severe COVID-19. Left: clusters B4.1 and B4.9 are enriched in the survivor relative to the non-survivor group. p < 0.05 as determined by a Student’s unpaired t test. Right: cells from clusters B4.1 and B4.9 are memory (CD45RO+) cells and express elevated levels of the activation marker HLADR. Other activation markers (CD38, CD69, and CCR5) are preferentially elevated only in cluster B4.1. Expression levels are displayed in gray for total CD4+ T cells and in color for clusters. (D) Survivors tend to harbor more activated (HLADR+CCR5+) CD4+ T cells. (E) Left: cluster S4.5 is enriched in non-survivors and cluster S4.9 in survivors. Right: cells from cluster S4.5 co-express the exhaustion markers PD1 and CTLA4, whereas cells from cluster S4.9 express high levels of the cTfh marker CXCR5, low levels of the exhaustion markers PD1 and CTLA4, high levels of IL-7 receptor alpha chain CD127, and high levels of the activation marker CD69. Expression levels from each cluster (colored traces) are shown against expression levels from all SARS-CoV-2-specific CD4+ T cell clusters combined (gray traces). p < 0.05 as determined by a Student’s unpaired t test. (F and G) SARS-CoV-2-specific CD4+ T cells expressing CD127 (F) or co-expressing CD127 with CD69 (G) are more abundant in survivors than in non-survivors. p < 0.05, ∗∗p < 0.01, as determined by a Student’s unpaired t test. Datapoints from graphs with significance tests correspond to individual specimens (biological replicates). See also Figures S6 and S7.
Figure 7
Figure 7
Escalating numbers of SARS-CoV-2-specific and diminishing numbers of lung-homing bystander CXCR4+ T cells correlate with survival of severe COVID-19 (A and B) Longitudinal analysis of an individual who survived (A) and did not survive (B) severe COVID-19, demonstrating an increasing number of SARS-CoV-2 T cells producing IFNγ over time in the survivor but not in the non-survivor. (C) Activated CXCR4-expressing T cells decrease over time in survivors but not in the non-survivors. Left: pseudocolor plots showing gating for CD69+CXCR4+ and CD69CXCR4 cells among total CD4+ and CD8+ T cells in longitudinal specimens from a representative survivor of severe COVID-19. Right: longitudinal analyses of 7 cases of severe COVID-19, 4 of which survived infection. Although the frequencies of CXCR4CD69 T cells increase over time in survivors (blue lines), they decrease over time in non-survivors (red lines). (D–I) Higher levels of infiltrating CXCR4+CD69+ T cells are present in lungs of individuals with severe/critical versus moderate COVID-19, as determined by mining of public BAL scRNA-seq datasets. Higher levels of SARS-CoV-2 viral reads in T and epithelial cells were detected during severe COVID-19 (D), which were also associated with higher levels of CXCR4 in T cells, as depicted by violin plots (E). Viral reads detected in T cells likely reflect cell surface virion sticking because these cells do not express ACE2. UMAP visualization of T and epithelial cells from the scRNA-seq datasets (F) revealed elevated expression of CXCR4 and CD69 on subsets of T cells (G) separate from T cells expressing high levels of the Trm marker CD103 (H). The CXCR4 ligand HMGB1 was expressed in T and epithelial cells but especially concentrated among a subset of CXCR4CD69 Trm CD8+ T cells outlined in purple (I). See also Figure S8.

Update of

References

    1. Anft M., Paniskaki K., Blazquez-Navarro A., Doevelaar A., Seibert F.S., Hoelzer B., Skrzypczyk S., Kohut E., Kurek J., Zapka J. COVID-19 progression is potentially driven by T cell immunopathogenesis. medRxiv. 2020 doi: 10.1101/2020.04.28.20083089. - DOI
    1. Bastard P., Rosen L.B., Zhang Q., Michailidis E., Hoffmann H.H., Zhang Y., Dorgham K., Philippot Q., Rosain J., Béziat V., HGID Lab. NIAID-USUHS Immune Response to COVID Group. COVID Clinicians. COVID-STORM Clinicians. Imagine COVID Group. French COVID Cohort Study Group. Milieu Intérieur Consortium. CoV-Contact Cohort. Amsterdam UMC Covid-19 Biobank. COVID Human Genetic Effort Autoantibodies against type I IFNs in patients with life-threatening COVID-19. Science. 2020;370:eabd4585. - PMC - PubMed
    1. Braun J., Loyal L., Frentsch M., Wendisch D., Georg P., Kurth F., Hippenstiel S., Dingeldey M., Kruse B., Fauchere F. SARS-CoV-2-reactive T cells in healthy donors and patients with COVID-19. Nature. 2020;587:270–274. - PubMed
    1. Cashen A.F., Nervi B., DiPersio J. AMD3100: CXCR4 antagonist and rapid stem cell-mobilizing agent. Future Oncol. 2007;3:19–27. - PubMed
    1. Cavrois M., Banerjee T., Mukherjee G., Raman N., Hussien R., Rodriguez B.A., Vasquez J., Spitzer M.H., Lazarus N.H., Jones J.J. Mass Cytometric Analysis of HIV Entry, Replication, and Remodeling in Tissue CD4+ T Cells. Cell Rep. 2017;20:984–998. - PMC - PubMed