. 2021 Sep;597(7874):97-102.
doi: 10.1038/s41586-021-03807-6. Epub 2021 Jul 14.

SARS-CoV-2 RBD antibodies that maximize breadth and resistance to escape

Affiliations

SARS-CoV-2 RBD antibodies that maximize breadth and resistance to escape

Tyler N Starr et al. Nature. 2021 Sep.

Abstract

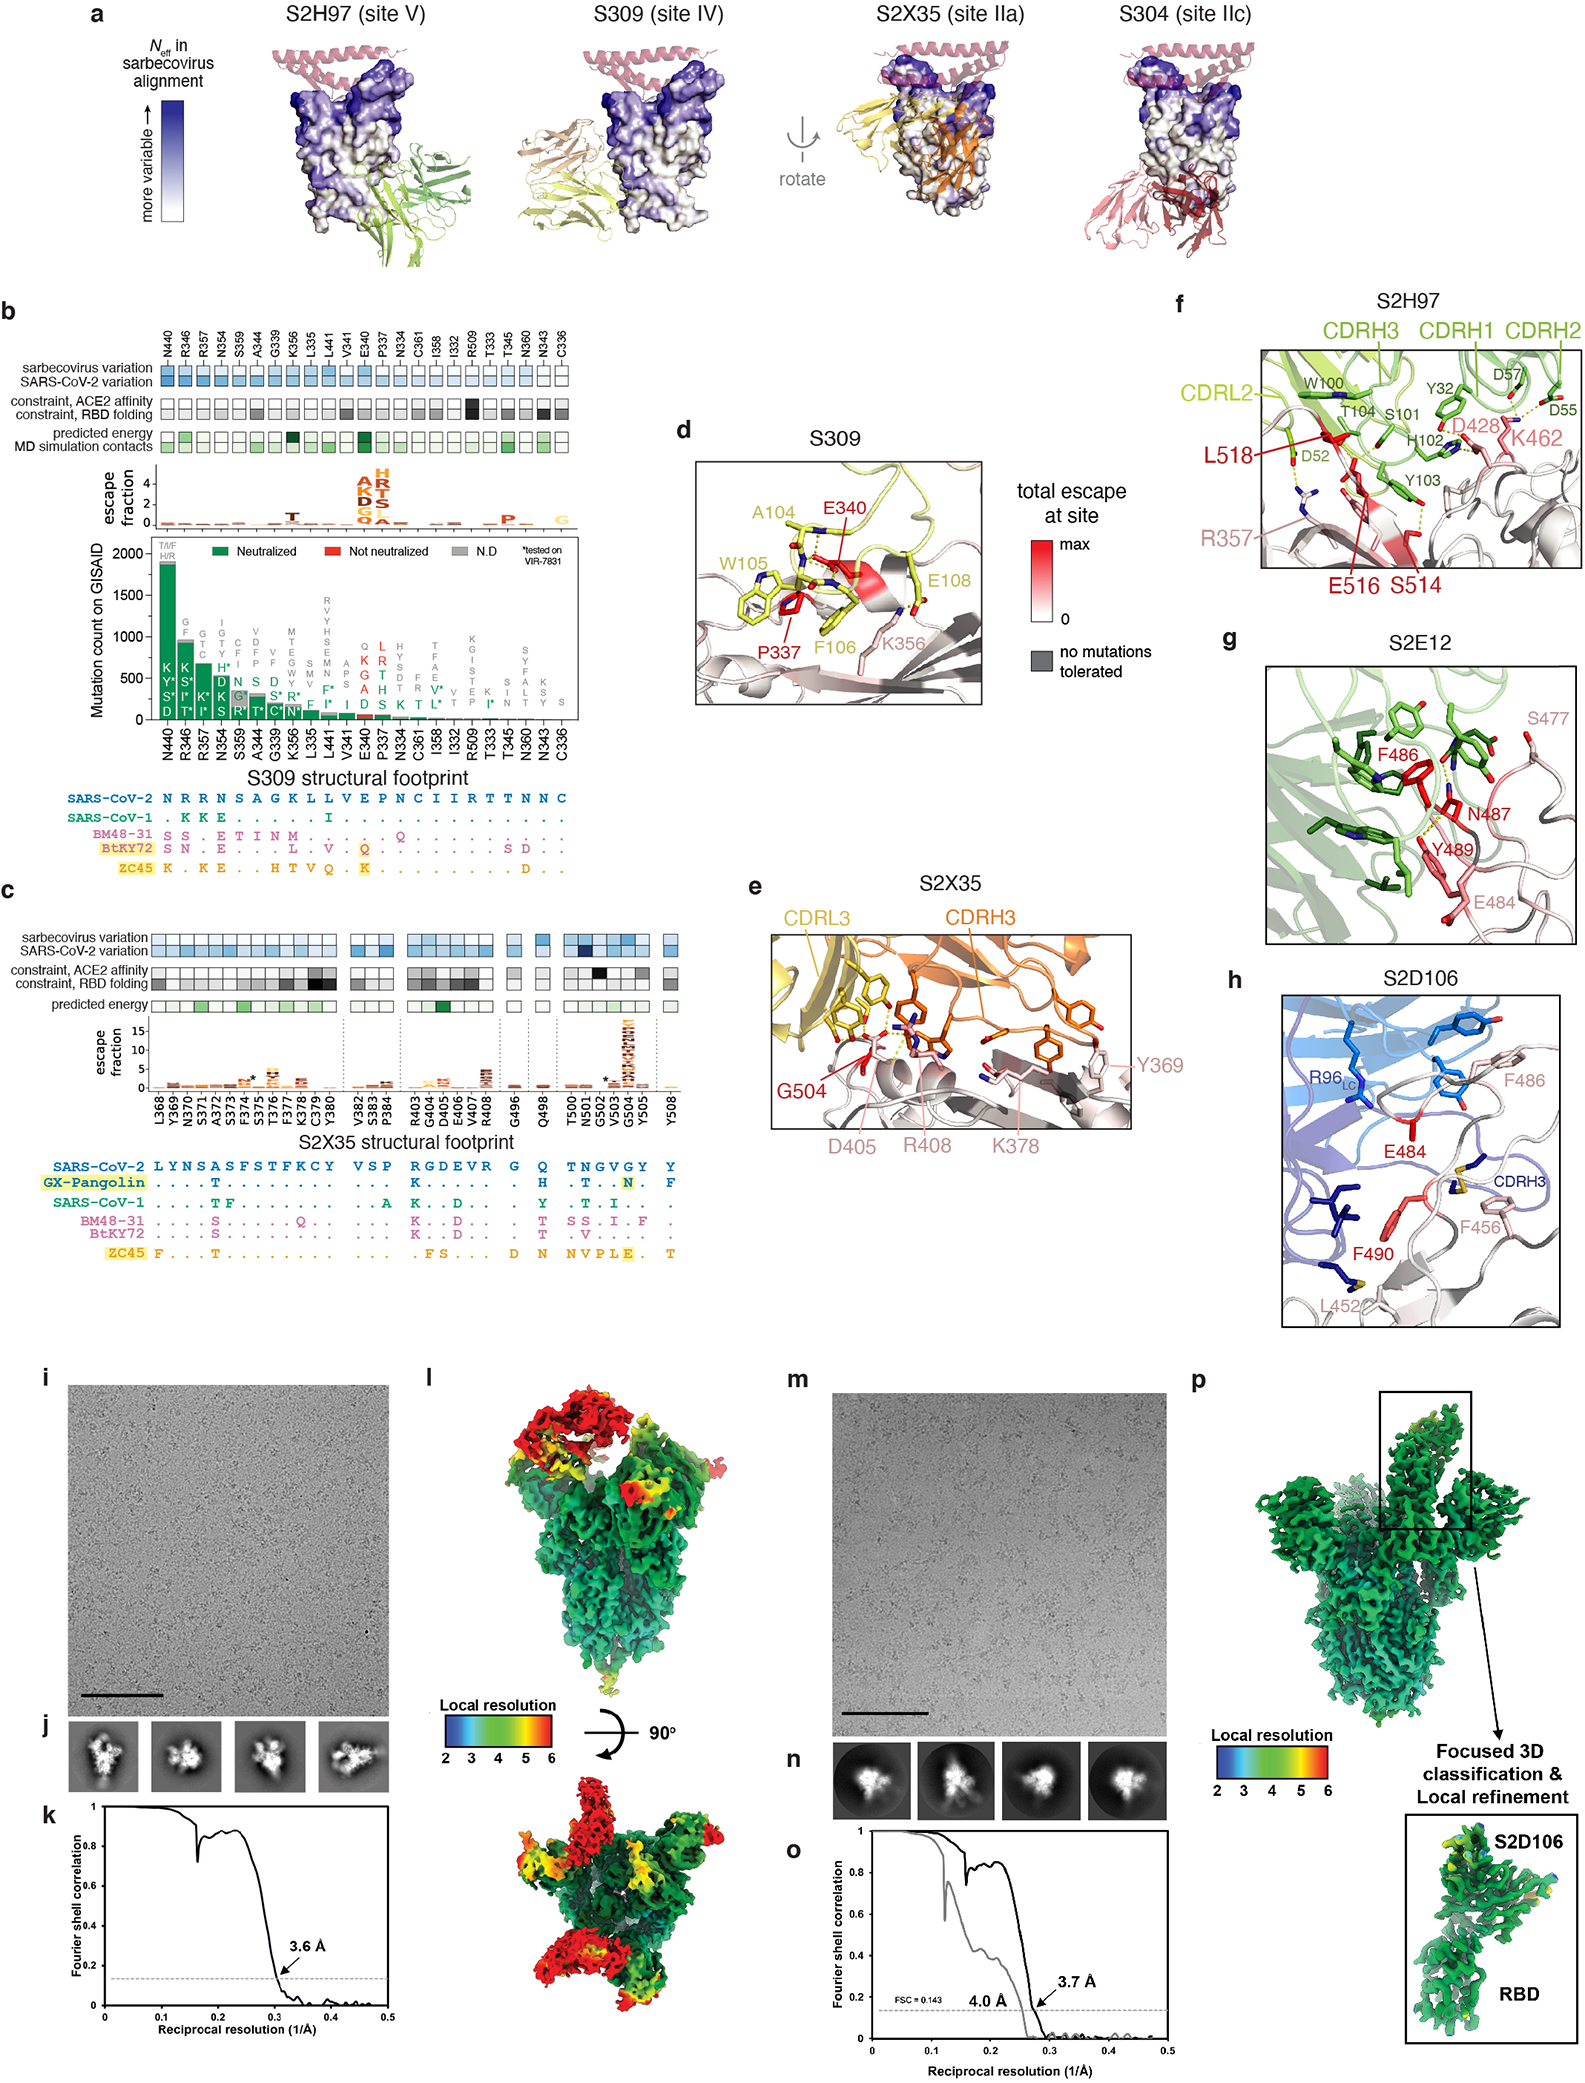
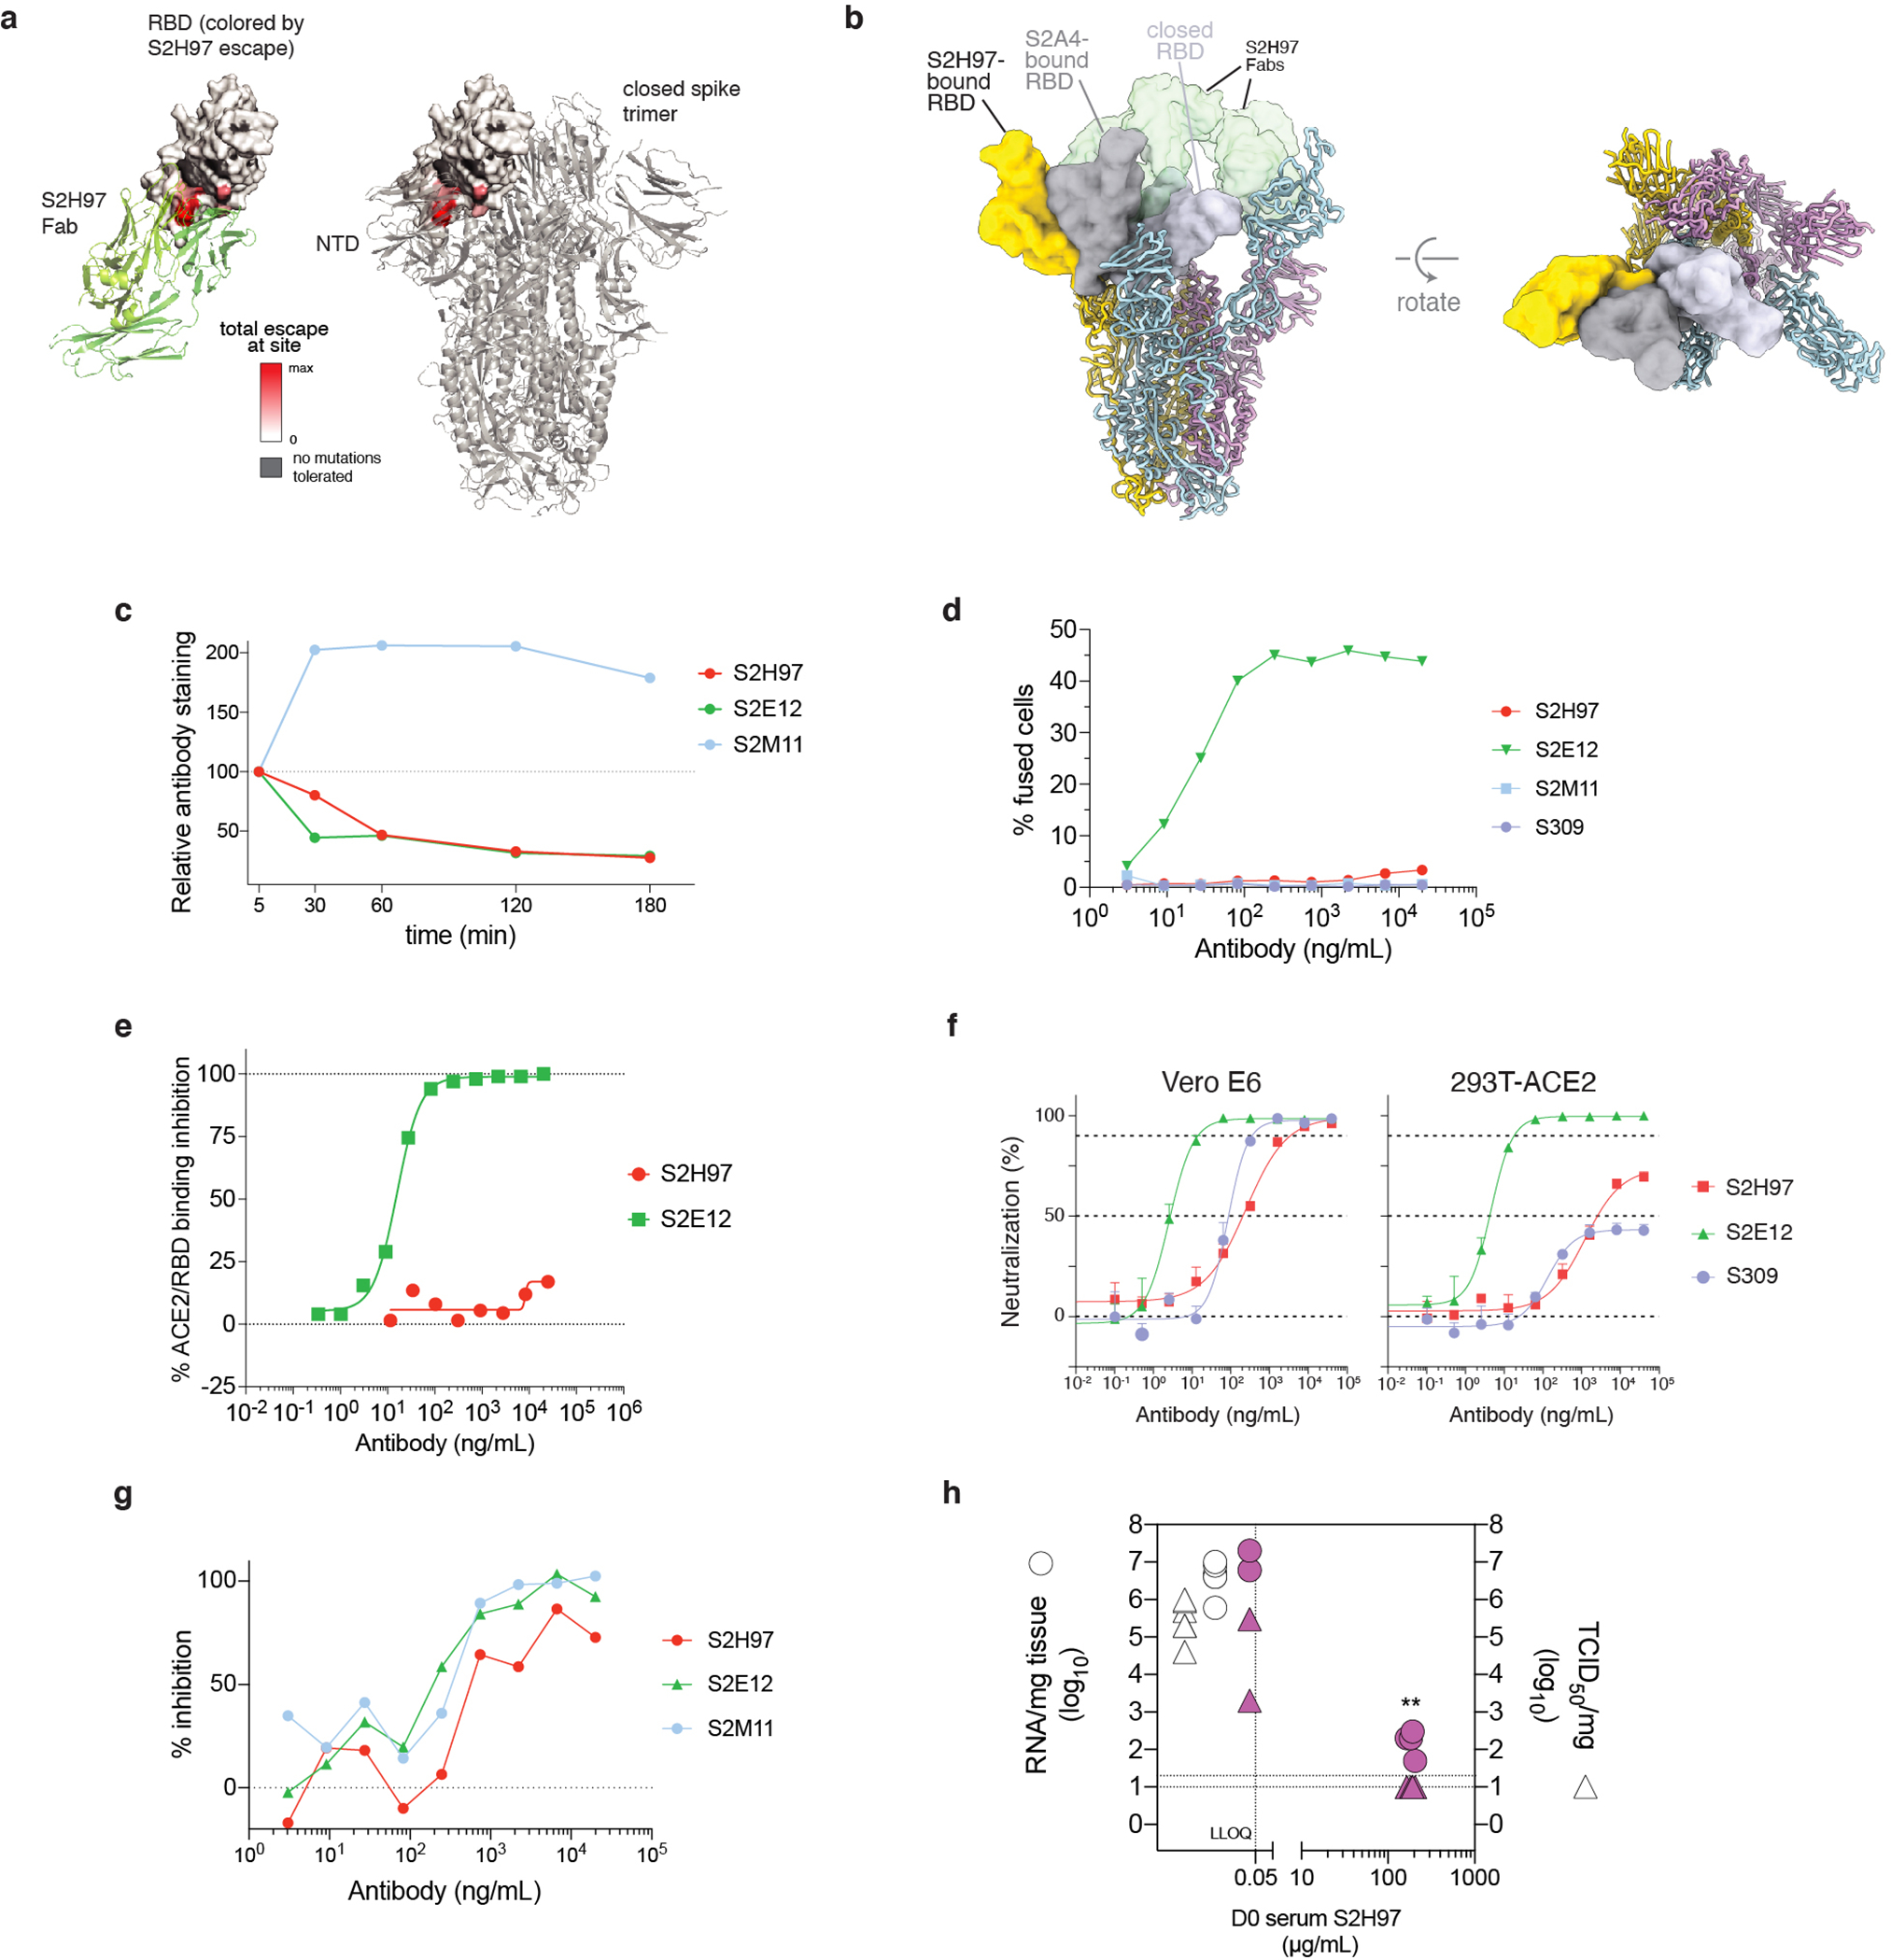
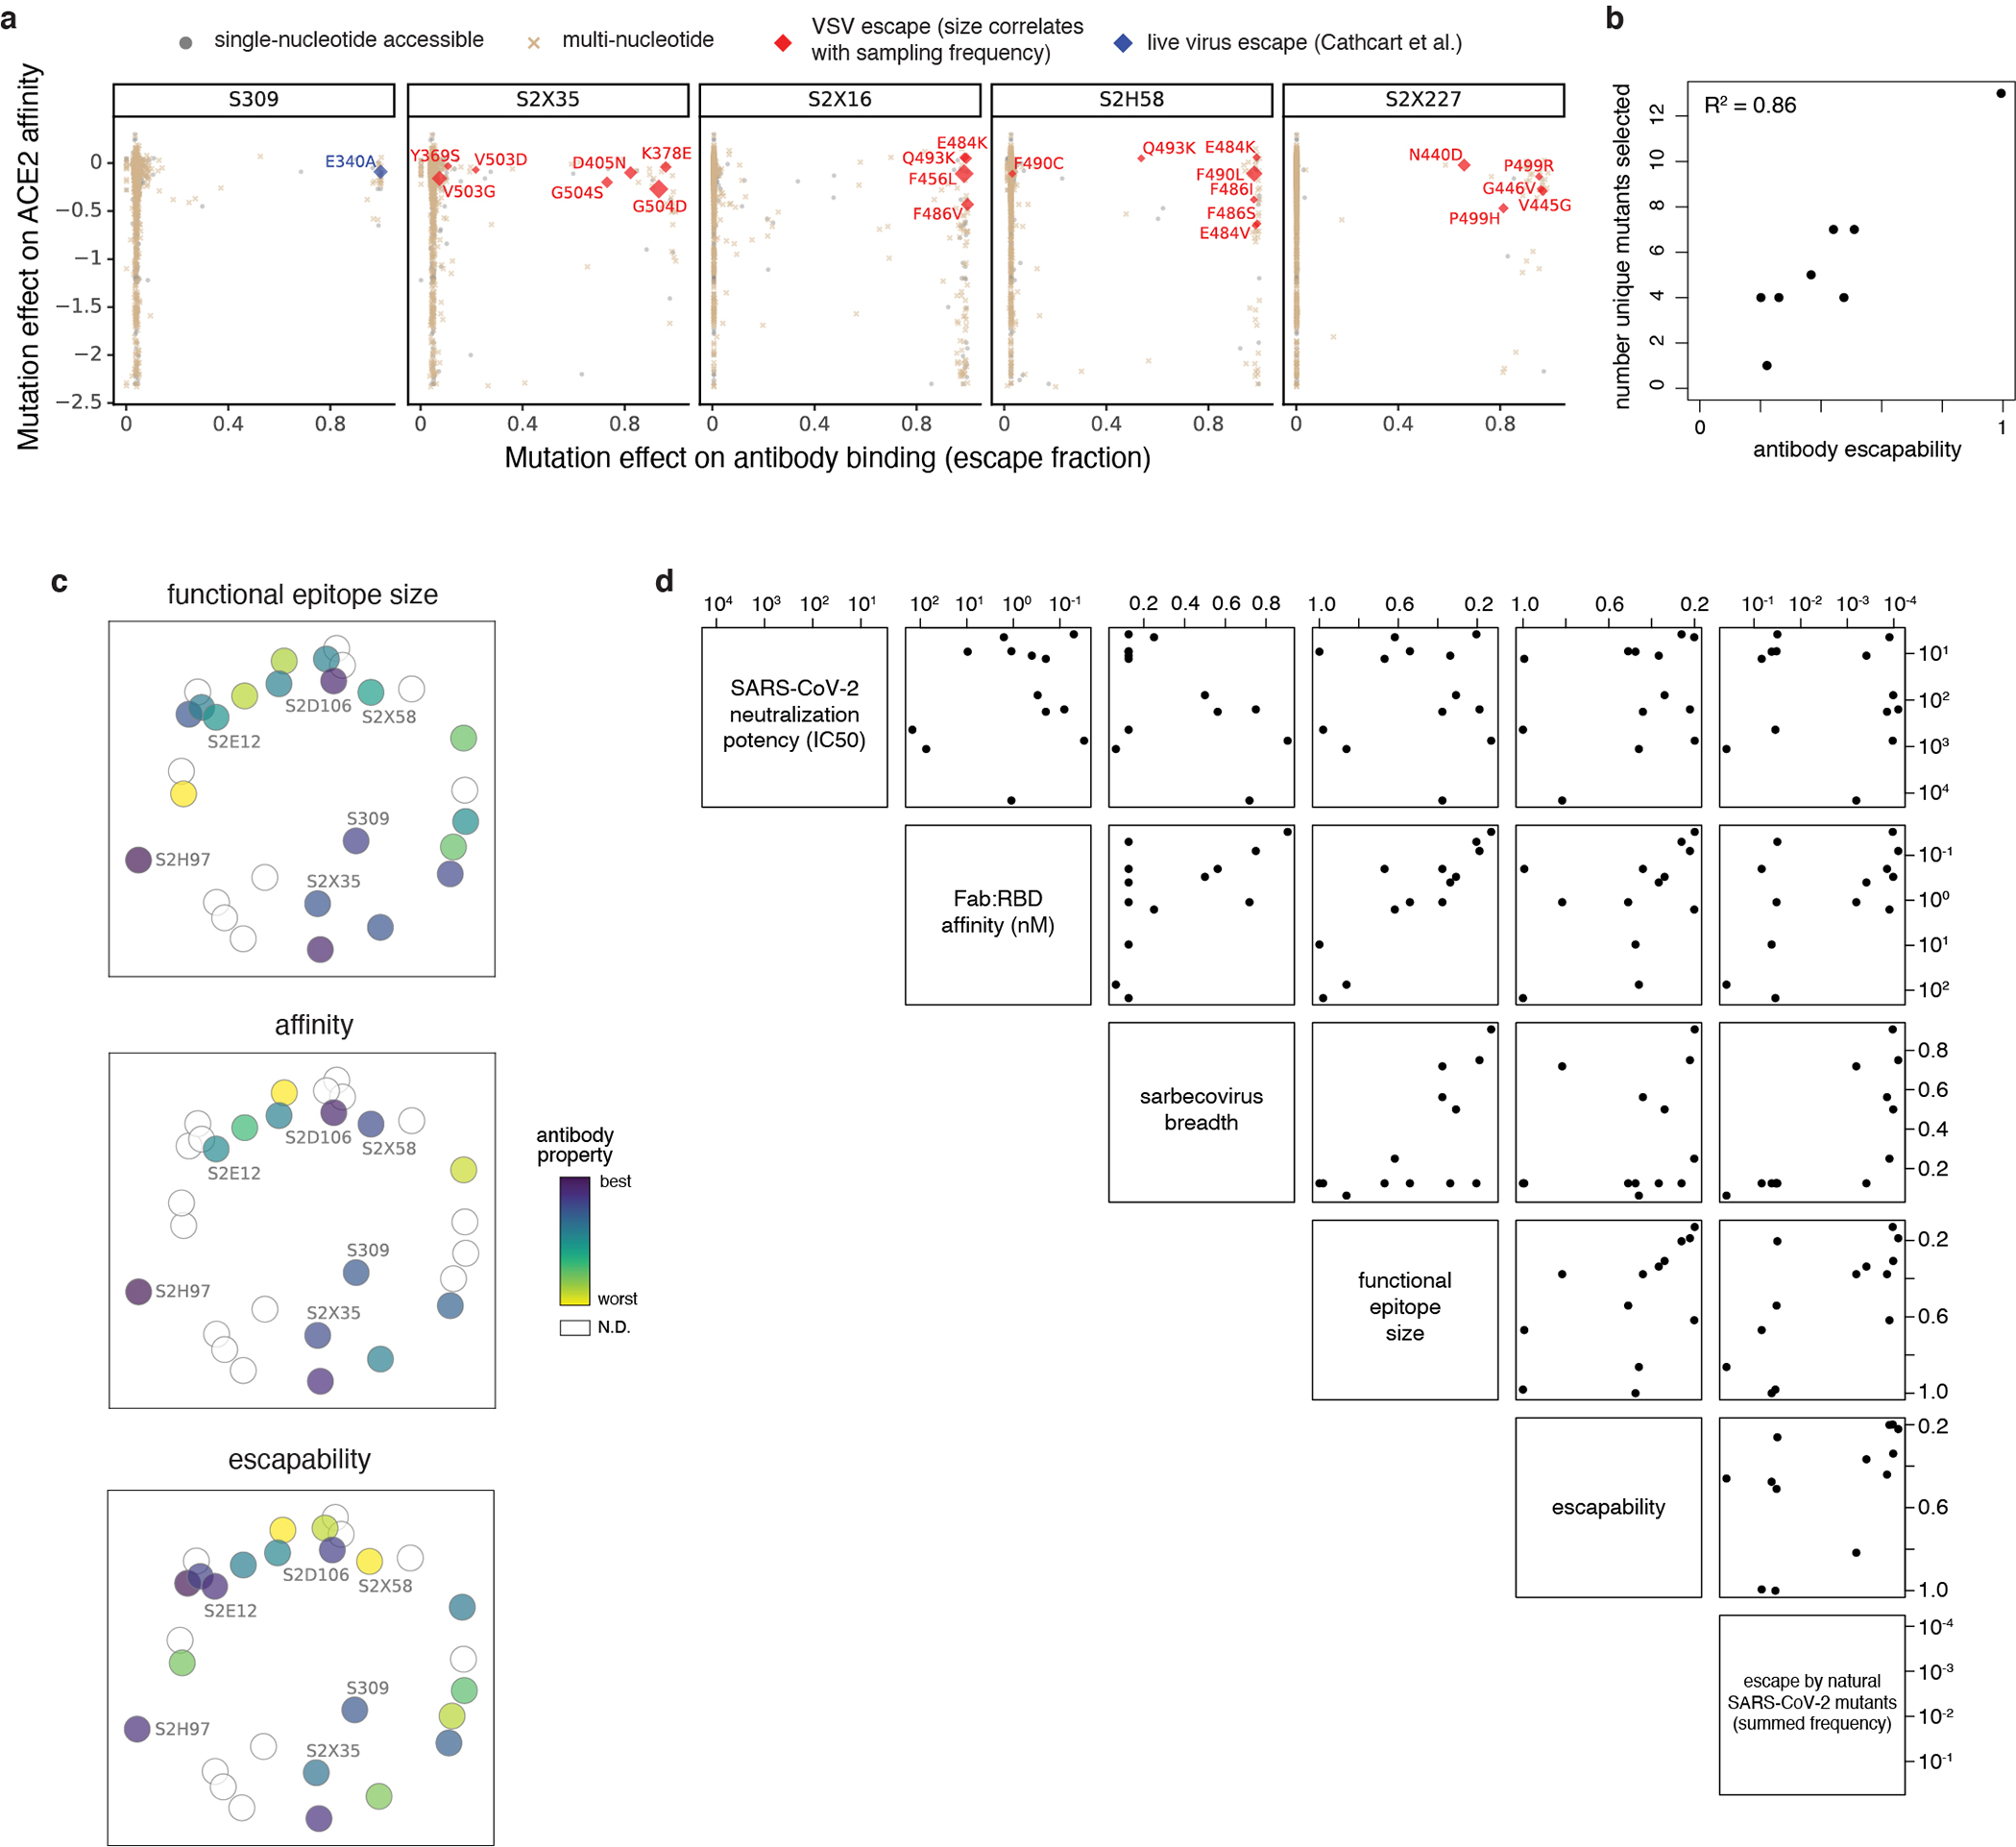
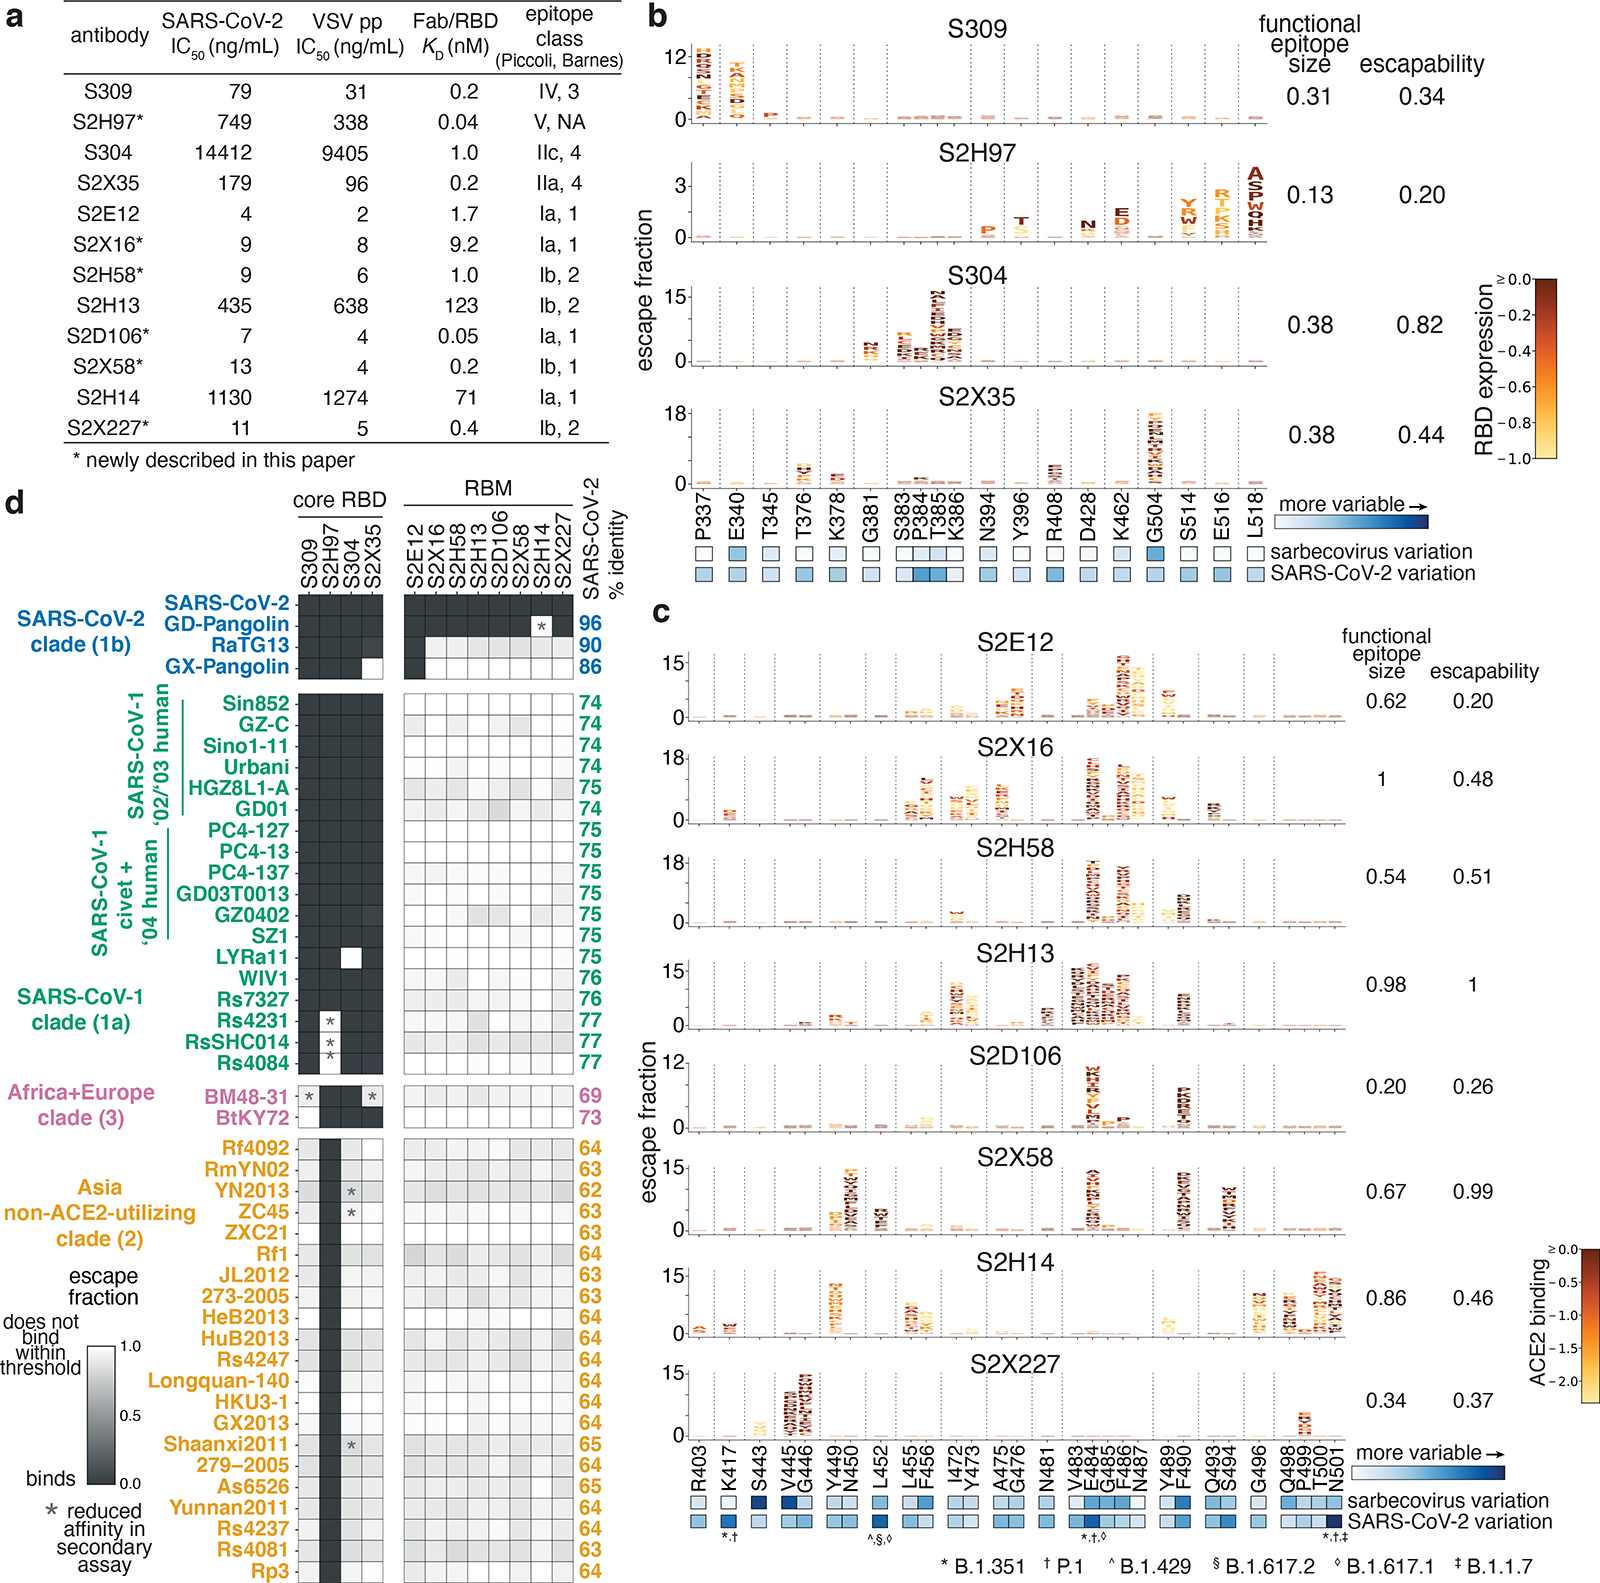
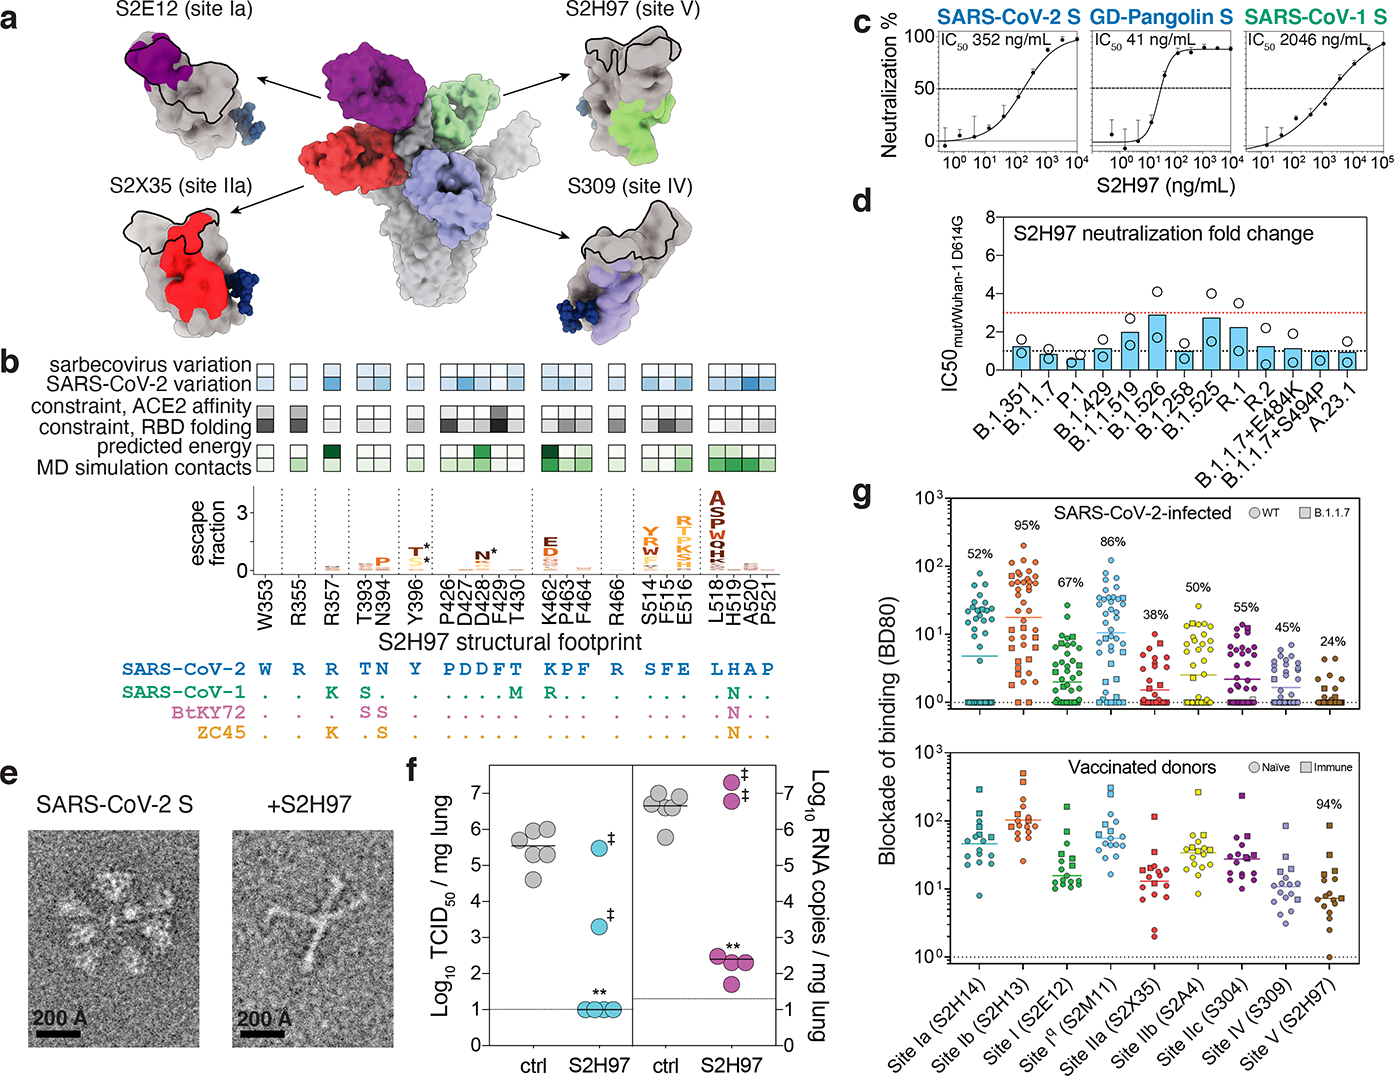
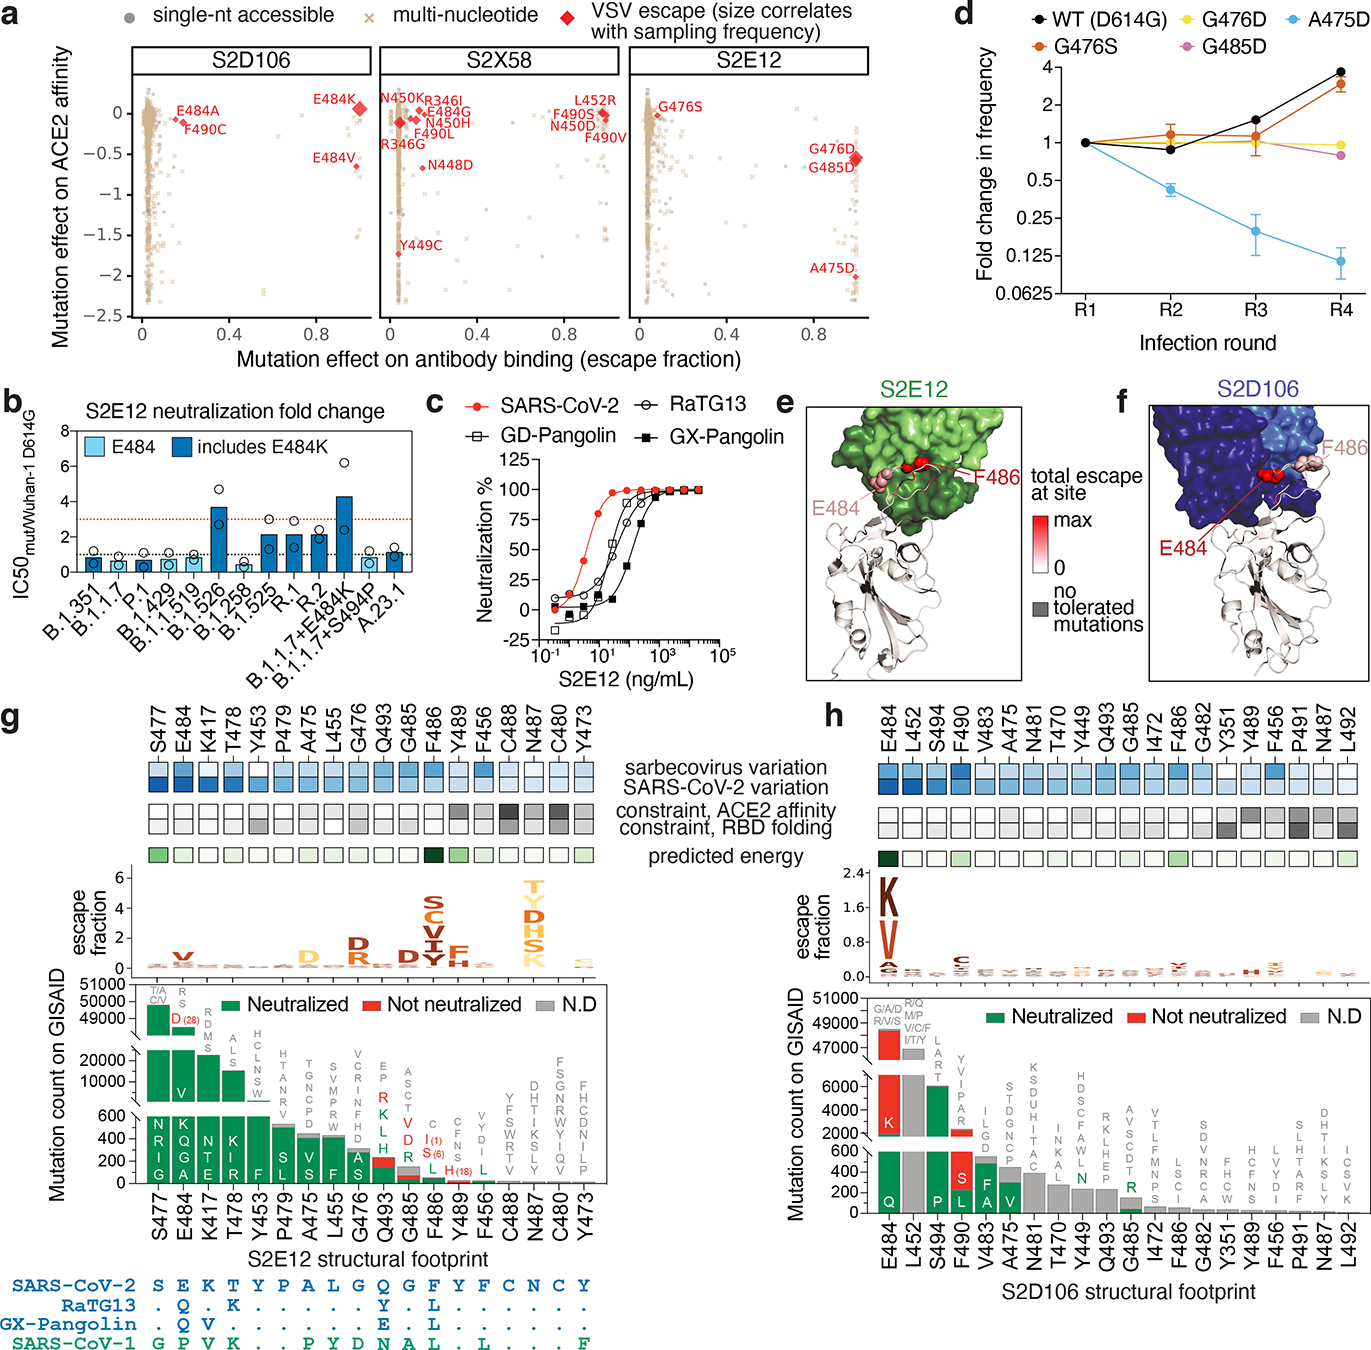
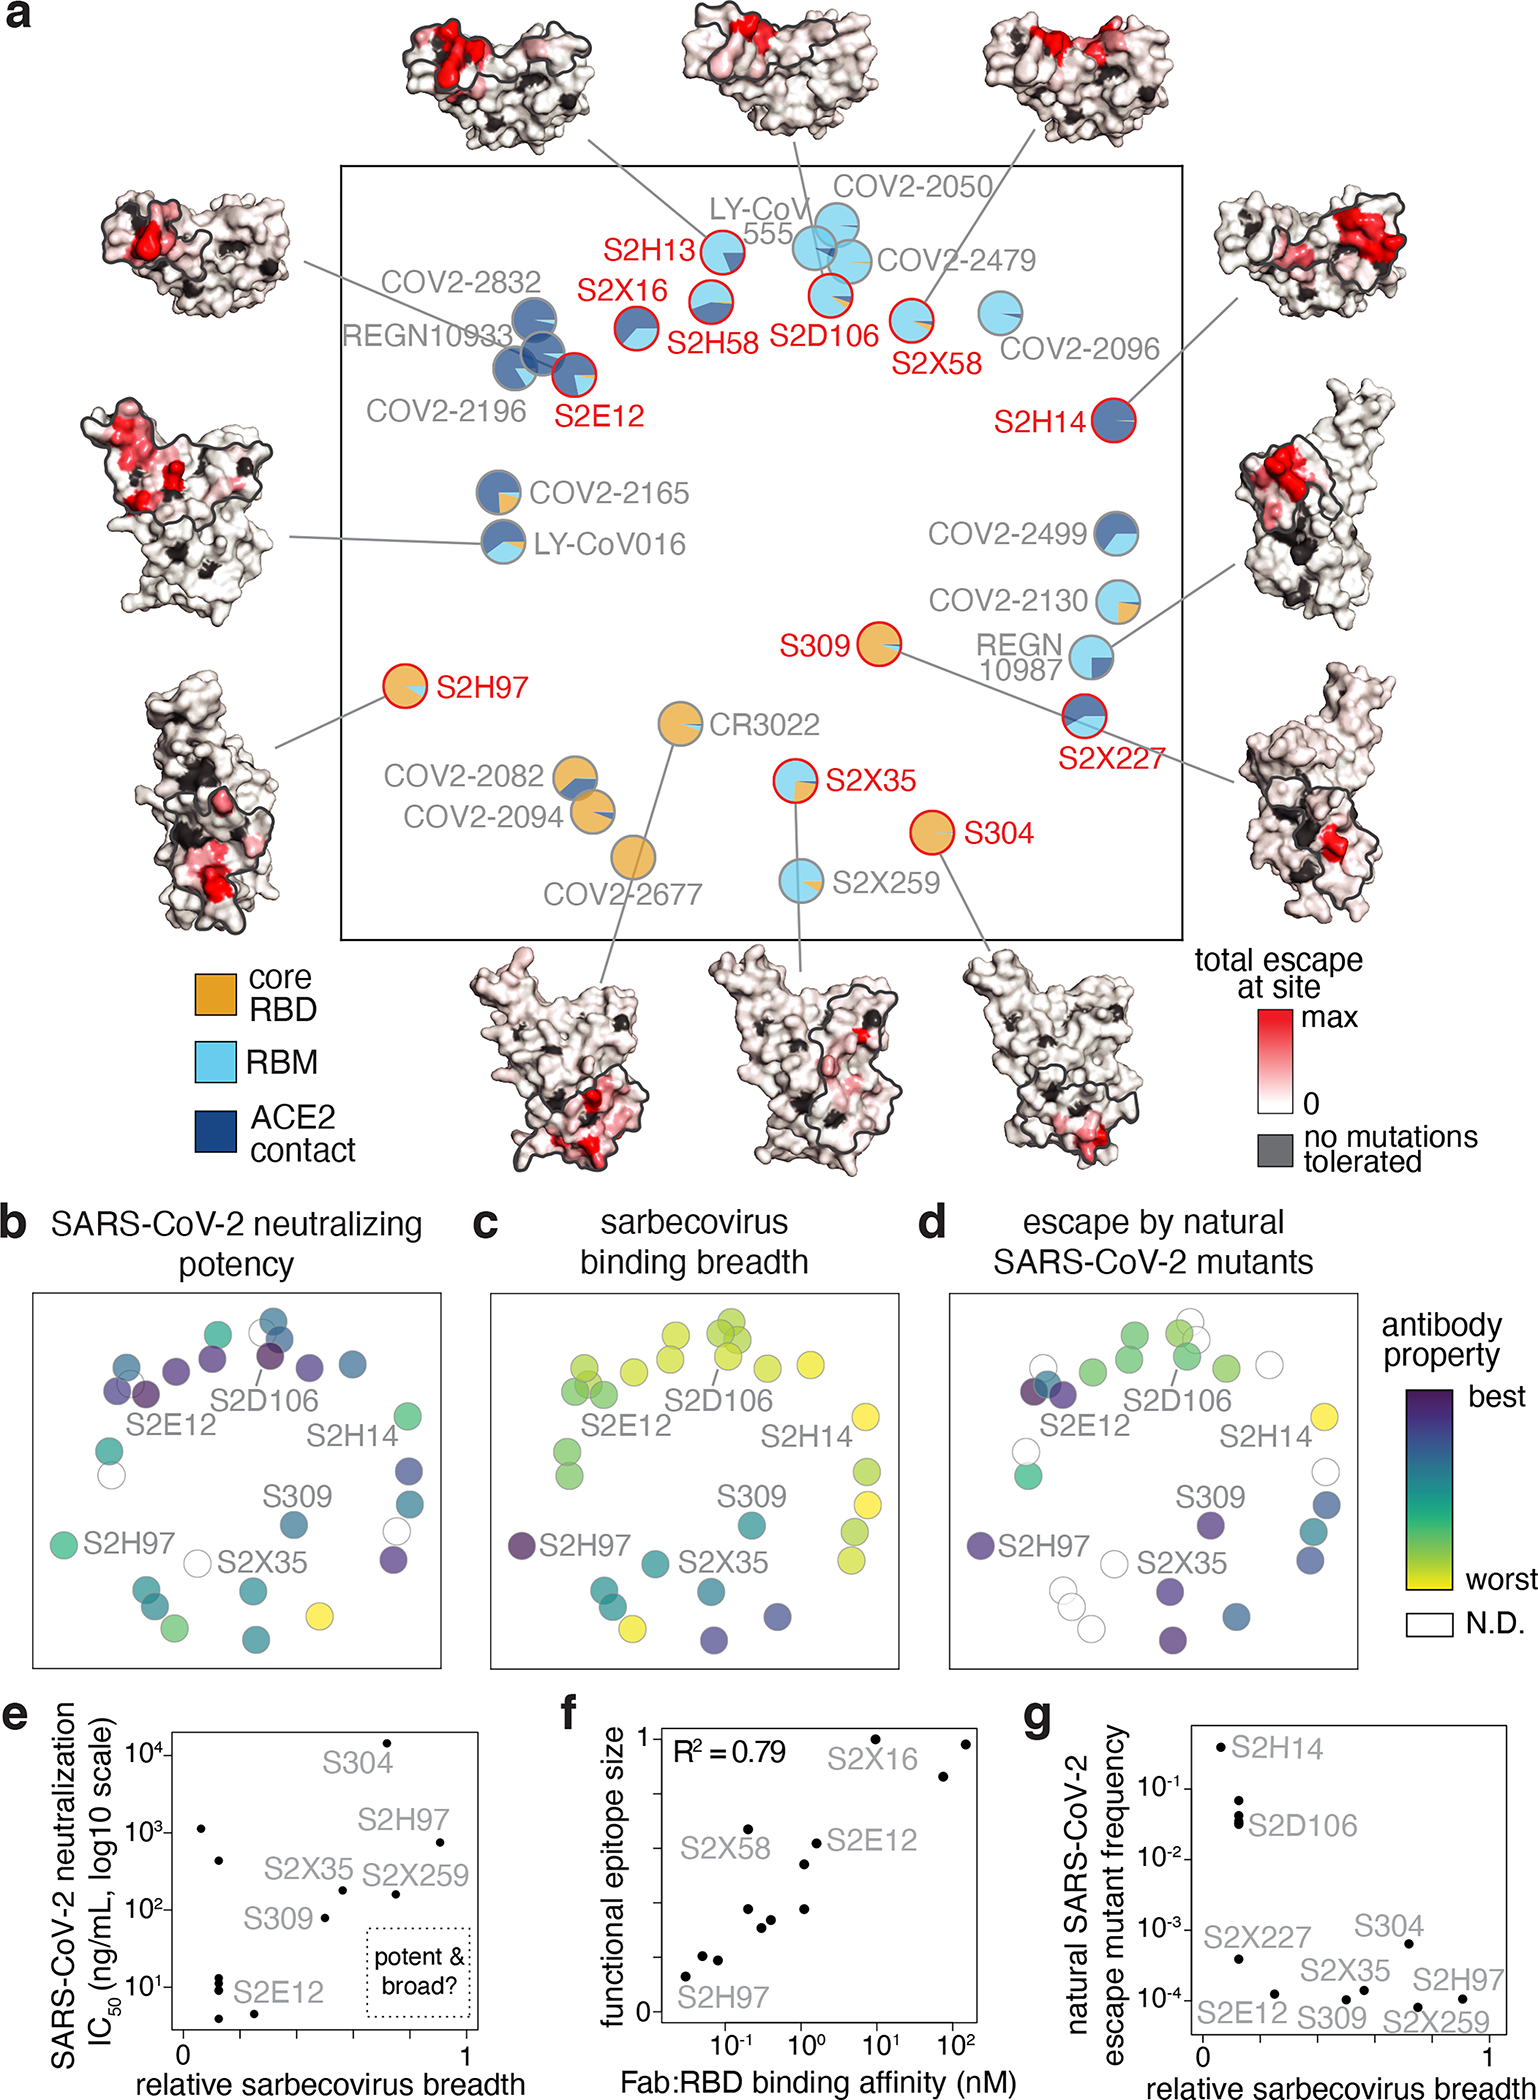
An ideal therapeutic anti-SARS-CoV-2 antibody would resist viral escape1-3, have activity against diverse sarbecoviruses4-7, and be highly protective through viral neutralization8-11 and effector functions12,13. Understanding how these properties relate to each other and vary across epitopes would aid the development of therapeutic antibodies and guide vaccine design. Here we comprehensively characterize escape, breadth and potency across a panel of SARS-CoV-2 antibodies targeting the receptor-binding domain (RBD). Despite a trade-off between in vitro neutralization potency and breadth of sarbecovirus binding, we identify neutralizing antibodies with exceptional sarbecovirus breadth and a corresponding resistance to SARS-CoV-2 escape. One of these antibodies, S2H97, binds with high affinity across all sarbecovirus clades to a cryptic epitope and prophylactically protects hamsters from viral challenge. Antibodies that target the angiotensin-converting enzyme 2 (ACE2) receptor-binding motif (RBM) typically have poor breadth and are readily escaped by mutations despite high neutralization potency. Nevertheless, we also characterize a potent RBM antibody (S2E128) with breadth across sarbecoviruses related to SARS-CoV-2 and a high barrier to viral escape. These data highlight principles underlying variation in escape, breadth and potency among antibodies that target the RBD, and identify epitopes and features to prioritize for therapeutic development against the current and potential future pandemics.


Conflict of interest statement

DECLARATION OF INTERESTS

NC, FZ, DP, MB, PH, RM, JAW, ADM, LER, JZ, MMR, HK, JD, HT, JB, CSF, MPH, JDI, GL, MA, NS, KC, SJ, MM, ED, EC, CHD, LP, FB, AT, FAL, MSP, CMH, HWV, DC and GS are or were employees of Vir Biotechnology and may hold shares in Vir Biotechnology. DC is currently listed as an inventor on multiple patent applications, which disclose the subject matter described in this manuscript. After the submission of the initial version of this study, JDB began consulting for Moderna on viral evolution and epidemiology. JDB has the potential to receive a share of IP revenue as an inventor on a Fred Hutchinson Cancer Research Center-optioned technology/patent (application WO2020006494) related to deep mutational scanning of viral proteins. HWV is a founder of PierianDx and Casma Therapeutics. Neither company provided funding for this work nor is performing related work. JCN, TIC, and DV are consultants for Vir Biotechnology Inc. The Veesler laboratory has received a sponsored research agreement from Vir Biotechnology Inc. JDC is a current member of the Scientific Advisory Boards of OpenEye Scientific Software, Interline Therapeutics, and Redesign Science. The Chodera laboratory receives or has received funding from the National Institute of Health, the National Science Foundation, the Parker Institute for Cancer Immunotherapy, Relay Therapeutics, Entasis Therapeutics, Silicon Therapeutics, EMD Serono (Merck KGaA), AstraZeneca, Vir Biotechnology, XtalPi, Interline Therapeutics, and the Molecular Sciences Software Institute, the Starr Cancer Consortium, the Open Force Field Consortium, Cycle for Survival, a Louis V. Gerstner Young Investigator Award, and the Sloan Kettering Institute. A complete funding history for the Chodera lab can be found at http://choderalab.org/funding. The other authors declare no competing interests.

Figures

Extended Data Fig. 1.
Extended Data Fig. 1.. Antibody neutralization and binding data.
a, Neutralization of authentic SARS-CoV-2 (SARS-CoV-2-Nluc) by 14 antibodies. Shown are representative live virus neutralization plots, measured with entry into Vero E6 cells. Symbols are means ± SD of technical triplicates. Dashed lines indicate IC50 and IC90 values. All antibodies were measured at each concentration point in the series, with hidden points due to overplotting reflecting overlap at the upper and lower neutralization limits. b, Correlation in antibody neutralization IC50 as determined in spike-pseudotyped VSV particles (n = 3 to 8) versus authentic SARS-CoV-2 (n = 3). c, Representative SPR sensorgrams of Fab fragments of the six newly described antibodies binding to the SARS-CoV-2 RBD. White and gray stripes indicate association and dissociation phases, respectively. Binding affinities for previously described antibodies shown in Fig. 1a are consistent with measurements from Piccoli et al. (S304, S309, S2X35, S2H13, S2H14) and Tortorici et al. (S2E12). d, Identifiers and spike genotypes of SARS-CoV-2 variants tested in neutralization assays in Figs. 2d and 3b.
Extended Data Fig. 2.
Extended Data Fig. 2.. Deep mutational scanning to map mutations that escape antibody binding.
a, Scheme of the deep mutational scanning assay. Conformationally intact RBD is expressed on the surface of yeast, where RBD expression and antibody binding is detectable via fluorescent labeling. We previously constructed mutant libraries containing virtually all of the 3,819 possible amino acid mutations in the SARS-CoV-2 RBD and sorted the library to eliminate mutations that destabilize the RBD or strongly reduce ACE2-binding affinity. We incubate the library with a sub-saturating antibody concentration and use fluorescence-activated cell sorting (FACS) to isolate yeast cells expressing RBD mutants with reduced antibody binding. Deep sequencing quantifies mutant frequencies before and after FACS selection, enabling calculation of the “escape fraction” of each amino acid mutation, which reflects the fraction of cells carrying that mutation that fall into the antibody-escape bin. Mutation escape fractions are represented in logoplots, where the height of a letter reflects the extent of escape from antibody binding. b, Representative selection gates, after gating for single cells expressing RBD as in Greaney et al.. Yeast expressing the SARS-CoV-2 RBD (top panels) are labeled at 1x, 0.01x and no antibody to guide selection gates. Mutant RBDs that reduce binding (green, gate drawn to capture 0.01x WT control) are sorted and sequenced for calculation of mutant escape fractions. This same gate was used to quantify escape within libraries of yeast expressing all sarbecovirus RBD homologs. For several antibodies, we also selected the sarbecovirus RBD library with a more stringent “full escape” gate (blue, gate drawn to capture 0 ng/mL WT control). c, Fraction of library cells falling into escape bins for each antibody selection. d, Line plots showing total escape at all RBD sites for each antibody. Sites of strong escape illustrated in logoplots in Fig. 1b,c shown with pink indicators. e,f, Correlation in per-mutation (e) and per-site (f, sum of per-mutation) escape fractions for duplicate libraries that were independently generated and assayed. N, number of mutations (e) or sites (f) in the correlation.
Extended Data Fig. 3.
Extended Data Fig. 3.. Antibody escapability from deep mutational scanning measurements and in natural SARS-CoV-2 mutants.
a, To calculate antibody escapability (Fig. 1b,c), mutation escape fractions were weighted by their deleterious consequences for ACE2 binding or RBD expression. Top plots show the weighting factor (y-axis) for mutation effects on ACE2 binding (left) and RBD expression (right). This weight factor was multiplied by the mutation escape fraction in the summation to calculate antibody escapability as described in the Methods. Histograms show the distribution of mutation effects on ACE2 binding (left) and RBD expression (right) for all mutations that pass our computational filtering steps (bottom), and mutations that are found with at least 20 sequence counts on GISAID (middle). b, Correlation in antibody relative epitope size (top) and escapability (bottom) calculated from independent deep mutational scanning replicates, compared to the averaged replicates shown in Fig. 1b,c. R2, squared Pearson correlation coefficient. c, Scatterplots illustrate the degree to which a mutation escapes antibody binding (escape fraction, y-axis) and its frequency among 1,190,241 high-quality human-derived SARS-CoV-2 sequences present on GISAID as of May 2, 2021. Large escape mutations (>5x global median escape fraction) for each antibody with non-zero mutant frequencies are labeled. Plot labels report the sum of mutant frequencies for all labeled mutations, corresponding to the natural SARS-CoV-2 mutant escape frequency for antibodies shown in Fig. 4d,g.
Extended Data Fig. 4.
Extended Data Fig. 4.. Breadth of antibody binding across sarbecoviruses.
a, Phylogenetic relationship of sarbecovirus RBDs inferred from aligned nucleotide sequences, with the four sarbecovirus clades labeled in separate colors used throughout the text. Node support values are bootstrap support values. b, Breadth of sarbecovirus binding by each antibody to a panel of yeast-displayed sarbecovirus RBDs. Data as in Fig. 1d, with the addition of secondary “full escape” selection data for S2H97, S2H13, and S2H14 (0 ng/mL WT control, Extended Data Fig. 2b,c), enabling differentiation of RBDs with intermediate binding (e.g., S2H97/RsSHC014) versus complete loss of binding. Escape fractions are calculated as the mean of replicate barcoded genotypes internal to the library. Median number of barcodes per RBD is 249, with a range of 104 to 566. The median SEM across escape fraction measurements is 0.019, with a range of 0.00005 to 0.038 across all RBD/antibody pairs. c, Flow cytometry detection of antibody binding to isogenic yeast-displayed RBD variants. d, Flow cytometry detection of antibody binding to mammalian-surface displayed spikes. e, ELISA binding of antibody to purified RBD proteins. f, SPR measurement of binding of cross-reactive antibodies (Fab) and human ACE2 to select sarbecovirus RBDs. NB, no binding; NT, not tested. Values from single replicates. g, S2H97 neutralization of VSV pseudotyped with select sarbecovirus spikes, with entry measured in ACE2-transduced BHK-21 cells. Curves are representative of two independent experiments. Points represent means, error bars standard deviation from three technical replicates, and IC50 geometric mean of experiments. IC50 values are not comparable to other experiments on Vero E6 cells (e.g. Fig. 2c) due to ACE2 overexpression and its impact on S2H97 neutralization. h, Alignment of germline-reverted and mature S2H97 heavy- (top) and light-chain (bottom) amino acid sequences. CDR sequences shown in grey box. Heatmap overlay indicates the predicted energetic contribution of antibody paratope residues from the crystal structure. i, Binding of germline-reverted and mature S2H97 to select sarbecovirus RBDs as measured by SPR. j, Neutralization of select sarbecoviruses by S2E12 (spike-pseudotyped VSV on 293T-ACE2 cells). Details as in Fig. 3c. k, Alignment of germline-reverted and mature S2E12. Details as in (h). l, Binding of germline-reverted and mature S2E12 to select sarbecovirus RBDs as measured by SPR.
Extended Data Fig. 5.
Extended Data Fig. 5.. Structures and epitopes of Fab:RBD complexes.
a, Surfaces targeted by broadly binding RBD antibodies. RBD surface is colored by site variability across sarbecoviruses. ACE2 key motifs shown in transparent red cartoon. Antibody variable domains shown as cartoon, with darker shade indicating the heavy chain. b,c, Integrative features of the S309 (b) and S2X35 (c) structural epitopes. Details as in Fig. 3g,h and Fig. 2b. d-h, Zoomed in view of the RBD bound to S309 (d), S2X35 (e), S2H97 (f), S2E12 (g), and S2D106 (h), with important contact and escape residues labeled. RBD residues colored by total site escape [scale bar, right of (d)]. i,j, Representative electron micrograph and 2D class averages of SARS-CoV-2 S in complex with the S2H97 Fab embedded in vitreous ice. Scale bar: 400 Å. Micrographs representative of 3138 micrographs. k, Gold-standard Fourier shell correlation curve for the S2H97-bound SARS-CoV-2 S trimer reconstruction. The 0.143 cutoff is indicated by a horizontal dashed line. l, Local resolution map calculated using cryoSPARC for the whole reconstruction with two orthogonal orientations. m,n, Representative electron micrograph and 2D class averages of SARS-CoV-2 S in complex with the S2D106 Fab embedded in vitreous ice. Scale bar: 400 Å. Micrographs representative of 2166 micrographs o, Gold-standard Fourier shell correlation curves for the S2D106-bound SARS-CoV-2 S trimer (black line) and locally refined RBD/S2D106 variable domains (gray line). The 0.143 cutoff is indicated by a horizontal dashed line. p, Local resolution map calculated using cryoSPARC for the whole reconstruction and the locally refined RBD/S2D106 variable domain region.
Extended Data Fig. 6.
Extended Data Fig. 6.. Mechanism of action of S2H97 neutralization and protection.
a, Quaternary context of the S2H97 epitope. Left, S2H97-bound RBD, with RBD sites colored by S2H97 escape (scale bar, bottom). Right, RBD in the same angle as left, in the closed spike trimer. b, CryoEM structure of S2H97 Fabs (green surfaces) bound to SARS-CoV-2 S indicating the extensive opening of the RBD (yellow surface) necessary to access the S2H97 epitope. Closed RBD (light purple surface, PDB 7K43) and site II Fab S2A4 bound open RBD (gray surface, PDB 7JVC) are shown for comparison. Spike protomers are shown in yellow, blue, and pink. c, Antibody-mediated S1 shedding from cell-surface expressed SARS-CoV-2 S as determined by flow cytometry. d, Cell-cell fusion of CHO cells expressing SARS-CoV-2 S (CHO-S) incubated with variable concentrations of antibody. e, Antibody competition with RBD-ACE2 binding determined by ELISA. Points represent mean of technical duplicates. f, S2H97 neutralization of SARS-CoV-2 S pseudotyped VSV on ACE2-overexpressing cells (293T-ACE2) compared to Vero E6 cells. Points reflect mean and error bars reflect standard deviation from triplicate measurements. Curves are representative of two biological replicates. g, Antibody inhibition of cell-to-cell fusion of Vero E6 cells transfected with SARS-CoV-2 S. h, Influence of circulating S2H97 level on prophylactic efficacy in Syrian hamsters. Infectious virus titers (right y-axis, triangles) and RNA levels (left y-axis, circles) reflect the data represented in Fig. 2f, measured in hamsters four days after SARS-CoV-2 challenge in animals prophylactically dosed with 25 mg/kg S2H97 (magenta symbols) or isotype control (white symbols). The levels of circulating S2H97 (D0, before infection, μg/mL) are shown on the x-axis (LLOQ, lower level of quantification). ** p=0.0048 (virus titer) and p=0.0048 (RNA) vs control isotype, two-sided Mann-Whitney test (the 2 animals shown with no detectable serum antibody were excluded from the comparison).
Extended Data Fig. 7
Extended Data Fig. 7. Escapability and the relationships among antibody properties.
a, Additional spike-VSV viral escape selections, as in Fig. 3a, and an illustration of the authentic SARS-CoV-2 escape data for S309 reported in Cathcart et al.. b, Correlation between the number of unique mutations selected across viral escape selection experiments and antibody escapability as tabulated in Fig. 1b,c, plus S2X259. c, Projected epitope space from Fig. 4a annotated by antibody properties as in Fig. 4b–d. For each property, antibodies are colored such that purple reflects the most desirable antibody (scale bar, right; N.D., not determined): narrowest functional epitope, tightest binding affinity (KD, log10 scale), lowest escapability. d, Pairwise scatterplots between all antibody properties discussed in the main text. Select scatterplots from this panel are shown in Figs. 4e–g. Details of each property described in Methods. All axes are oriented such that moving up on the y-axis and right on the x-axis corresponds to moving in the “preferred” direction for an antibody property (lower neutralization IC50, lower KD, higher breadth, narrower epitope size, lower escapability, lower total frequency of SARS-CoV-2 escape mutants among sequences on GISAID).
Fig. 1.
Fig. 1.. Potency, escapability, and breadth of a panel of RBD antibodies.
a, SARS-CoV-2 neutralization potency (authentic virus [n=3] and spike-pseudotyped VSV particles [n = 3 to 8] on Vero E6 cells), Fab:RBD binding affinities measured by SPR [n = 2 to 4], and epitope classifications. Additional details in Extended Data Table 1. b,c, Deep mutational scanning maps of mutations that escape binding by antibodies targeting the core RBD (b) or the receptor-binding motif (c). Letter height indicates that mutation’s strength of escape from antibody binding. Letters colored by effect on folded RBD expression (b) or ACE2 binding affinity (c). Relative “functional epitope size” and “escapability” are tabulated at right, scaling from 0 (no escape mutations) to 1 (largest epitope/most escapable antibody). Heatmaps, bottom, illustrate variability among sarbecovirus or SARS-CoV-2 sequences. d, Antibody binding to a pan-sarbecovirus RBD panel. Heatmap illustrates binding from FACS-based selections (scale bar, bottom left). Asterisks, reduced-affinity binding in secondary binding assays (Extended Data Fig. 4a–f).
Fig. 2.
Fig. 2.. The pan-sarbecovirus S2H97 antibody.
a, Composite model of the SARS-CoV-2 trimer with cross-reactive antibodies. Epitopes recognized by each Fab are shown as colored surface and ACE2 footprint as a black outline. b, Integrative features of the S2H97 structural footprint (5 Å cutoff). Heatmaps illustrate evolutionary variability (blue), functional constraint from prior deep mutational scans (gray), and energetic contribution to binding from the static crystal structure or molecular dynamics simulation (green). Logoplot as in Fig. 1b. Asterisk, introduction of N-linked glycosylation motifs. c, S2H97 breadth of neutralization (spike-pseudotyped VSV on Vero E6 cells). Curves representative of at least two independent experiments. Points represent means, error bars standard deviation from three technical replicates, and IC50 geometric mean of experiments. d, S2H97 neutralization of SARS-CoV-2 variants (Extended Data Fig. 1d; spike-pseudotyped VSV on Vero E6 cells). Points represent individual measurements and bar mean fold-change in neutralization potency. e, Negative stain EM imaging of native-like soluble prefusion S trimer (left) or S incubated with S2H97 (right). Micrographs representative of 51 (SARS-CoV-2 S) and 173 (+S2H97) micrographs. f, S2H97 prophylactic efficacy in Syrian hamsters. Infectious virus titers (left) and RNA levels (right) measured in hamsters four days after SARS-CoV-2 challenge in animals prophylactically dosed with 25 mg/kg S2H97 or isotype control. Two animals with undetectable S2H97 levels (<50 ng/mL) at the time of viral challenge are marked by ‡. ** p=0.0048 (virus titer) and p=0.0048 (RNA) vs control, two-sided Mann-Whitney test (animals with no detectable serum antibody excluded). g, Blockade of binding by sera from SARS-CoV-2-infected (top) or vaccinated (bottom) donors. Percentage of samples with blockade above the lower detection limit are indicated.
Fig. 3.
Fig. 3.. Breadth and escapability among RBM antibodies.
a, Escape mutations in spike-expressing VSV passaged in the presence of monoclonal antibody. Plot shows mutation effects on antibody (x-axis) and ACE2 (y-axis) binding. b, Neutralization of SARS-CoV-2 variants by S2E12 (spike-pseudotyped VSV on Vero E6 cells), as in Fig. 2d. c, S2E12 breadth of neutralization (spike-pseudotyped VSV on 293T-ACE2 cells). Points represent mean of biological duplicates. d, Replicative fitness of S2E12 escape mutations identified in (a) on Vero E6 cells. Points represent mean and error bars standard error from triplicate experiments. e,f, Structures of S2E12 Fab (e) and S2D106 Fab (f) bound to SARS-CoV-2 RBD. RBD sites colored by escape (scale bar, center). The E484 side chain is included for visualization purposes only but was not included in the final S2D106-bound structure due to weak density. g,h, Integrative features of the structural footprints (5 Å cutoff) of S2E12 (g) and S2D106 (h). Sites are ordered by the frequency of observed mutants among SARS-CoV-2 sequences on GISAID. Heatmaps as in Fig. 2b. Logoplots as in Fig. 1c, but only showing amino acid mutations accessible via single-nucleotide mutation from Wuhan-Hu-1 for comparison with (a). Barplots illustrate frequency of SARS-CoV-2 mutants and their validated effects on antibody neutralization (spike-pseudotyped VSV on Vero E6 cells). Red, >10-fold increase in IC50 due to mutation.
Fig. 4.
Fig. 4.. Antibody epitope, potency, breadth, and escapability.
a, Multidimensional scaling projection of similarities in antibody binding-escape maps from this (red) and prior (gray) studies. Pie charts illustrate the RBD sub-domains where mutations confer escape (bottom left). Structural projections of escape arrayed around the perimeter (scale bar, bottom right), with gray outlines tracing structural footprints. b-d, Projected epitope space from (a) annotated by antibody properties. For each property, antibodies are colored such that purple reflects the most desirable antibody (scale bar, right): most potent neutralization (log10 scale), highest breadth, and lowest natural frequency of escape mutants (log10 scale). e, Relationship between SARS-CoV-2 neutralization potency and sarbecovirus breadth for antibodies in this study and S2X259. f, Relationship between functional epitope size and SARS-CoV-2 RBD binding affinity. g, Relationship between natural SARS-CoV-2 escape mutant frequency (Extended Data Fig. 3c) and sarbecovirus breadth.

Update of

Comment in

References

    1. Liu Z et al. Identification of SARS-CoV-2 spike mutations that attenuate monoclonal and serum antibody neutralization. Cell Host Microbe 29, 477–488.e4 (2021). - PMC - PubMed
    1. Weisblum Y et al. Escape from neutralizing antibodies by SARS-CoV-2 spike protein variants. Elife 9, e61312 (2020). - PMC - PubMed
    1. Greaney AJ et al. Complete Mapping of Mutations to the SARS-CoV-2 Spike Receptor-Binding Domain that Escape Antibody Recognition. Cell Host Microbe 29, 44–57.e9 (2021). - PMC - PubMed
    1. Pinto D et al. Cross-neutralization of SARS-CoV-2 by a human monoclonal SARS-CoV antibody. Nature 583, 290–295 (2020). - PubMed
    1. Rappazzo CG et al. Broad and potent activity against SARS-like viruses by an engineered human monoclonal antibody. Science 371, 823–829 (2021). - PMC - PubMed

Publication types

MeSH terms